

Briefly: in our opinion, full (300% of the regular position size) speculative short positions in junior mining stocks are justified from the risk/reward point of view at the moment of publishing this Alert.
In yesterday’s analysis, I emphasized that gold’s shooting star reversal was a very bearish indication for gold. Indeed, gold declined. What’s next?
Quoting my yesterday’s analysis:
Last week was full of events, but the most important one clarified after Friday’s closing bell – gold formed a reversal “shooting star” candlestick.
The implications are just what you think they are. After a sharp run-up, the rally has run its course, and the yellow metal is now about to slide again.
Let’s take a closer look.
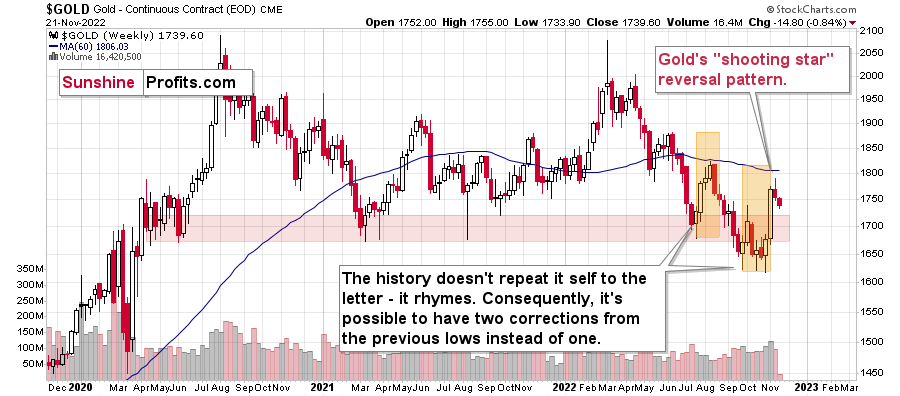
The corrective upswing was quite sizable and sharp. It was bigger than what we saw in July and August 2022, and this time, gold needed just two weeks to rally, instead of four.
Back in mid-2022, it then took gold three weeks to decline to more or less where the corrective rally started. So, yes, gold fell a bit faster than it had climbed.
History rhymes, so this time, the decline could be sharper than the rally as well. And since the rally took just two weeks… It looks like the next week or two might be very interesting for gold investors/traders. And bearish.
Actually, the next ~1.5 weeks because this week’s trading will be limited due to Thanksgiving.
You might be wondering why I forecast that the gold price would be about to “slide” instead of just moving lower in a more or less regular manner.
The analogy to what gold did in 2013 is one of the major reasons.
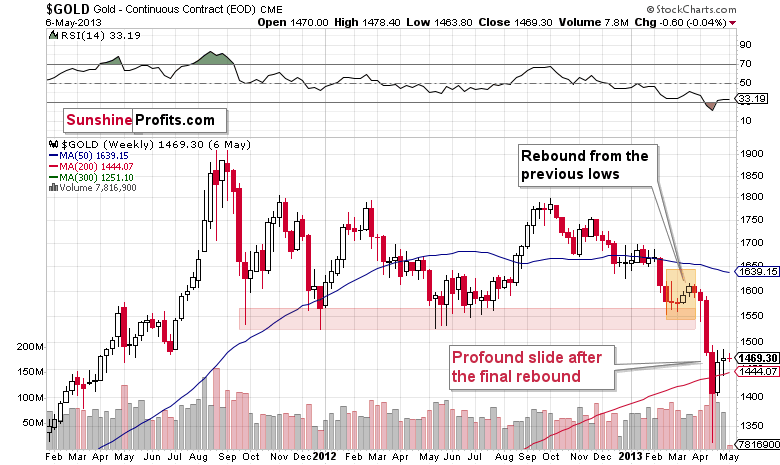
The first thing that you can notice on the above chart is that it looks just like the previous one, even though they are almost a decade apart. And that’s true.
How is that even possible, given different economic and geopolitical realities? It’s possible because the key drivers behind decisions to buy and sell remain the same: fear and greed. Those don’t change, people tend to react similarly to similar price/volume patterns.
Of course, each situation is specific, which is why history doesn’t repeat itself to the letter, but it does tend to rhyme.
When you compare the situations marked with orange on both charts, you’ll realize that we’re most likely in a situation where gold is just before a major slide.
Consequently, last week’s “shooting star” candlestick is not “just” a reversal pattern. It’s a reversal pattern that likely marks the beginning of a new stage of the bigger self-similar pattern. A stage that is characterized by a dramatic downswing.
Gold declined by almost $15 yesterday, so it seems that the above-mentioned decline is already underway.
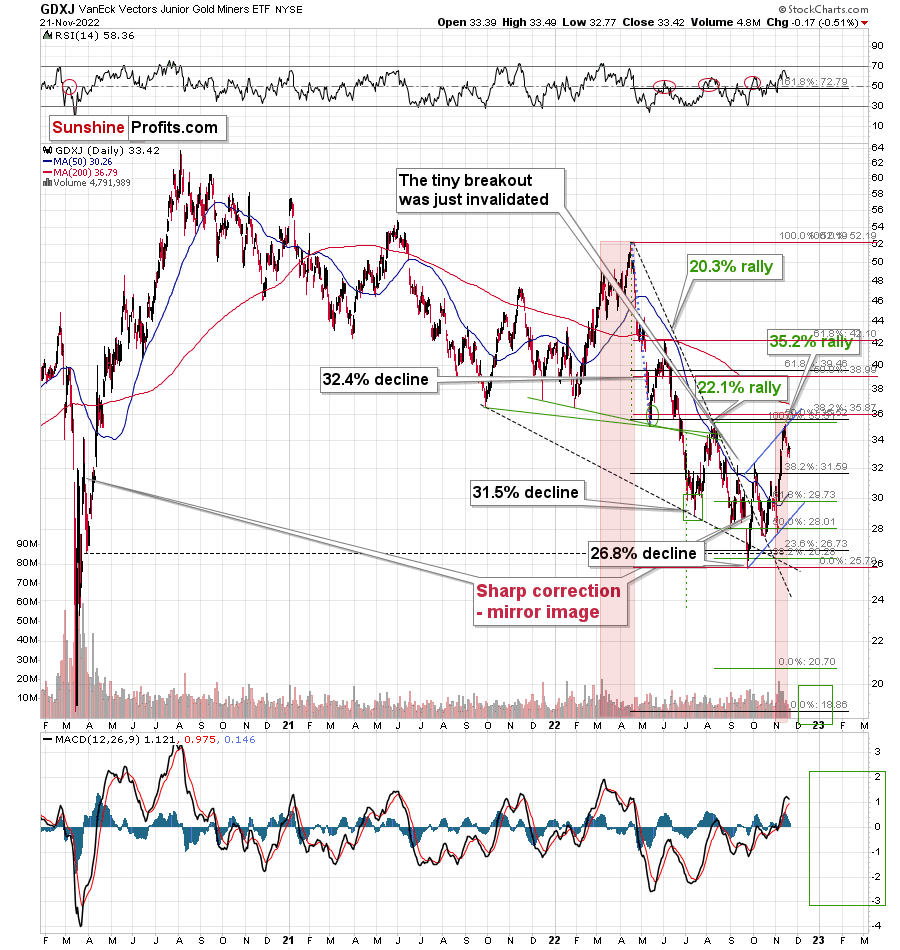
Mining stocks haven’t declined profoundly yet, but that’s probably due to the fact that stock market prices haven't declined so far either.
As gold declines more, miners are likely to follow it lower pretty much regardless of what the stock market does, but still, it seems very likely to me that the latter will slide anyway. And yes, stock prices’ decline would be likely to result in much lower mining stock values.
In other words:
- If gold declines significantly but stocks don’t, miners are likely to decline significantly anyway.
- If gold and stocks decline significantly, miners are likely to decline in an extreme manner.
In my view, the latter is the most likely outcome for the following weeks/months.
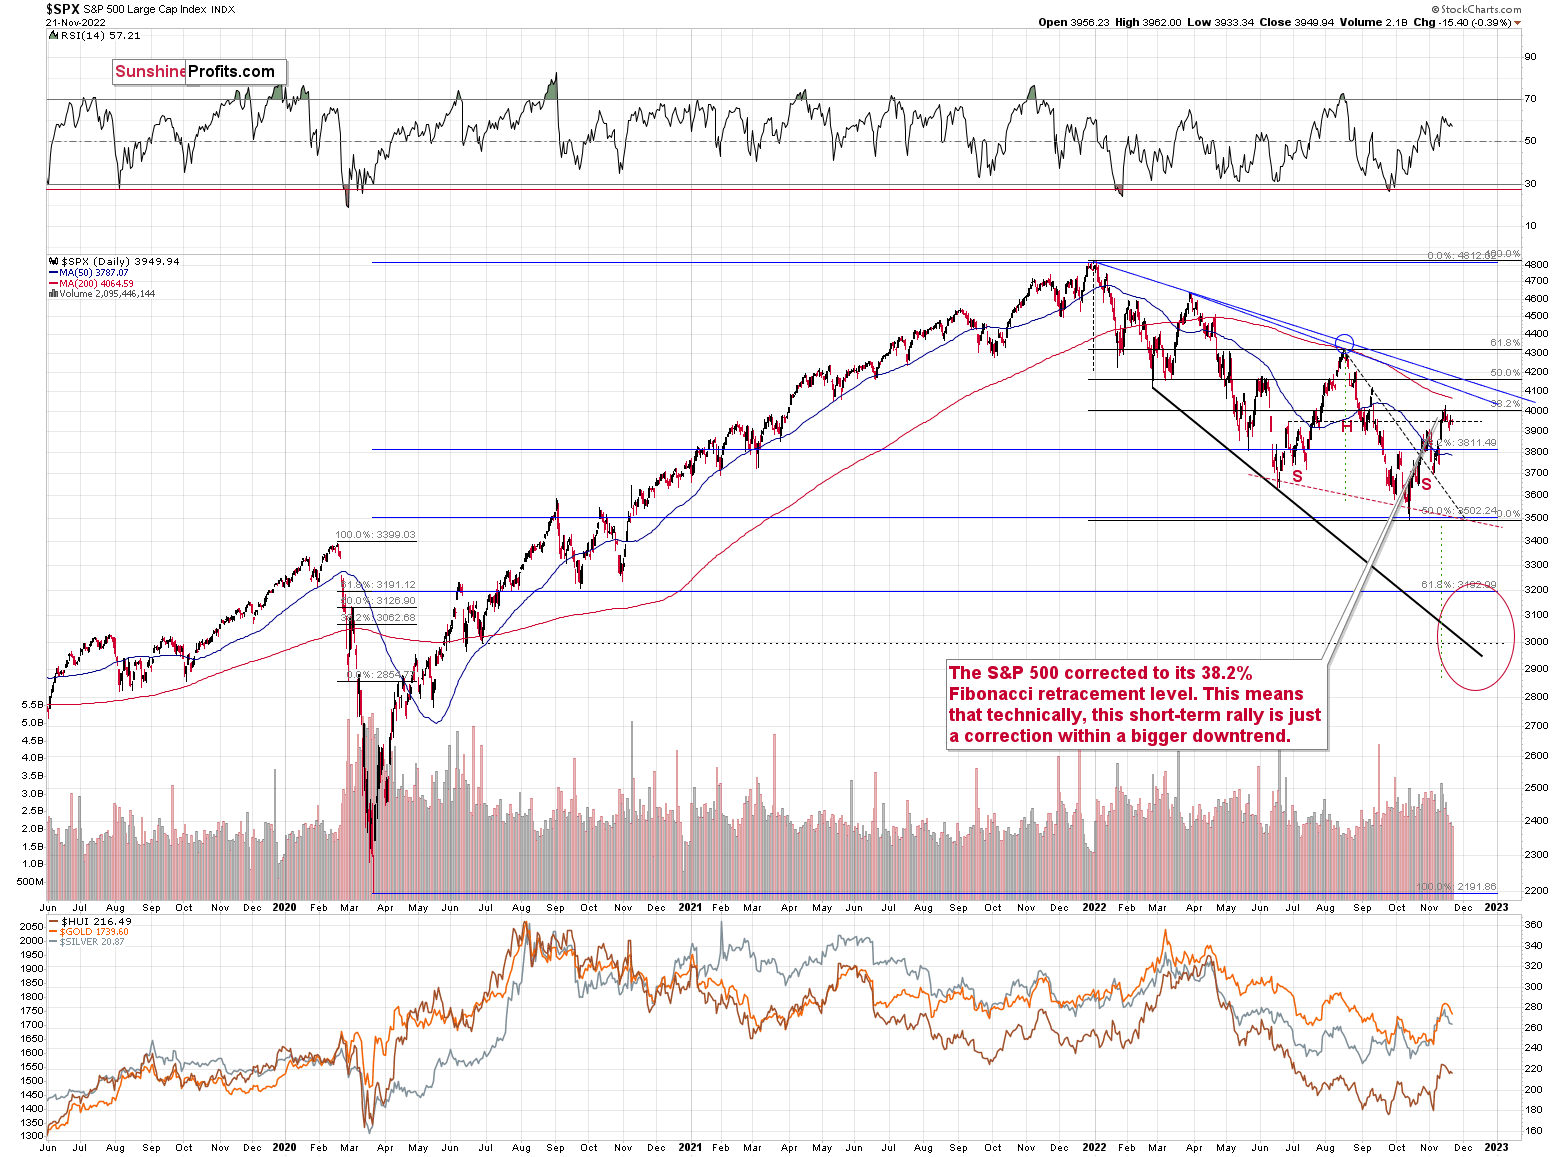
I previously wrote that the S&P 500 Index failed to break above the 4,000 level and its 38.2% Fibonacci retracement level. At the moment of writing these words, the S&P 500 futures are trading at about 3,950. This resistance remains intact. Stocks have been unable to move above those levels, which means that the bearish implications of their failed attempt remain in place.
The current medium-term trend remains down, and the above paragraph indicates that it’s about to resume.
As I wrote earlier, this is likely to have profoundly bearish implications for mining stocks. It’s also the case with regard to silver prices, but let’s keep in mind that silver tends to catch up with gold and mining stocks in the final part of a given move. Consequently, miners could decline profoundly first, and silver could decline profoundly a bit later.
Having said that, let’s take a look at the markets from a more fundamental point of view.
The Gold Price Went from Unloved to Over-Loved
With risk assets suffering further declines on Nov. 21, the uninformed optimism is slowly starting to dissipate. Moreover, with overly bearish positioning as the main driver of the recent recalibration, the ominous fundamentals make it difficult for the bulls to muster more upside catalysts. To explain, I wrote on Nov. 16:
While the new narrative assumes that inflation is dead, bonds are a buy, and liquidity-fueled assets like tech stocks and the PMs are poised for new highs, the sentiment shift is bullish for our GDXJ ETF short position.
In a nutshell: when too many investors see things from our perspective, positioning gets crowded, and the unwinding of bearish bets uplifts the metals. Conversely, when our thesis becomes contrarian once again, the PMs need sustainable fundamental and technical reasons to move higher, which we believe they lack.
So, while the GDXJ ETF’s recent rally has not been fun, the fundamentals never changed, only sentiment did; and with that same sentiment now dangerously over-bullish, positioning supports another leg lower for gold, silver, and mining stocks.
Thus, while the junior miners and the gold price have declined since then, positioning is no longer helping the bulls; and though S&P 500 seasonality supports higher prices, the sentiment shift is positive for our GDXJ ETF short position.
To that point, the USD Index recorded a material rally on Nov. 21, and with the crowd turning bearish on the dollar basket, the herd behavior should provide fuel for the next upswing.
For example, non-commercial (speculative) futures traders are net short the U.S. dollar for the first time since mid-2021.
Please see below:
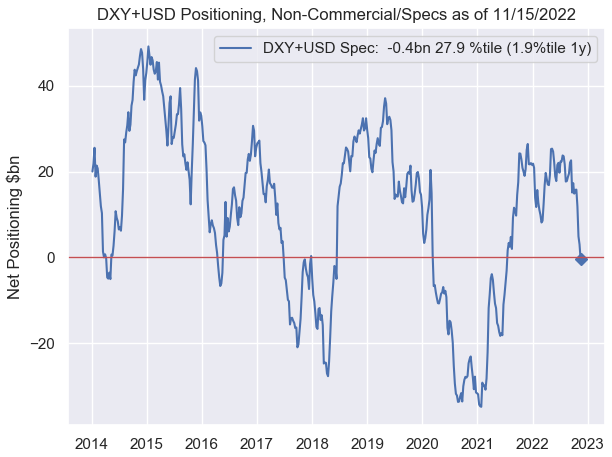 Source: Nomura
To explain, the blue line above tracks speculative U.S. dollar net futures positioning, while the horizontal red line represents the neutral level. If you analyze the right side of the chart, you can see that speculators have dumped the dollar, though not present on the chart, feverously bought the euro.
However, the misguided shift is bullish for the USD Index because positioning is no longer stretched, and a reversal of these moves should drive the dollar higher over the medium term.
As further evidence, asset managers also ramped up their bets against the U.S. dollar.
Please see below:
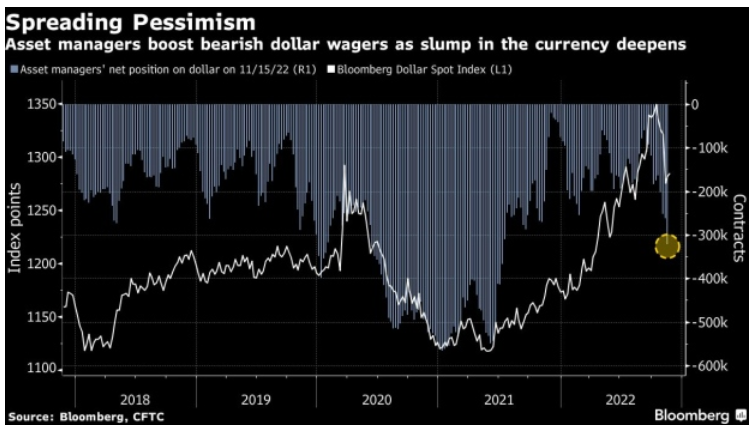
To explain, the white line above tracks the Bloomberg Dollar Spot Index, while the blue bars above track asset managers’ net short positions. If you analyze the right side of the chart, you can see that bearish bets have intensified, and the crowd is loving the pivot narrative.
The Bloomberg article stated:
“Investors boosted short positions on the reserve currency to 321,758 contracts last week, the most since July 2021, according to data from the Commodity Futures Trading Commission on eight currency pairs compiled by Bloomberg. Hedge funds are similarly bearish: they sold the greenback for a fifth straight week (…).”
“Asset managers boosted bullish wagers on the euro while cutting net shorts on the yen and pound, underscoring the shift in sentiment toward the U.S. currency.”
Yet, notice how the USD Index enjoyed a sharp daily rally soon after the crowd turned bearish? Remember, joining the consensus is suboptimal because sharp reversals can occur when sentiment shifts. However, with the consensus dumping the dollar, the positioning is where we want it to be, and a stronger USD Index should materialize in the months ahead.
Also, remember how bearish positioning helped ignite the S&P 500's short squeeze? Well, that imbalance has also reversed. I added on Nov. 16:
The sector performance highlights why the PMs’ squeeze has likely run its course, as all of these assets will need fresh buyers to support higher prices. As evidence, Goldman Sachs’ basket of the most-shorted stocks is up by ~18% over the last four days.
Please see below:
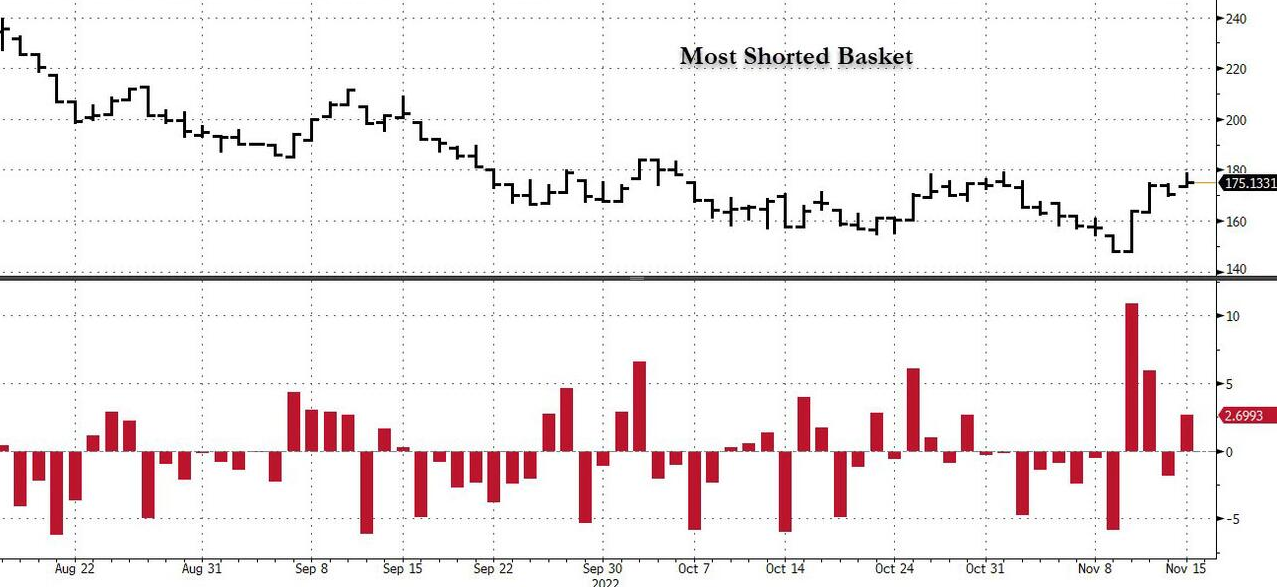 Source: Bloomberg/ZeroHedge
To explain, the black line at the top half of the chart tracks the performance of Goldman Sachs’ most-shorted basket, while the red bars at the bottom half add visual clarity. If you analyze the right side of the chart, you can see that the red bars rose materially, which means the stock market’s short-covering surge is much less bullish than it seems.
In addition, while Commodity Trading Advisors (CTAs) flipped from net short to net long, the algorithms are also struggling to find bullish catalysts to increase their exposure further.
Please see below:
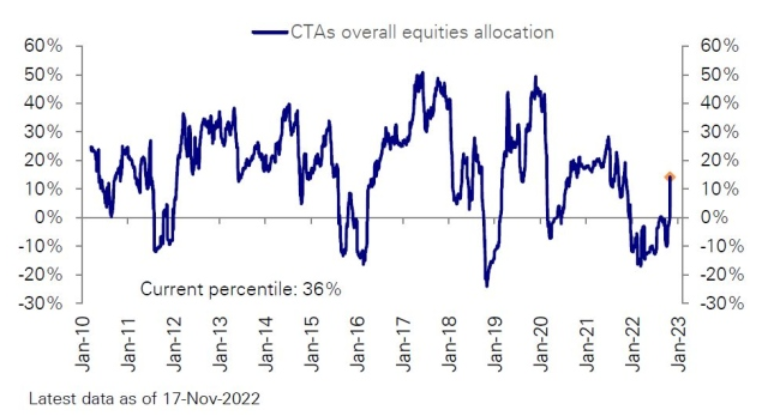 Source: Deutsche Bank
To explain, the blue line above tracks CTAs' equity positioning. If you analyze the right side of the chart, you can see that algorithmic exposure increased from roughly -10% to north of 10% in recent weeks.
The Bloomberg article stated:
CTAs “had to buy an estimated $146 billion of stocks in the past month amid a Consumer Price Index (CPI)-reading fueled rally, the largest buying spree since March 2020, according to an estimate from Scott Rubner, a Goldman Sachs Group Inc. managing director (…). Quants were caught off guard following the latest cooler-than-expected CPI print as it sparked a cross-asset rally and a stock-buying spree.”
However, please remember that these funds often increase and decrease their exposure based on volatility; and with the Cboe Volatility Index (VIX) near the low end of its 2022 range, don’t be surprised if volatility intensifies and CTAs rush for the exits.
Please see below:
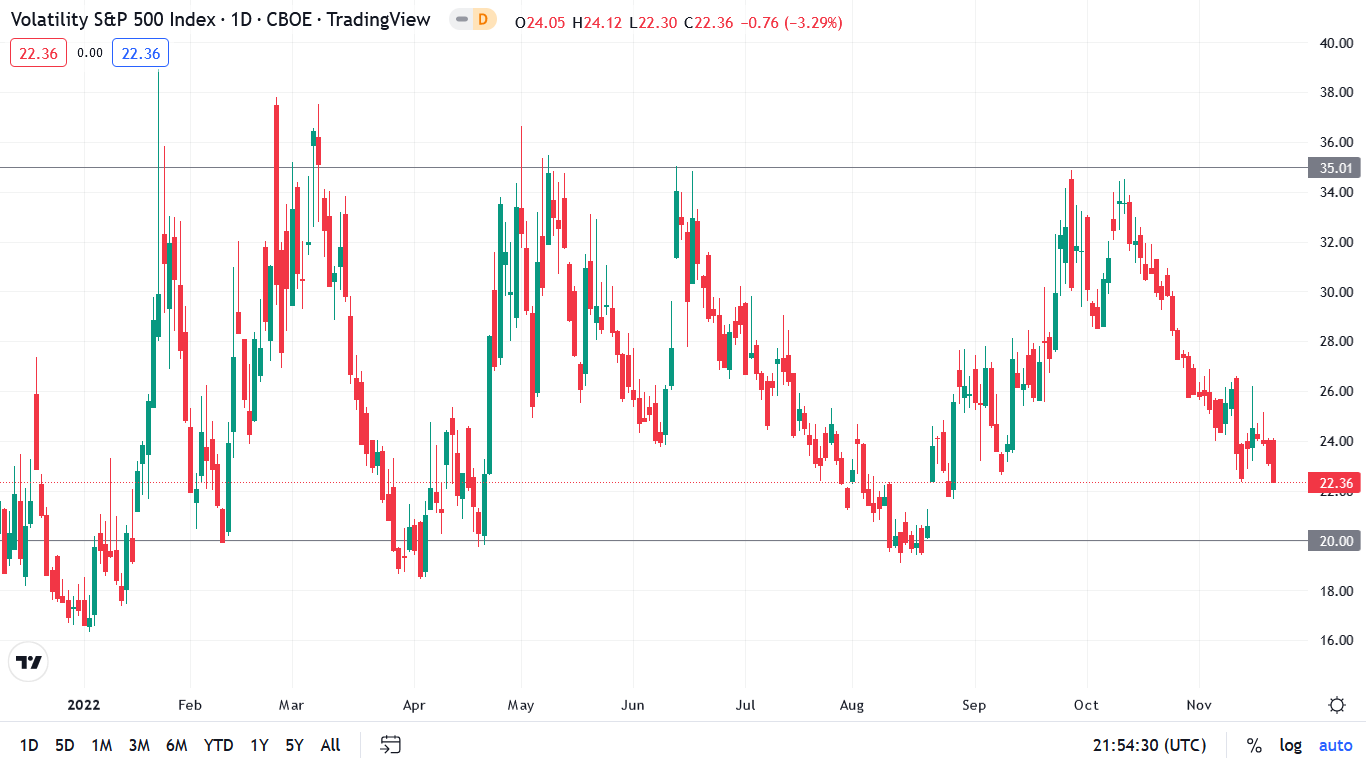
To explain, the candlesticks above track the Cboe Volatility Index (VIX). For context, it measures the S&P 500’s expected volatility over the next 30 days. If you analyze the horizontal gray lines, you can see that the VIX has formed a rough channel between 20 and 35 in 2022; and with the metric ending the Nov. 21 session at ~22, the seasonality bulls are happy to suppress volatility despite the bearish fundamentals.
However, with the VIX poised for another sharp uprising, the GDXJ ETF and the S&P 500 confront an opposite positioning backdrop compared to mid-October. Moreover, with the gold price also suffering four straight daily declines, sentiment is the only thing keeping risk assets elevated.
Yet, with the law of gravity implying that ‘what goes up must come down,’ the bear-to-bull positioning shift should elicit substantial drawdowns when the next bout of volatility erupts. I wrote on Nov. 15:
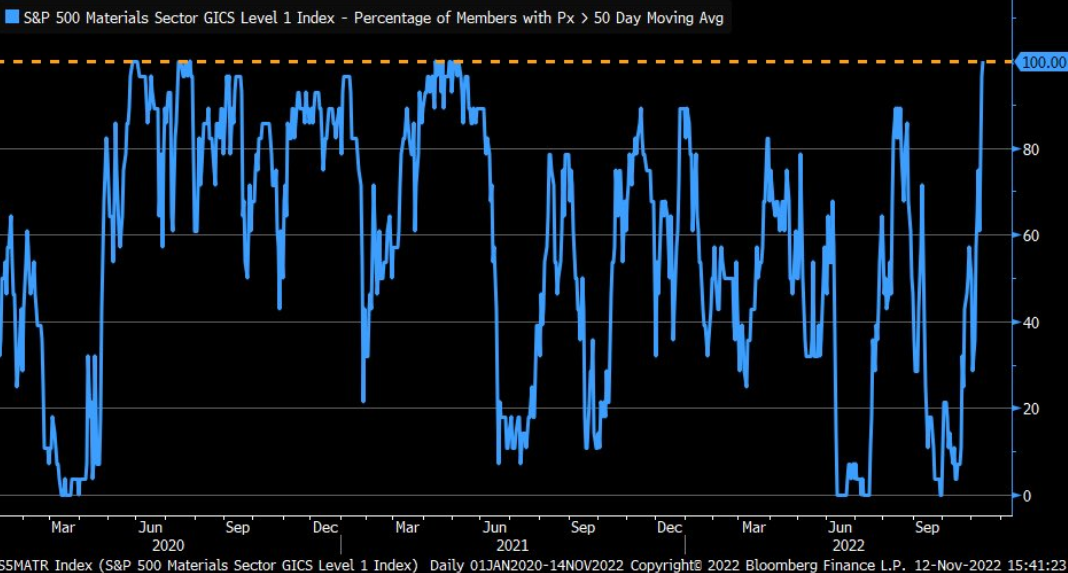
The blue line above tracks the percentage of companies in the materials sector trading above their 50-day moving average. For context, metals and mining make up roughly 14% of the sector. If you analyze the right side of the chart, you can see that the figure stands at 100%, which is a sizable shift from the 0% present in late September.
As a result, the data highlights why we’re likely much closer to the top than the bottom; and notice how abnormally high and low readings are nearly impossible to sustain? This is because periods of too much pessimism and optimism often revert to the average when investors take a thoughtful look at the fundamentals.
Therefore, since the metric can’t go any higher, a material reversal should result in substantial declines for gold, silver, and mining stocks over the medium term.
The Daly Brief
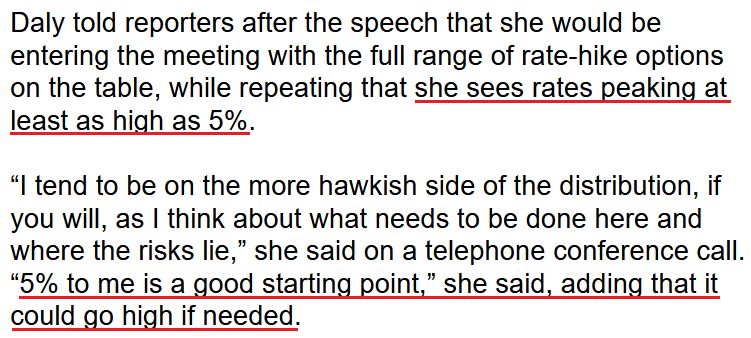
With Fed officials reiterating their commitment to curbing inflation, rate hike expectations have recovered nearly all of their CPI-induced losses; and with San Francisco Fed President Mary Daly joining the fray on Nov. 21, she said:
“As we work to bring policy to a sufficiently restrictive stance – the level required to bring inflation down and restore price stability – we will need to be mindful. Adjusting too little will leave inflation too high. Adjusting too much could lead to an unnecessarily painful downturn.”
She added:
“I really want to make sure the job is well and fully done. Inflation is a regressive tax. It injures most the people least able to bear it. Ending early in hope that it will go away and we’ve done enough is not at all satisfying to me.”
So, while the pivot crowd continues to buy hope and sell reality, the U.S. federal funds rate (FFR) still has plenty of room to run.
Please see below:
 Source: Bloomberg
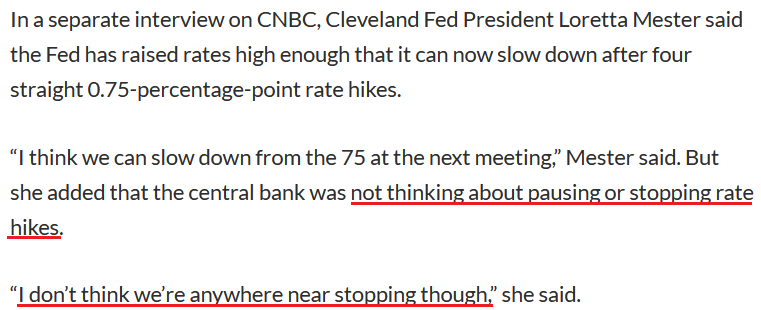
Also noteworthy, Cleveland Fed President Loretta Mester sang a similar tune on Nov. 21. She said:
“I don’t think we should underestimate the consequences of continued inflation in the long run for the health of the economy.”
Moreover, while she noted that it’s appropriate to slow down the “pace of increases” in the months ahead, she made it clear that a higher FFR is on the horizon.
 Source: MarketWatch
The Bottom Line
With reality slowly returning to the financial markets, the S&P 500 has suffered, while the gold price has also been on the defensive. However, with the dip buyers still showing up intraday, the seasonality bulls are hoping for a Santa Clause rally. But with Fed officials destroying the pivot narrative and the fundamentals profoundly bearish, the PMs should confront lower lows in the months ahead.
In conclusion, the PMs declined on Nov. 21, as the USD Index regained its swagger; and while the U.S. 10-Year real yield declined, it’s still north of 1.5%. Thus, while sentiment is relatively optimistic, bullish positioning is stretched, and we believe that shorting the GDXJ ETF remains attractive from a risk-reward perspective.
Overview of the Upcoming Part of the Decline
- It seems to me that the corrective upswing is over (or about to be over) and that the next big move lower is already underway (or that it’s about to start).
- If we see a situation where miners slide in a meaningful and volatile way while silver doesn’t (it just declines moderately), I plan to – once again – switch from short positions in miners to short positions in silver. At this time, it’s too early to say at what price levels this could take place and if we get this kind of opportunity at all – perhaps with gold prices close to $1,500 - $1,550.
- I plan to switch from the short positions in junior mining stocks or silver (whichever I’ll have at that moment) to long positions in junior mining stocks when gold / mining stocks move to their 2020 lows (approximately). While I’m probably not going to write about it at this stage yet, this is when some investors might consider getting back in with their long-term investing capital (or perhaps 1/3 or 1/2 thereof).
- I plan to return to short positions in junior mining stocks after a rebound – and the rebound could take gold from about $1,450 to about $1,550, and it could take the GDXJ from about $20 to about $24. In other words, I’m currently planning to go long when GDXJ is close to $20 (which might take place when gold is close to $1,450), and I’m planning to exit this long position and re-enter the short position once we see a corrective rally to $24 in the GDXJ (which might take place when gold is close to $1,550).
- I plan to exit all remaining short positions once gold shows substantial strength relative to the USD Index while the latter is still rallying. This may be the case with gold prices close to $1,400 and GDXJ close to $15 . This moment (when gold performs very strongly against the rallying USD and miners are strong relative to gold after its substantial decline) is likely to be the best entry point for long-term investments, in my view. This can also happen with gold close to $1,400, but at the moment it’s too early to say with certainty.
- The above is based on the information available today, and it might change in the following days/weeks.
You will find my general overview of the outlook for gold on the chart below:
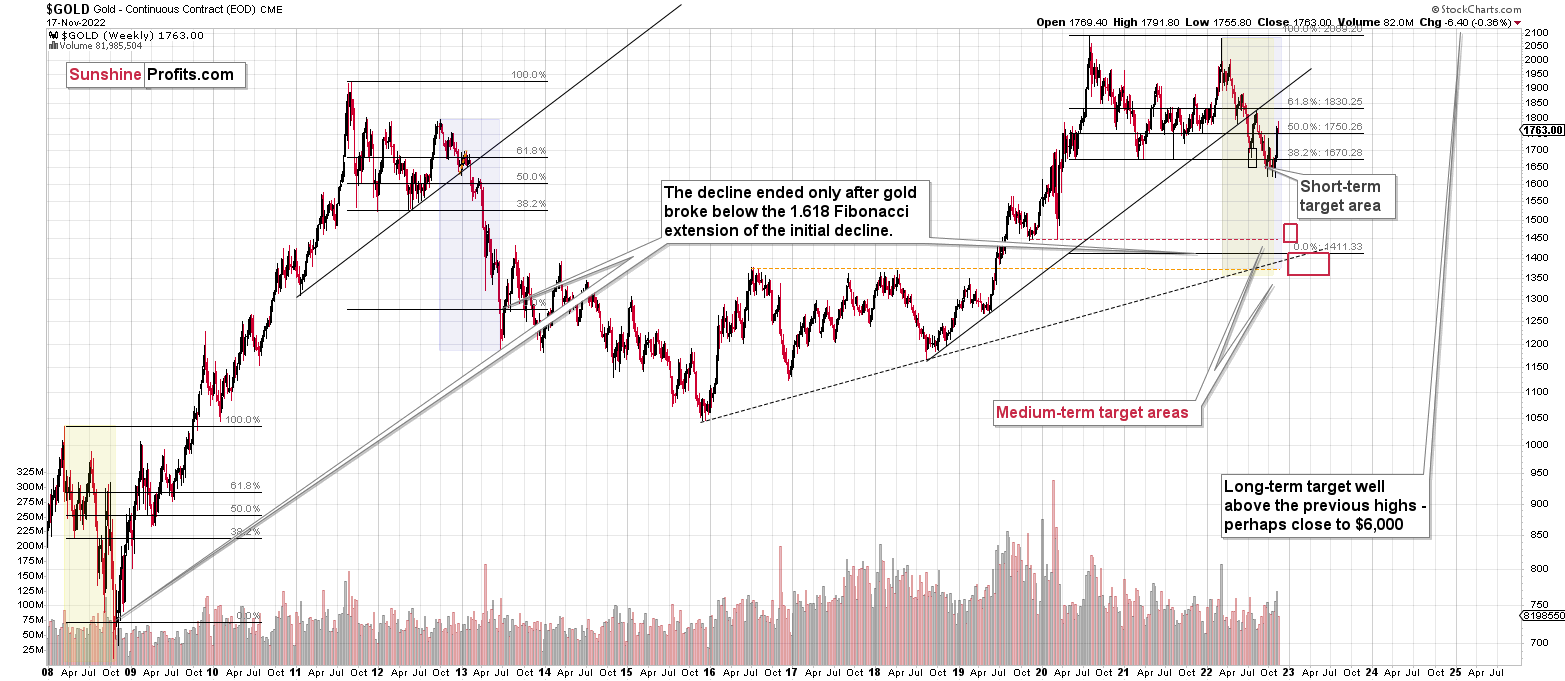
Please note that the above timing details are relatively broad and “for general overview only” – so that you know more or less what I think and how volatile I think the moves are likely to be – on an approximate basis. These time targets are not binding nor clear enough for me to think that they should be used for purchasing options, warrants, or similar instruments.
Summary
Summing up, while the precious metals sector moved higher last week, it seems that it’s just a part of a bigger – bearish – analogy to what we saw in 2008. I realize that volatile upswings generate a lot of emotions, but taking a calm, broad look at the markets shows that nothing really changed.
Last week’s shooting star candlestick in gold indicates that the rally is over.
I would like to take this opportunity to congratulate you on your patience with this trade (and I’m grateful for your understanding that not every corrective upswing can be “caught” in trading terms). Many investors and traders panic and get out of the market exactly at the wrong time, but your patience and self-discipline mean that you’re poised to make the most of what the market brings us this and next year.
Moving back to the market, it appears to be yet another time when the markets are incorrectly expecting the Fed to make a dovish U-turn, and based on this, the part of the 2008 decline where we saw the biggest corrective upswing materialized.
In my opinion, the current trading position is going to become profitable in the following weeks, and quite possibly in the following days. And while I can’t promise any kind of performance, I fully expect it to become very profitable before it’s over and to prolong our 2022 winning streak.
After the final sell-off (that takes gold to about $1,350-$1,500), I expect the precious metals to rally significantly. The final part of the decline might take as little as 1-5 weeks, so it's important to stay alert to any changes.
As always, we'll keep you – our subscribers – informed.
To summarize:
Trading capital (supplementary part of the portfolio; our opinion): Full speculative short positions (300% of the full position) in junior mining stocks are justified from the risk to reward point of view with the following binding exit profit-take price levels:
Mining stocks (price levels for the GDXJ ETF): binding profit-take exit price: $20.32; stop-loss: none (the volatility is too big to justify a stop-loss order in case of this particular trade)
Alternatively, if one seeks leverage, we’re providing the binding profit-take levels for the JDST (2x leveraged). The binding profit-take level for the JDST: $27.87; stop-loss for the JDST: none (the volatility is too big to justify a SL order in case of this particular trade).
For-your-information targets (our opinion; we continue to think that mining stocks are the preferred way of taking advantage of the upcoming price move, but if for whatever reason one wants / has to use silver or gold for this trade, we are providing the details anyway.):
Silver futures downside profit-take exit price: $12.32
SLV profit-take exit price: $11.32
ZSL profit-take exit price: $74.87
Gold futures downside profit-take exit price: $1,504
HGD.TO – alternative (Canadian) 2x inverse leveraged gold stocks ETF – the upside profit-take exit price: $18.47
HZD.TO – alternative (Canadian) 2x inverse leveraged silver ETF – the upside profit-take exit price: $46.87
Long-term capital (core part of the portfolio; our opinion): No positions (in other words: cash)
Insurance capital (core part of the portfolio; our opinion): Full position
Whether you’ve already subscribed or not, we encourage you to find out how to make the most of our alerts and read our replies to the most common alert-and-gold-trading-related-questions.
Please note that we describe the situation for the day that the alert is posted in the trading section. In other words, if we are writing about a speculative position, it means that it is up-to-date on the day it was posted. We are also featuring the initial target prices to decide whether keeping a position on a given day is in tune with your approach (some moves are too small for medium-term traders, and some might appear too big for day-traders).
Additionally, you might want to read why our stop-loss orders are usually relatively far from the current price.
Please note that a full position doesn't mean using all of the capital for a given trade. You will find details on our thoughts on gold portfolio structuring in the Key Insights section on our website.
As a reminder - "initial target price" means exactly that - an "initial" one. It's not a price level at which we suggest closing positions. If this becomes the case (as it did in the previous trade), we will refer to these levels as levels of exit orders (exactly as we've done previously). Stop-loss levels, however, are naturally not "initial", but something that, in our opinion, might be entered as an order.
Since it is impossible to synchronize target prices and stop-loss levels for all the ETFs and ETNs with the main markets that we provide these levels for (gold, silver and mining stocks - the GDX ETF), the stop-loss levels and target prices for other ETNs and ETF (among other: UGL, GLL, AGQ, ZSL, NUGT, DUST, JNUG, JDST) are provided as supplementary, and not as "final". This means that if a stop-loss or a target level is reached for any of the "additional instruments" (GLL for instance), but not for the "main instrument" (gold in this case), we will view positions in both gold and GLL as still open and the stop-loss for GLL would have to be moved lower. On the other hand, if gold moves to a stop-loss level but GLL doesn't, then we will view both positions (in gold and GLL) as closed. In other words, since it's not possible to be 100% certain that each related instrument moves to a given level when the underlying instrument does, we can't provide levels that would be binding. The levels that we do provide are our best estimate of the levels that will correspond to the levels in the underlying assets, but it will be the underlying assets that one will need to focus on regarding the signs pointing to closing a given position or keeping it open. We might adjust the levels in the "additional instruments" without adjusting the levels in the "main instruments", which will simply mean that we have improved our estimation of these levels, not that we changed our outlook on the markets. We are already working on a tool that would update these levels daily for the most popular ETFs, ETNs and individual mining stocks.
Our preferred ways to invest in and to trade gold along with the reasoning can be found in the how to buy gold section. Furthermore, our preferred ETFs and ETNs can be found in our Gold & Silver ETF Ranking.
As a reminder, Gold & Silver Trading Alerts are posted before or on each trading day (we usually post them before the opening bell, but we don't promise doing that each day). If there's anything urgent, we will send you an additional small alert before posting the main one.
Thank you.
Przemyslaw K. Radomski, CFA
Founder, Editor-in-chief

