

Briefly: in our opinion, full (300% of the regular position size) speculative short positions in junior mining stocks are justified from the risk/reward point of view at the moment of publishing this Alert.
All eyes on the USD Index! At least that’s where they should be if one wants to make sense of the recent price moves.
In last Tuesday’s analysis, I wrote the following about the USD Index:
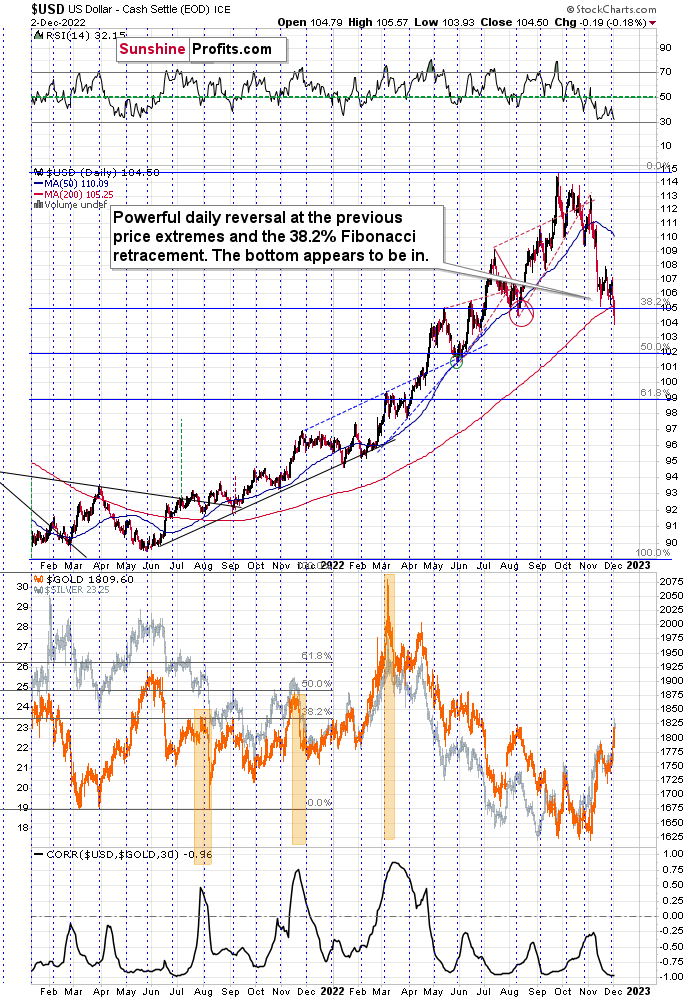
For example, the USD Index could decline to its strong support level at the 38.2% Fibonacci retracement and the August 2022 low as well as the May 2022 high. Such a move would likely imply the RSI at about 30, which would be a crystal-clear signal for many traders that the bottom is in.
To clarify, if that happened, the USD Index would be as oversold from a short-term point of view as it was at its 2021 bottom – when it was trading at about 90.
On Friday, I added:
The USD Index moved slightly below the above-mentioned levels, while the RSI remains just above 30. In other words, the situation is just like it was in mid-2021, with the exception that the prices appear to have moved ahead of themselves.
Now, the move below the support levels is not confirmed, and I doubt that it will be confirmed. An invalidation is a much more likely scenario. Unless we see the breakdown confirmed, nothing really changes.
The USD Index appears to be extremely oversold on irrational behavior, and neither is likely to last. Especially now that it's the turn of the month, when the USD Index tends to reverse. This means that the top in the precious metals market is also likely in or at hand.
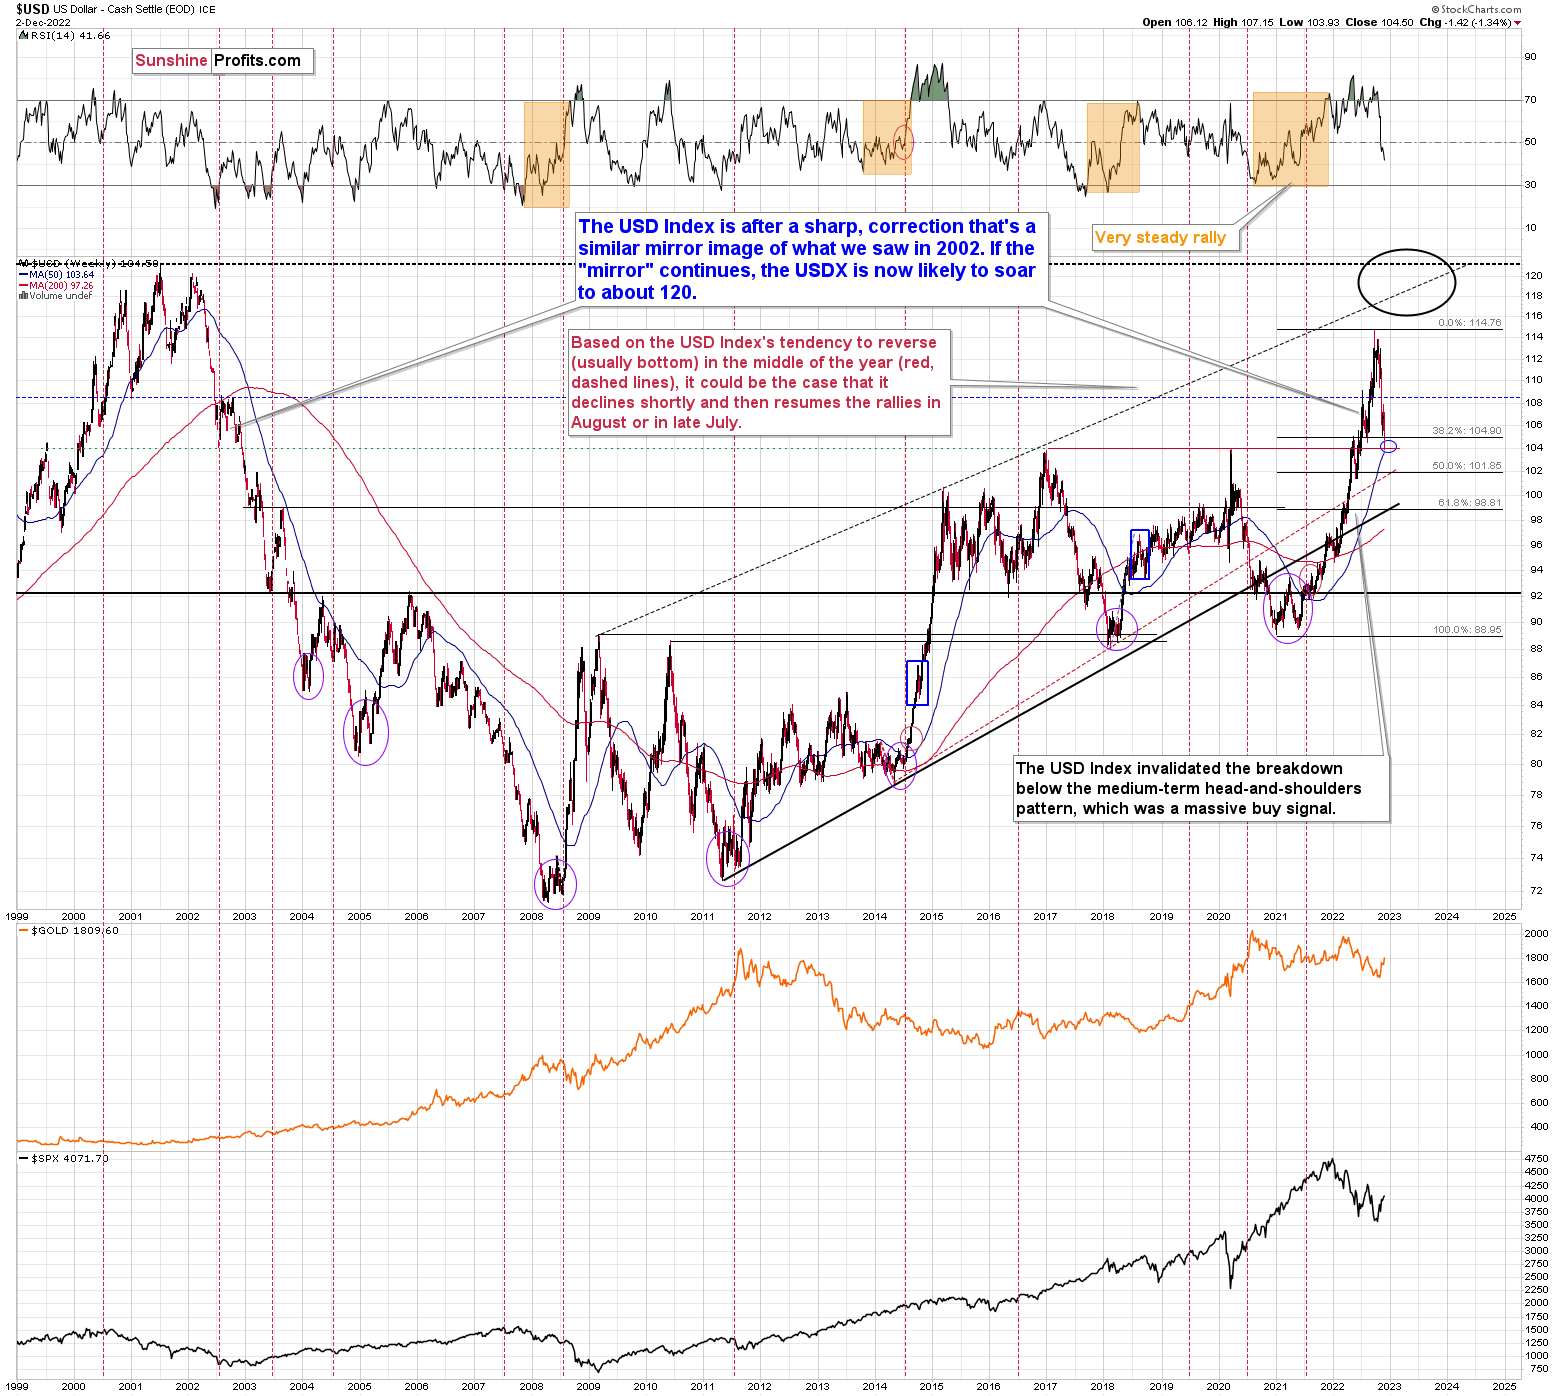
Moreover, please note that there is a yet another, even stronger, support on the above long-term chart.
The 2016 and 2020 tops (as well as the 2002 low and the 1999 top) currently serve as very strong support at about 104 level.
At the moment of writing these words, the USD Index futures’ pre-market low was 104.33 – extremely close to the above-mentioned support.
This might be the most important indication that the bottom in the USD Index is at hand, and the opposite is likely the case for stocks and the precious metals sector.
Friday’s intraday low was 103.93, which means that the above-mentioned very strong support level was reached.
The USDX futures are slightly down in today’s pre-market trading, but it could be the case that the rest of the world (where the exchanges were closed) is reacting to the recent events.
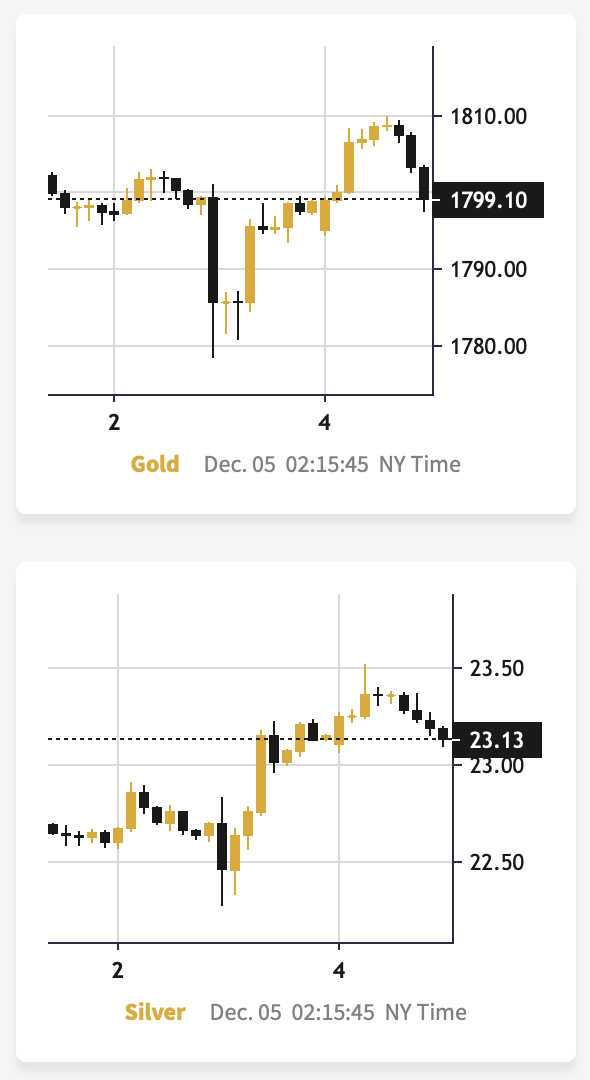
Interestingly, gold and silver moved higher initially, but then they quickly moved back down. In fact, at the moment of writing these words, gold is once again trading below $1,800, and the silver price is on its way to moving back below $23, too (chart courtesy of https://www.goldpriceforecast.com).
Anyway, as the 2016 and 2020 tops are reached, the bottoms are likely to be in. It could be the case that the USDX continues to trade around the 104 level for a couple of days before soaring, but a quicker rebound seems more likely to me.
Let’s not forget about the USD Index’s tendency to reverse at the turn of the month. We’re still very close to it, which means that this effect’s bullish implications remain intact.
Exactly the opposite is likely to be the case for the precious metals market.
As you can see on the above chart (when comparing its upper and lower parts), the decline in the USD Index corresponded to the rallies in gold and in the stock market.
And as you can see on the lower part of the first of today’s charts, the correlation between gold and the USD Index has been extremely negative recently.
Consequently, the odds are that the USD Index is about to rally, which is likely to push precious metals prices lower.
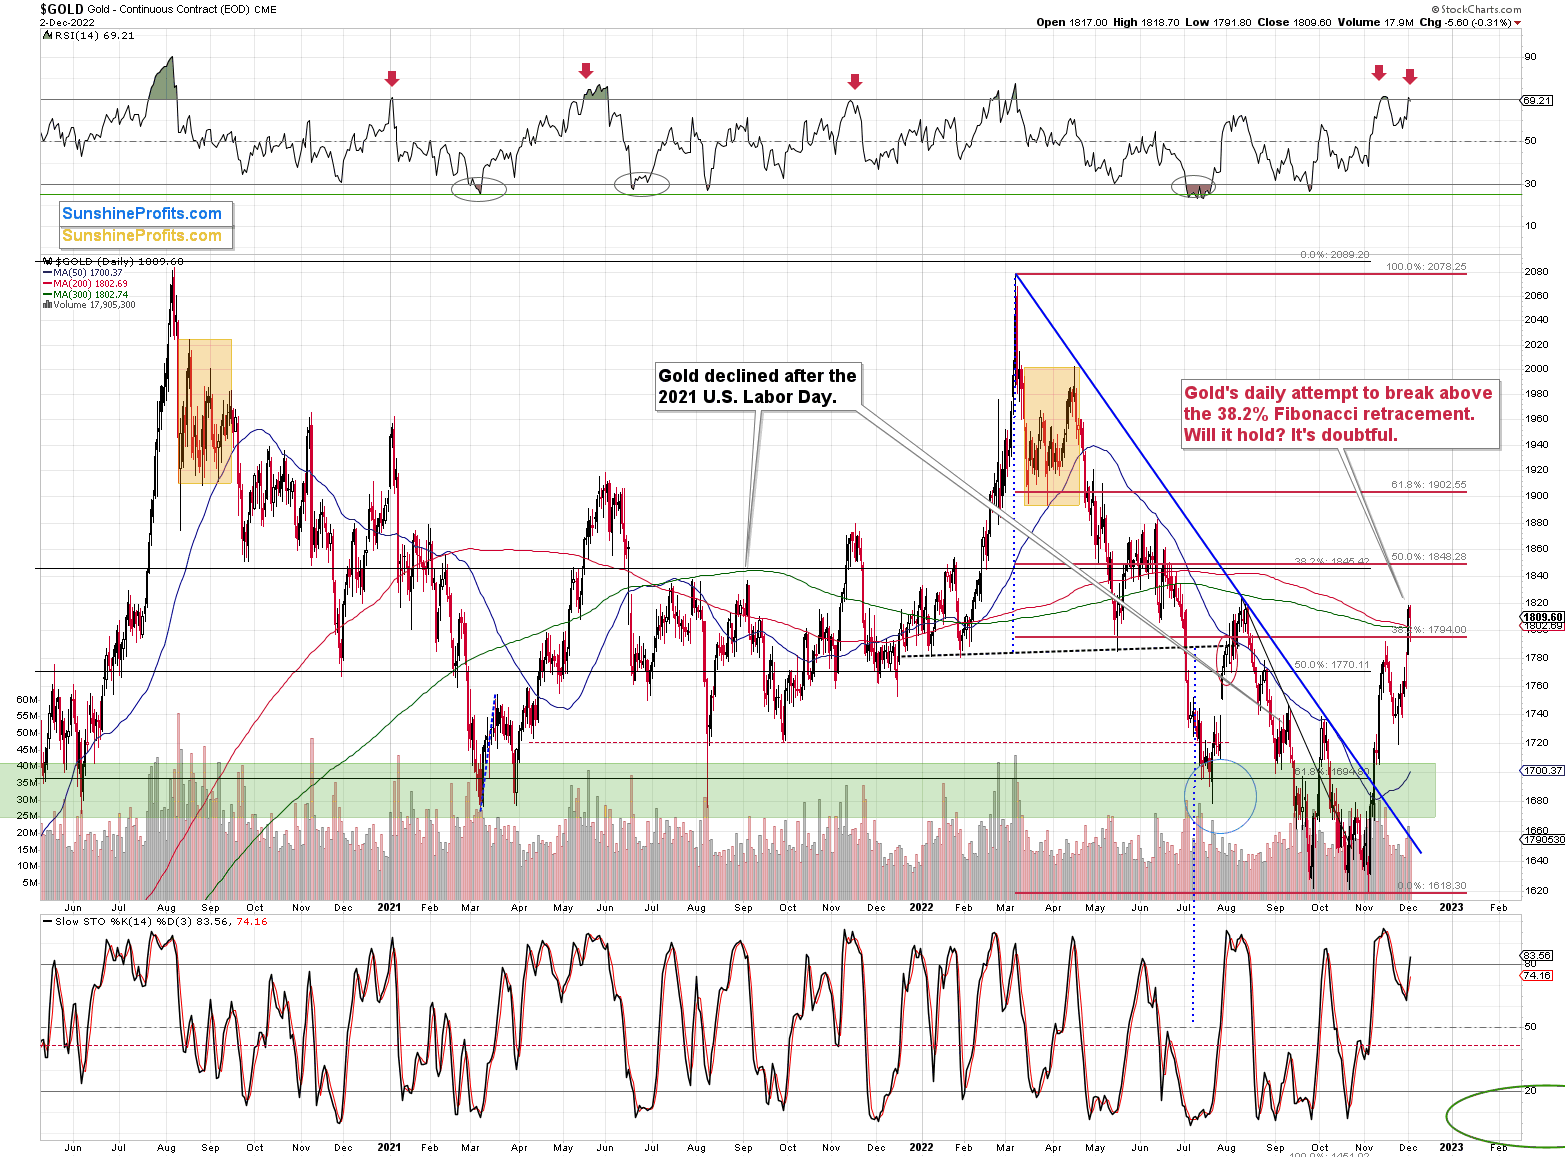
Meanwhile, the particularly interesting thing that happened on the gold market is that the RSI based on its price moved back below the 70 level, while gold itself formed the “hanging man” reversal candlestick.
This indicates that “enough is enough” and the gold market is now about to decline.
And a decline from here would imply an invalidation of the move above the 38.2% Fibonacci retracement, which by itself would be a sell signal. And that’s what I expect to see shortly.
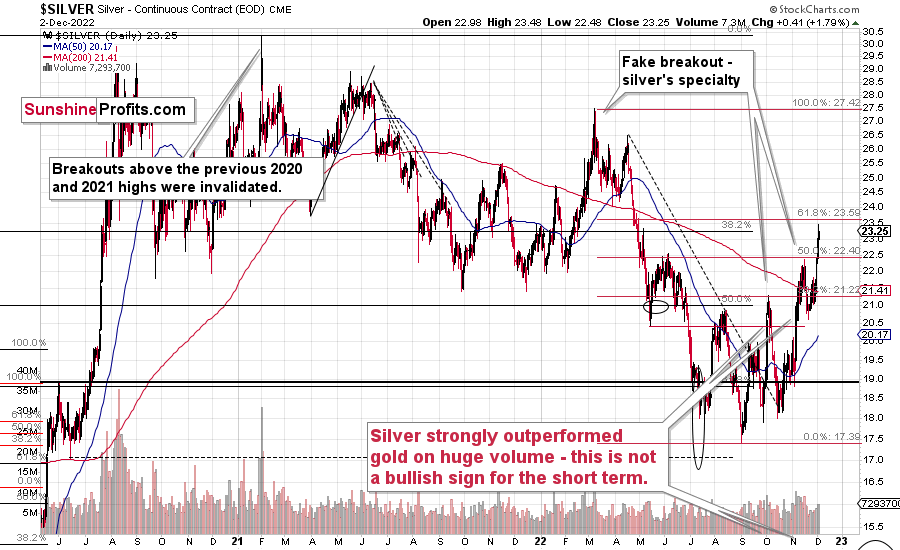
While gold is just a bit above its 38.2% Fibonacci retracement, silver has corrected almost 61.8% of the preceding decline. This means that it has recently outperformed gold.
I know I’ve been saying this several times recently, but it’s worth emphasizing once more. Silver’s very short-term outperformance of gold is generally a bearish indication, not a bullish one.
And so are silver’s breakouts, which often become “fakeouts.”
For example, silver just moved above its mid-2022 high – bullish right? Not necessarily.
Gold didn’t even manage to move above its August high, and miners are only slightly above that high.
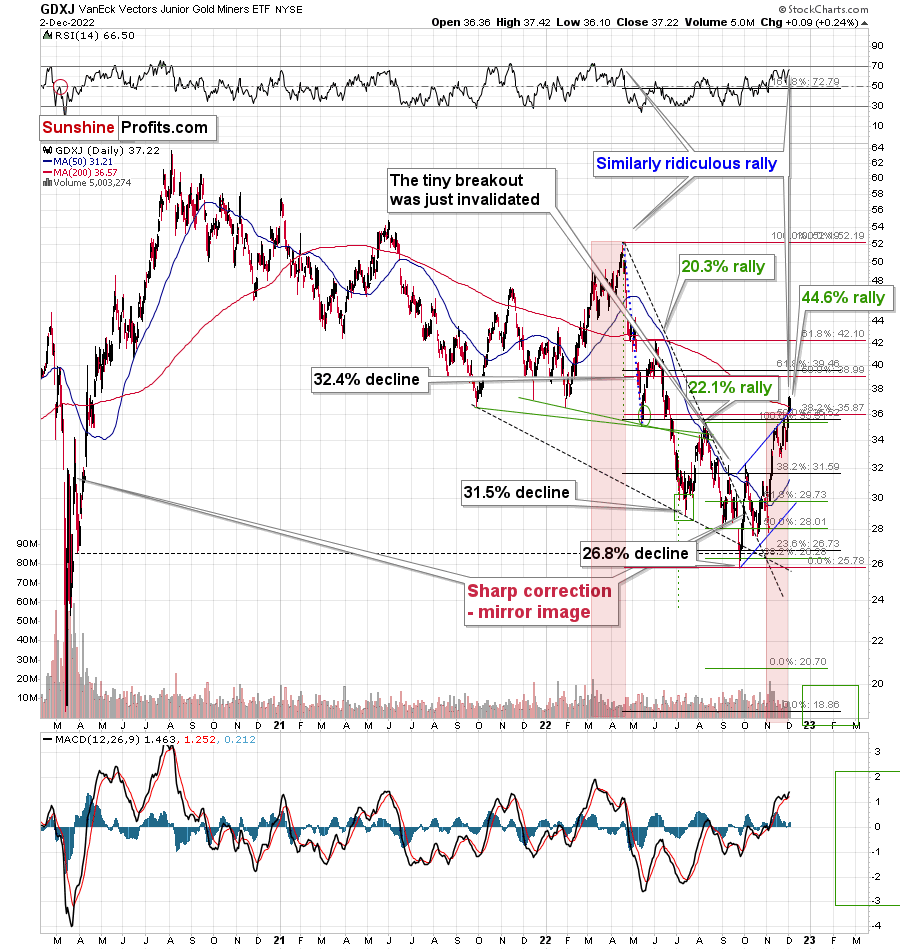
While the juniors’ rally seems significant on a day-to-day basis, comparing it to the size of the previous upswing, shows that they performed more or less like gold, while it was silver that actually outperformed.
And since the general stock market rallied recently, junior miners actually had a good reason to rally more than gold (on a relative basis) – and they didn’t.
Looking at the RSI, juniors are similarly overbought as gold is, and as the USD Index turns north, PMs and miners are likely to turn south.
Having said that, let’s take a look at the markets from a more fundamental point of view.
Jobs and Gold
With U.S. nonfarm payrolls outperforming economists’ consensus estimate on Dec. 2, the U.S. labor market continues to defy expectations. Moreover, with employment gains poised to uplift the FFR, the fundamentals remain bullish for real yields and the USD Index.
Please see below:
 Source: Investing.com
Furthermore, the labor force participation rate (LFPR) declined from 62.2% in October to 62.1% in November. As a result, more Americans left the workforce in November, and I’ve warned on numerous occasions that the development is highly inflationary.
To that point, with the LFPR declining for the third month in a row, the metric is far from its pre-pandemic peak.
Please see below:
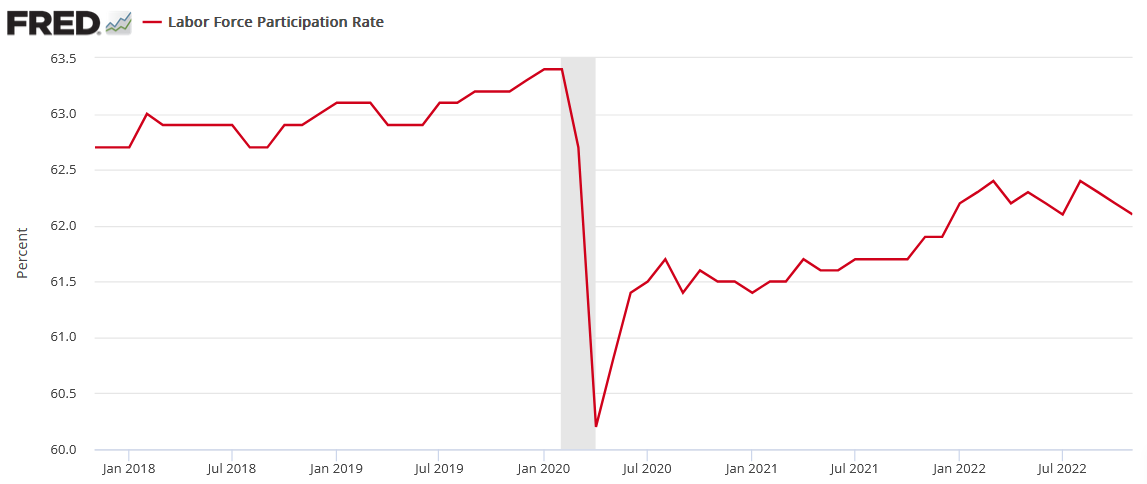
To explain, the red line above tracks the LFPR, and if you analyze the right side of the chart, you can see that comfortable cash cushions have enabled Americans to exit the workforce. So, the lack of normalization is bullish for wage inflation, and the consequences are still underestimated by market participants.
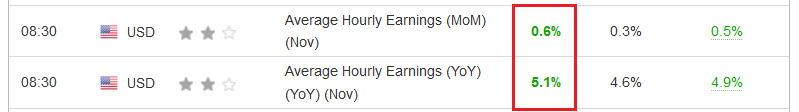
Therefore, with average hourly earnings (AHE) substantially outperforming expectations on Dec. 2, the fundamentals continue to unfold as expected.
Please see below:
 Source: Investing.com
To explain, AHE increased by 0.8% month-over-month (MoM) in November, which was more than double the consensus estimate of 0.3% MoM. Likewise, the 5.1% year-over-year (YoY) increase also surpassed the 4.6% YoY estimate.
As such, while the pivot crowd (led by ZeroHedge) has been wrong about growth and employment for many months, the most recent theory was that the U.S. labor market would collapse after the midterm elections. In a nutshell: the Democrats would have no reason to hide the poor results any longer.
Please see below:
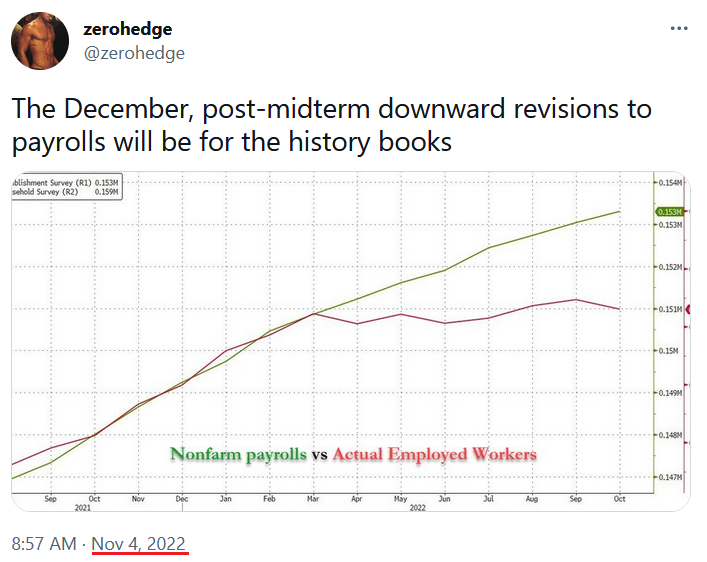
Yet, while the list of theories grows longer, the U.S. labor market continues to outperform, and investors are missing the forest through the trees.
Now, the price action on Dec. 2 suggested the exact opposite. For example, while the GDXJ ETF and the S&P 500 opened materially lower, they rallied intraday and closed near their highs. Conversely, the USD Index popped on the payrolls news, only to sell off as the risk rally ensued. Furthermore, the U.S. 10-Year real yield declined as the breakeven inflation rate rose and the nominal rate declined.
Consequently, while the fundamentals have been spot on and the thesis remains surgical, the price action has not followed suit. So, what gives?
Well, while historical mistakes should be enough to shake them, investors still have full faith in Fed Chairman Jerome Powell; and despite his many errors over the last ~ two years, when he preaches patience and signals a “slowdown” in rate hikes in December, investors (in the short term) care more about what he says than fundamental reality.
For example, please read this headline from Jul. 15, 2021:
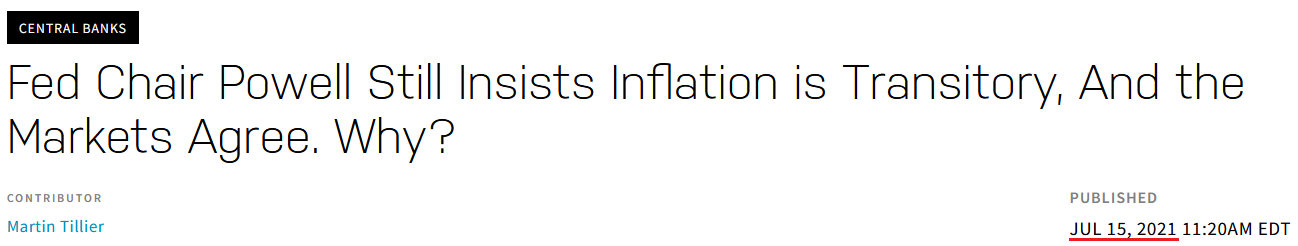 Source: NASDAQ.com
The article stated:
“The Fed controls short-term rates directly, and longer-term rates indirectly, but those longer-term rates are set by the market on a day-to-day basis. If traders believed that inflation was really taking hold and would force a rate hike before the Fed’s predictions of more than a year from now, the 10-Year Treasury yield would not have fallen from around 1.75% in March to its current 1.3%.
“Again, the money is saying, shouting even, that neither the 5.4% annualized CPI growth, nor the 4.5% jump in the Fed’s preferred ‘core inflation’ metric reported this week, will be sustained for long enough to force a reaction in rates.”
Thus, despite all of the “shouting” about transitory inflation in the summer of 2021, do you remember what I wrote on Jul. 15, 2021?
With Jerome Powell, Chairman of the U.S. Federal Reserve (Fed), telling Congress on Jul. 14 that the U.S. economy is “still a ways off,” investors rejoiced as the rhetoric implies that tapering is “still a ways off.” However, while Powell repeated his classic lines and maintained his classic stance, his short-term suppression of U.S. Treasury yields and the USD Index will likely result in even more violent upswings over the medium term….
Moreover, while taunting inflation may seem amusing in the short run, the Fed’s nonchalance will likely result in an even faster taper once the pressure mounts; and with gold’s largest 2021 daily loss more than 1.58x its largest daily gain, the precious metals will likely run for cover once the drama unfolds.
Likewise, we find ourselves in the same situation. With investors more focused on what Powell says than what’s actually happening, they willfully follow his lead even though he has been woefully wrong. So, while the fundamentals are highly bullish for the FFR, real yields and the USD Index, the crowd that bought the U.S. 10-Year Treasury yield at 1.3% in the summer of 2021 is the same crowd buying the PMs and selling the U.S. dollar now.
As a result, don’t be surprised if the same misguided narrative uplifting risks assets implodes in the months ahead.
What’s Silver’s Fate?
Though actions speak louder than words, investors have decided that the latter will guide their investment decisions in the short term. Therefore, with Fed officials signaling a “slowdown” in the pace of future rate hikes, market participants deem the shift as bullish.
However, with sentiment clouding their judgment, the bulls don’t realize that 50 basis point rate hikes are still profoundly hawkish. As such, while the silver price has rallied as the faith intensifies, the fundamentals are trending in the opposite direction.
Please see below:
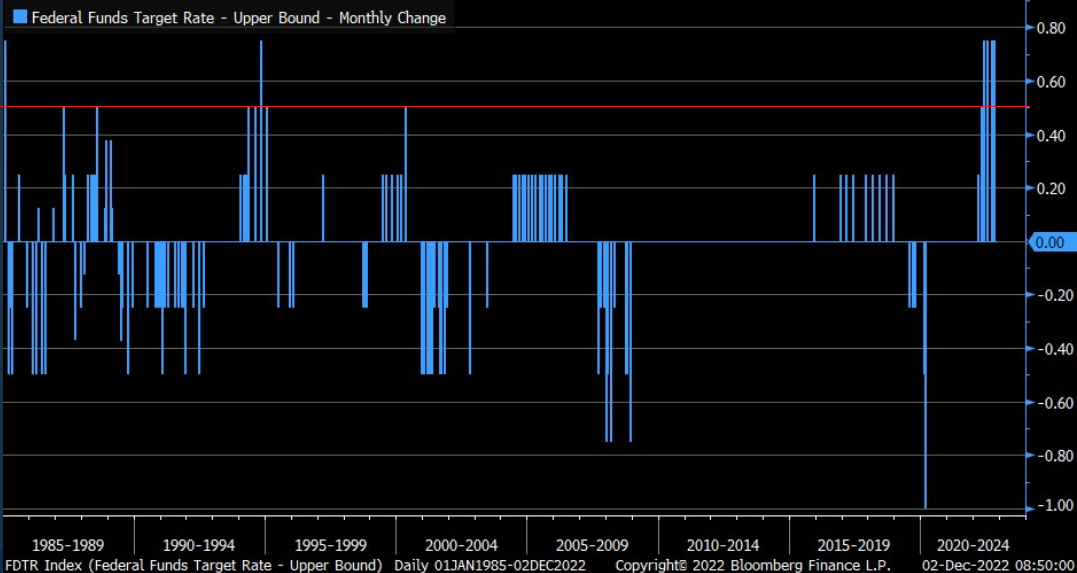
To explain, the blue bars above depict the monthly change in the FFR over the last ~40 years. If you analyze the horizontal red line near the top, you can see that 50 basis point rate hikes don’t happen all that often.
Consequently, while a deceleration from 75 basis points has given investors a false sense of security, the reality is that 50 basis points are far from dovish, and the sentiment uplifting the silver price contrasts the fundamental backdrop.
To that point, the S&P 500 has a material impact on silver and mining stocks, and not only are the latter two more correlated to the index than gold, but they’re also much more volatile. Thus, with the S&P 500 still highly overvalued, a sharp decline could spell trouble for the silver price.
Please see below:
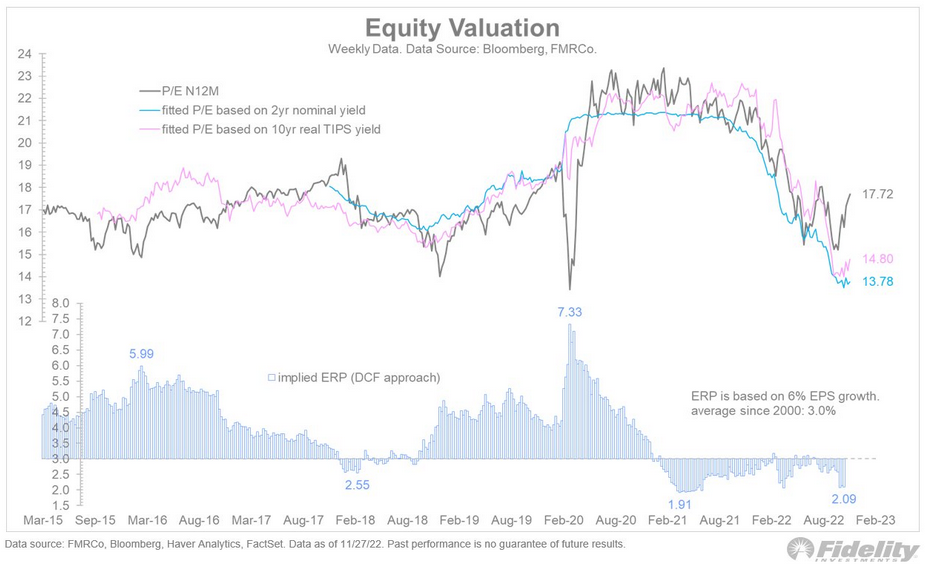
To explain, the black line above tracks the S&P 500’s 12-month forward price-to-earnings (P/E) ratio. If you analyze the right side of the chart, you can see that the metric is close to 18x.
But, the blue and pink lines above represent the S&P 500’s fair value forward P/Es given the current values of the U.S. 2-Year Treasury yield and the U.S. 10-Year real yield. In a nutshell: when less risky assets offer higher returns (interest rates), the S&P 500 should command a lower multiple, given its higher potential for capital losses.
So, with the U.S. 2-Year Treasury yield implying a forward P/E of ~14x and the U.S. 10-Year real yield implying a forward P/E of ~15x, investors are paying an inflated price for a suboptimal asset.
Furthermore, the P/E measures use analysts’ expected 12-month earnings, which have not been adjusted for a potential recession; and with every inflation fight since 1954 ending with a recession, the current P/E overvaluation and the potential for a sharp decline in 2023 S&P 500 earnings are profoundly bearish for the silver price.
On top of that, UBS’ risk model indicator signals a high probability of a 5% or more drop in the S&P 500 in the near term.
Please see below:
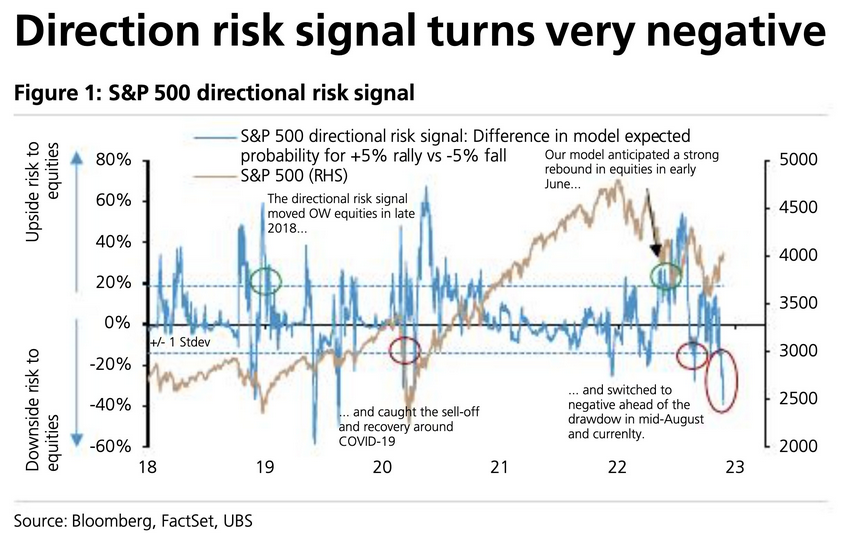
To explain, the red line above tracks the S&P 500, while the blue line above tracks UBS’ risk model indicator, and the blue horizontal dashed lines represent +1 and -1 standard deviations from the average.
If you analyze the right side of the chart, you can see that the blue line is near its 2022 lows, and prior readings of this magnitude have culminated with sharp drawdowns of the S&P 500. Therefore, while the index remains elevated right now, downside risk has intensified from a fundamental, technical and sentiment perspective.
Overall, the silver price has benefited from the same false narrative uplifting several risk assets. After being shocked by 75 basis point rate hikes in 2022, the crowd believes that a step down to 50 basis points is akin to a dovish pivot. However, for those that understand history, 50 basis points are still highly hawkish.
As such, the crowd is trying to create the perfect investment recipe with imperfect ingredients.
Awaiting a Reversal
While risk assets remain in rally mode, the optimism is unlikely to last. For example, Michael Hartnett, Bank of America’s Chief Investment Strategist, wrote on Dec. 2:
“Bears (like us) worry unemployment in 2023 will be as shocking to Main Street consumer sentiment as inflation in 2022. We’re selling risk rallies from here.”
So, while the crowd assumes that a soft landing is inevitable, history shows that high inflation and low unemployment often switch places before the cycle ends; and with the Fed still behind the inflation curve, the policy actions required to normalize the metric should inflict plenty of pain on the U.S. labor market and corporate profits. To explain, I wrote on Aug. 16:
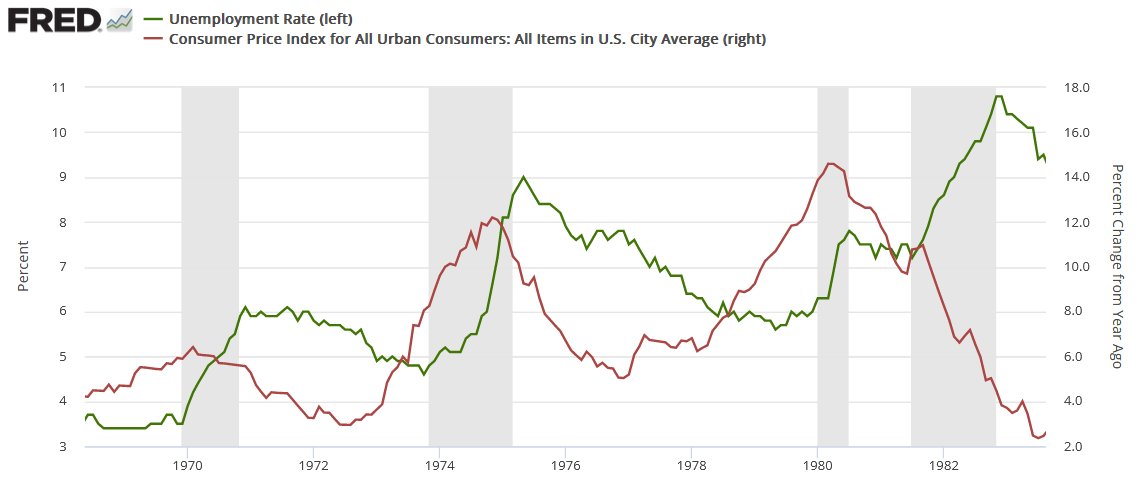
The red line above tracks the YoY percentage change in the headline CPI, while the green line above tracks the U.S. unemployment rate. As you can see, the 1970, 1974 and 1980 recessions culminated with high inflation and delayed spikes in unemployment.
Moreover, while the 1982 recession had a diverging relationship, Paul Volcker made it his mission to eradicate inflation at all costs. Therefore, he understood the severity of the problem and didn’t want a repeat of the outcomes from 1970, 1974 and 1980.
Furthermore, notice how the U.S. unemployment rate always bottoms before a recession? Remember, bear markets don’t end with the U.S. unemployment rate at a ~50-year low; they begin with the metric at a ~50-year low.
To that point, while the crowd foolishly focuses on the pace rather than the peak, Chicago Fed President Charles Evans said on Dec. 2 that a higher terminal FFR is on the horizon.
Please see below:
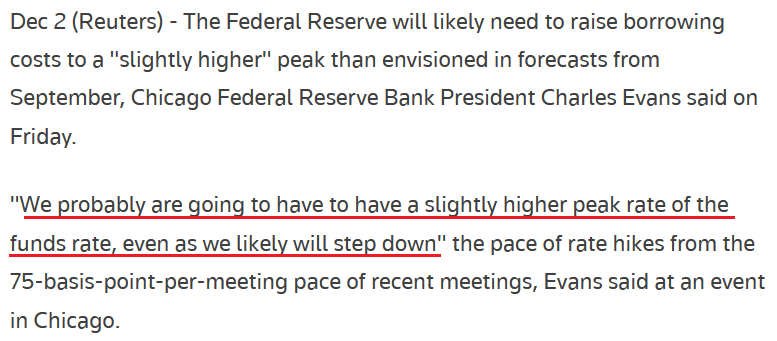 Source: Reuters
Thus, while sentiment proclaims that all is well on Wall Street, the reality is that fundamental risk is rampant. In addition, please remember that the algorithms intensify the short-term price action, and they don’t care about the fundamentals. However, while their behavior inflates prices on the upside, it also enhances the selling pressure on the downside. As such, when sentiment shifts, it could be a long way down before gold, silver, mining stocks and the S&P 500 find their final bottoms.
The Bottom Line
With the USD Index and the U.S. 10-Year real yield continuing their declines, the struggles have increased the PMs’ attractiveness. But, with sentiment and the medium-term fundamentals continuing to diverge, 2021 and 2022 showed that the latter emerges victorious.
Also, while investors will cite decelerating inflation and a more cautious Fed as reasons to be bullish, that same optimism loosens financial conditions, spurs more inflation and eventually requires more hawkish policy from the Fed. Therefore, the false narrative uplifting the PMs is highly uninformed, and prior iterations have ended badly for the believers.
In conclusion, the PMs were mixed on Dec. 2, as the payrolls print created confusion on Wall Street. Yet, with the dip buyers running to the rescue intraday, their behavior highlights how optimistic sentiment reigns right now. However, sentiment can only uplift risk assets for so long, and as the fundamentals continue to deteriorate, it likely won’t be long before the optimism turns to pessimism.
Overview of the Upcoming Part of the Decline
- It seems to me that the corrective upswing is over (or about to be over) and that the next big move lower is already underway (or that it’s about to start).
- If we see a situation where miners slide in a meaningful and volatile way while silver doesn’t (it just declines moderately), I plan to – once again – switch from short positions in miners to short positions in silver. At this time, it’s too early to say at what price levels this could take place and if we get this kind of opportunity at all – perhaps with gold prices close to $1,500 - $1,550.
- I plan to switch from the short positions in junior mining stocks or silver (whichever I’ll have at that moment) to long positions in junior mining stocks when gold / mining stocks move to their 2020 lows (approximately). While I’m probably not going to write about it at this stage yet, this is when some investors might consider getting back in with their long-term investing capital (or perhaps 1/3 or 1/2 thereof).
- I plan to return to short positions in junior mining stocks after a rebound – and the rebound could take gold from about $1,450 to about $1,550, and it could take the GDXJ from about $20 to about $24. In other words, I’m currently planning to go long when GDXJ is close to $20 (which might take place when gold is close to $1,450), and I’m planning to exit this long position and re-enter the short position once we see a corrective rally to $24 in the GDXJ (which might take place when gold is close to $1,550).
- I plan to exit all remaining short positions once gold shows substantial strength relative to the USD Index while the latter is still rallying. This may be the case with gold prices close to $1,400 and GDXJ close to $15 . This moment (when gold performs very strongly against the rallying USD and miners are strong relative to gold after its substantial decline) is likely to be the best entry point for long-term investments, in my view. This can also happen with gold close to $1,400, but at the moment it’s too early to say with certainty.
- The above is based on the information available today, and it might change in the following days/weeks.
You will find my general overview of the outlook for gold on the chart below:
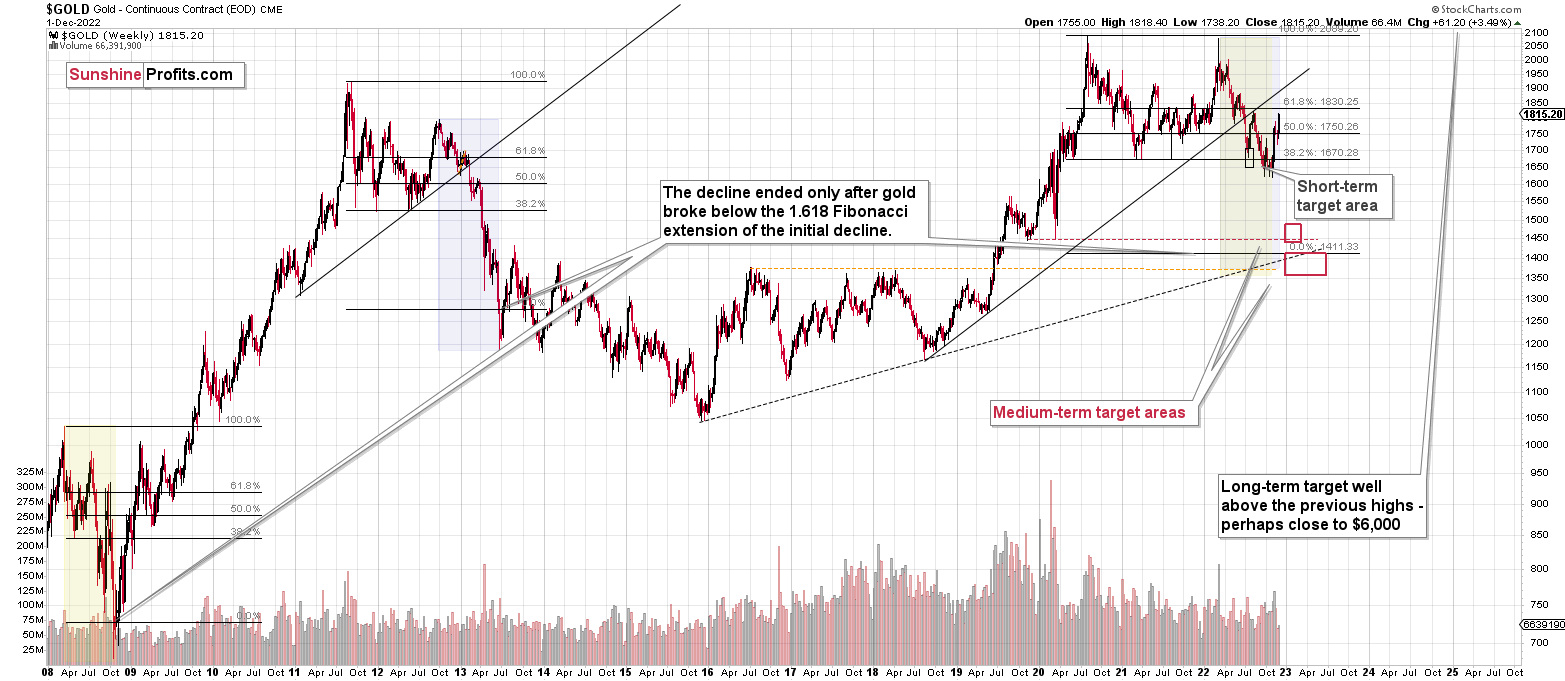
Please note that the above timing details are relatively broad and “for general overview only” – so that you know more or less what I think and how volatile I think the moves are likely to be – on an approximate basis. These time targets are not binding nor clear enough for me to think that they should be used for purchasing options, warrants, or similar instruments.
Letters to the Editor
Q: Thanks,
Is it possible to keep the old site rolling into January? The main reason is that my, and likely others’, investment decisions around JDST have crushed me, and I just have to hold on and keep my fingers crossed. Diving into the new site with all the comments about PR missing the spike just adds salt to the wound. I agree with PR's strategy, and I used the JDST instrument, which created additional risk, and now I have to completely stop looking at the markets and capture info just via PR.
It is also important for us to get emails on the trading alerts, as I don't have the capacity to go look for them every day due to work. The email alerts are really good and can be managed with a quick look on the phone.
Thanks for consideration.
A: There are two points in the above message, and I’ll start with the latter.
There are more notification options on Golden Meadow than just the e-mail alerts that we’ve been using at Sunshine Profits – not fewer of them.
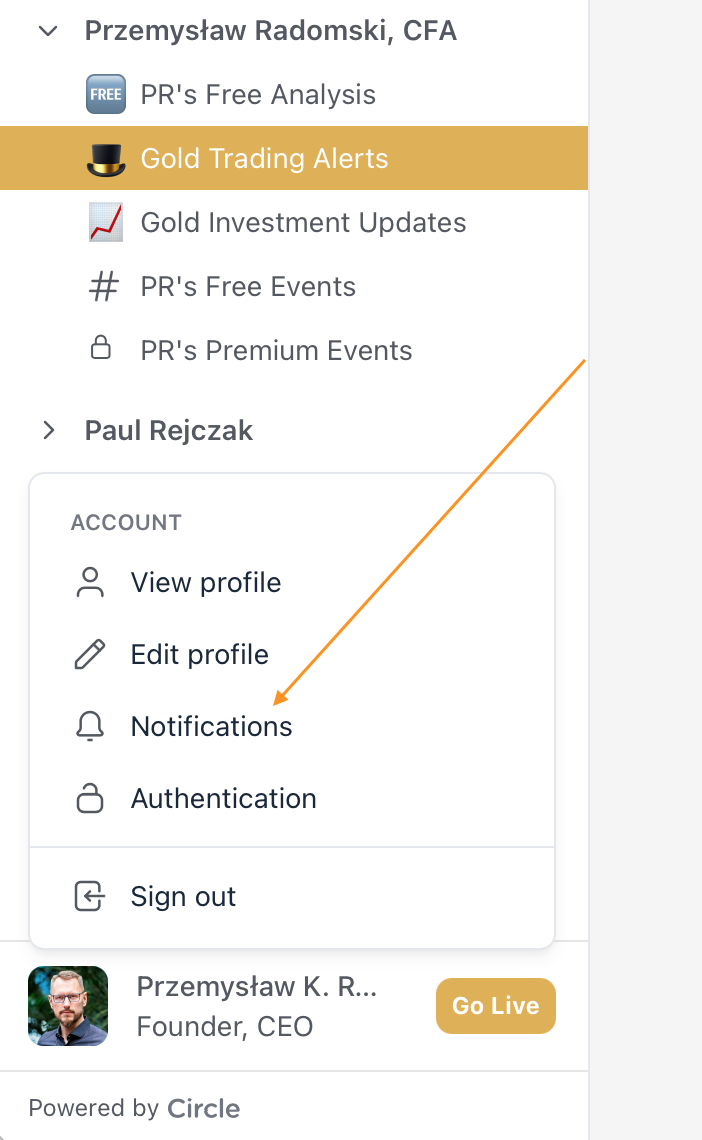
If you click on your picture/icon in the bottom left corner of the page, you’ll see a menu. You can then select “notifications.”
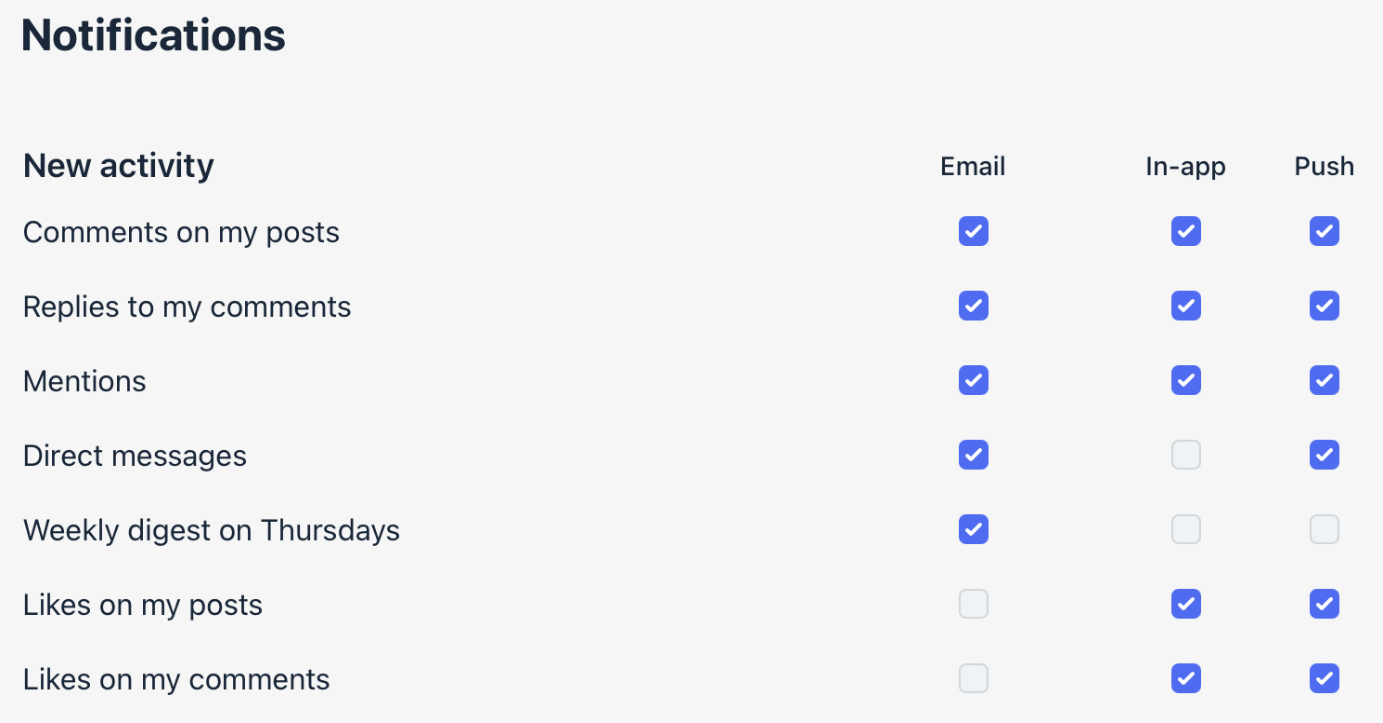
And from within the Notifications page, go to the row that says “PR’s Gold Trading Alerts” and select what you’d like to get.


A new analysis is a “post.”
Additionally, you can download an iOS app (called “Circle”) and log in to your account (using the same details/password as on Golden Meadow). Then you can get notifications from this app as well.
You can configure it as you wish.
Moreover, on the “Notifications page” of the website, you can also customize notifications per action within the community.
This is an upgrade over the previous - e-mail only - system.
Now, moving on to the first, and key issue, what is “appropriate” and what’s not in the comment section?
I already wrote about it in the Pillars of the Community. However, right after the launch of the new platform, there was little time to read those guidelines, so I didn’t remove most messages that were not in line with them. In fact, I removed only one, and then I reached out to the author in private, replying to the comment.
The above question/request and its explanation serve as a perfect confirmation as to why those guidelines are in place and why they will be applied.
It’s difficult enough to keep one’s mind calm when the market moves against the position that one holds, but it takes this difficulty to another level when one sees that others are not staying calm. Calm is contagious, but so is panic.
These are exactly the mechanisms that make people panic and sell close to tops and buy near bottoms when the sentiment is most bearish. In this case, it could be the case that someone exits a given position just before it starts heading in a favorable direction.
Golden Meadow is a platform with many features, but the one that I want to be its core is the way in which we interact – the culture of the community. I want it to be more supportive than other places that you have on the Internet. Social media and various forums are filled with toxicity (and ads). And I think that it’s possible to have a community without both. I also think that it’s possible to have a place where people exchange comments, thoughts, and ideas about the markets but that’s also friendly for authors – which means that they will actually want to participate in the discussions.
Actually, based on the above question/request it turns out that what’s friendly for authors is also friendly for subscribers.
What is it that makes a place friendly for authors? It’s that their previous performance is not discussed unless it’s a simple thank you or something positive in general. In other words, no comments that would include any version of the word “lose,” “losses,” or “lost” and similar. This is what spreads the panic in the most “efficient” way possible. I wrote an entire Pillar of the Community about it, entitled “Don’t spread the panic. Spread compassion.” Please read it, apply it, and help others apply it – in the end, everyone will benefit.
Also, I’m rather resistant to the impact of the comments of others, but other authors might not be. What sense does it make to stress the author even more with negative comments, thus impairing their performance? That’s the opposite of what’s beneficial, right?
So wait, is this censorship? Where’s my freedom of speech?!
Freedom of speech is a nice concept, but it doesn’t work in practice. There’s an entire Pillar of the Community dedicated to this matter.
Besides, it’s not a matter of not voicing your concerns or questions at all. It’s a matter of choosing the right place to do so.
That should not be done below the articles. If your concern is about a size of the position, feel free to enter into a discussion in a space that’s dedicated to that.
Moreover, let’s keep in mind that you can reach out to a given author in a private message (technically, the authors can block private message functionality, but I have mine enabled, and I’ll recommend this to other authors too). That’s where you could voice your concerns without risking that “the panic would spread.” Personally, I’m not sure for how long I’ll be able to reply to each message that I’m getting in comments and in private messages, but I assure you that I’ll read them, and they will impact what I’m going to write in the following analyses/videos.
Please note that while something might seem “normal” or “regular” to you, that doesn’t mean that it won’t be “hardcore” and “panic-triggering” for someone, who’s more sensitive than you. There are many people on the platform already, and there will be many, many, many more in the future.
My request to everyone is not only to adhere to the above-linked guidelines but to actively help keep the community friendly. It might be as simple as clicking on the three dots on the right side of a given comment and then clicking “report comment.”

Our team will know to take a closer look and hide a given comment. We would then reach out to the person who made the comment in private and explain what can be done next time to make the community a better place, for everyone’s benefit.
Please note that we are against the cancel culture. We want everyone to grow themselves and their capital over here, and we think that deep down everyone is good. Consequently, by flagging someone’s comment, you are actually helping them help others in the future – to your own and others’ benefit.
Finally, it’s a tough call to say how long we’ll keep publishing the premium articles on the old website. Most likely, everything will work seamlessly on Golden Meadow at least a week later. For now, we ran into some technical problems on Friday, and we’re already working on them.
However, it would be much more beneficial for everyone if we all moved to Golden Meadow ASAP and created a better culture of interactions instead of trying to avoid them altogether.
Please help us make this Meadow Golden :)
=====
Please note that this section is going to go away within the next 1-8 weeks, as you can add comments/questions below the article on Golden Meadow – the platform that we’re using to provide our analyses. Your notification e-mails include an invitation link that allows you to access the “Gold Trading Alerts” space.
The first premium analysis had over 30 comments below it, and once I finish writing this article, I’ll head over to the comments section and catch up on yesterday’s comments.
Also, if you haven’t had the chance to see the video, in which I’m talking about the new platform and why we essentially moved from Sunshine Profits to Golden Meadow, I strongly encourage you to do so:
Summary
Summing up, while the precious metals sector moved higher this week, it seems that it’s just a part of a bigger – bearish – analogy to what we saw in 2008. I realize that volatile upswings generate a lot of emotions, but taking a calm, broad look at the markets shows that nothing really changed.
The situation on the USD index, in particular, suggests that the bottom is already in or nearing, and the opposite is likely for the precious metals market.
In fact, I would like to take this opportunity to congratulate you on your patience with this trade (and I’m grateful for your understanding that not every corrective upswing can be “caught” in trading terms). Many investors and traders panic and get out of the market exactly at the wrong time, but your patience and self-discipline mean that you’re poised to make the most of what the market brings us this and next year.
Moving back to the market, it appears to be yet another time when the markets are incorrectly expecting the Fed to make a dovish U-turn, and based on this, the part of the 2008 decline where we saw the biggest corrective upswing materialized.
In my opinion, the current trading position is going to become profitable in the following weeks, and quite possibly in the following days. And while I can’t promise any kind of performance, I fully expect it to become very profitable before it’s over and to prolong our 2022 winning streak.
After the final sell-off (that takes gold to about $1,350-$1,500), I expect the precious metals to rally significantly. The final part of the decline might take as little as 1-5 weeks, so it's important to stay alert to any changes.
As always, we'll keep you – our subscribers – informed.
To summarize:
Trading capital (supplementary part of the portfolio; our opinion): Full speculative short positions (300% of the full position) in junior mining stocks are justified from the risk to reward point of view with the following binding exit profit-take price levels:
Mining stocks (price levels for the GDXJ ETF): binding profit-take exit price: $20.32; stop-loss: none (the volatility is too big to justify a stop-loss order in case of this particular trade)
Alternatively, if one seeks leverage, we’re providing the binding profit-take levels for the JDST (2x leveraged). The binding profit-take level for the JDST: $27.87; stop-loss for the JDST: none (the volatility is too big to justify a SL order in case of this particular trade).
For-your-information targets (our opinion; we continue to think that mining stocks are the preferred way of taking advantage of the upcoming price move, but if for whatever reason one wants / has to use silver or gold for this trade, we are providing the details anyway.):
Silver futures downside profit-take exit price: $12.32
SLV profit-take exit price: $11.32
ZSL profit-take exit price: $74.87
Gold futures downside profit-take exit price: $1,504
HGD.TO – alternative (Canadian) 2x inverse leveraged gold stocks ETF – the upside profit-take exit price: $18.47
HZD.TO – alternative (Canadian) 2x inverse leveraged silver ETF – the upside profit-take exit price: $46.87
Long-term capital (core part of the portfolio; our opinion): No positions (in other words: cash)
Insurance capital (core part of the portfolio; our opinion): Full position
Whether you’ve already subscribed or not, we encourage you to find out how to make the most of our alerts and read our replies to the most common alert-and-gold-trading-related-questions.
Please note that we describe the situation for the day that the alert is posted in the trading section. In other words, if we are writing about a speculative position, it means that it is up-to-date on the day it was posted. We are also featuring the initial target prices to decide whether keeping a position on a given day is in tune with your approach (some moves are too small for medium-term traders, and some might appear too big for day-traders).
Additionally, you might want to read why our stop-loss orders are usually relatively far from the current price.
Please note that a full position doesn't mean using all of the capital for a given trade. You will find details on our thoughts on gold portfolio structuring in the Key Insights section on our website.
As a reminder - "initial target price" means exactly that - an "initial" one. It's not a price level at which we suggest closing positions. If this becomes the case (as it did in the previous trade), we will refer to these levels as levels of exit orders (exactly as we've done previously). Stop-loss levels, however, are naturally not "initial", but something that, in our opinion, might be entered as an order.
Since it is impossible to synchronize target prices and stop-loss levels for all the ETFs and ETNs with the main markets that we provide these levels for (gold, silver and mining stocks - the GDX ETF), the stop-loss levels and target prices for other ETNs and ETF (among other: UGL, GLL, AGQ, ZSL, NUGT, DUST, JNUG, JDST) are provided as supplementary, and not as "final". This means that if a stop-loss or a target level is reached for any of the "additional instruments" (GLL for instance), but not for the "main instrument" (gold in this case), we will view positions in both gold and GLL as still open and the stop-loss for GLL would have to be moved lower. On the other hand, if gold moves to a stop-loss level but GLL doesn't, then we will view both positions (in gold and GLL) as closed. In other words, since it's not possible to be 100% certain that each related instrument moves to a given level when the underlying instrument does, we can't provide levels that would be binding. The levels that we do provide are our best estimate of the levels that will correspond to the levels in the underlying assets, but it will be the underlying assets that one will need to focus on regarding the signs pointing to closing a given position or keeping it open. We might adjust the levels in the "additional instruments" without adjusting the levels in the "main instruments", which will simply mean that we have improved our estimation of these levels, not that we changed our outlook on the markets. We are already working on a tool that would update these levels daily for the most popular ETFs, ETNs and individual mining stocks.
Our preferred ways to invest in and to trade gold along with the reasoning can be found in the how to buy gold section. Furthermore, our preferred ETFs and ETNs can be found in our Gold & Silver ETF Ranking.
As a reminder, Gold & Silver Trading Alerts are posted before or on each trading day (we usually post them before the opening bell, but we don't promise doing that each day). If there's anything urgent, we will send you an additional small alert before posting the main one.
Thank you.
Przemyslaw K. Radomski, CFAFounder, Editor-in-chief

