

Briefly: in our opinion, full (300% of the regular position size) speculative short positions in mining stocks are justified from the risk/reward point of view at the moment of publishing this Alert.
Gold moved higher as the USD Index moved lower in today’s pre-market trading. Before providing you with my thoughts on why that happened and what the implications are, let’s see exactly what transpired.
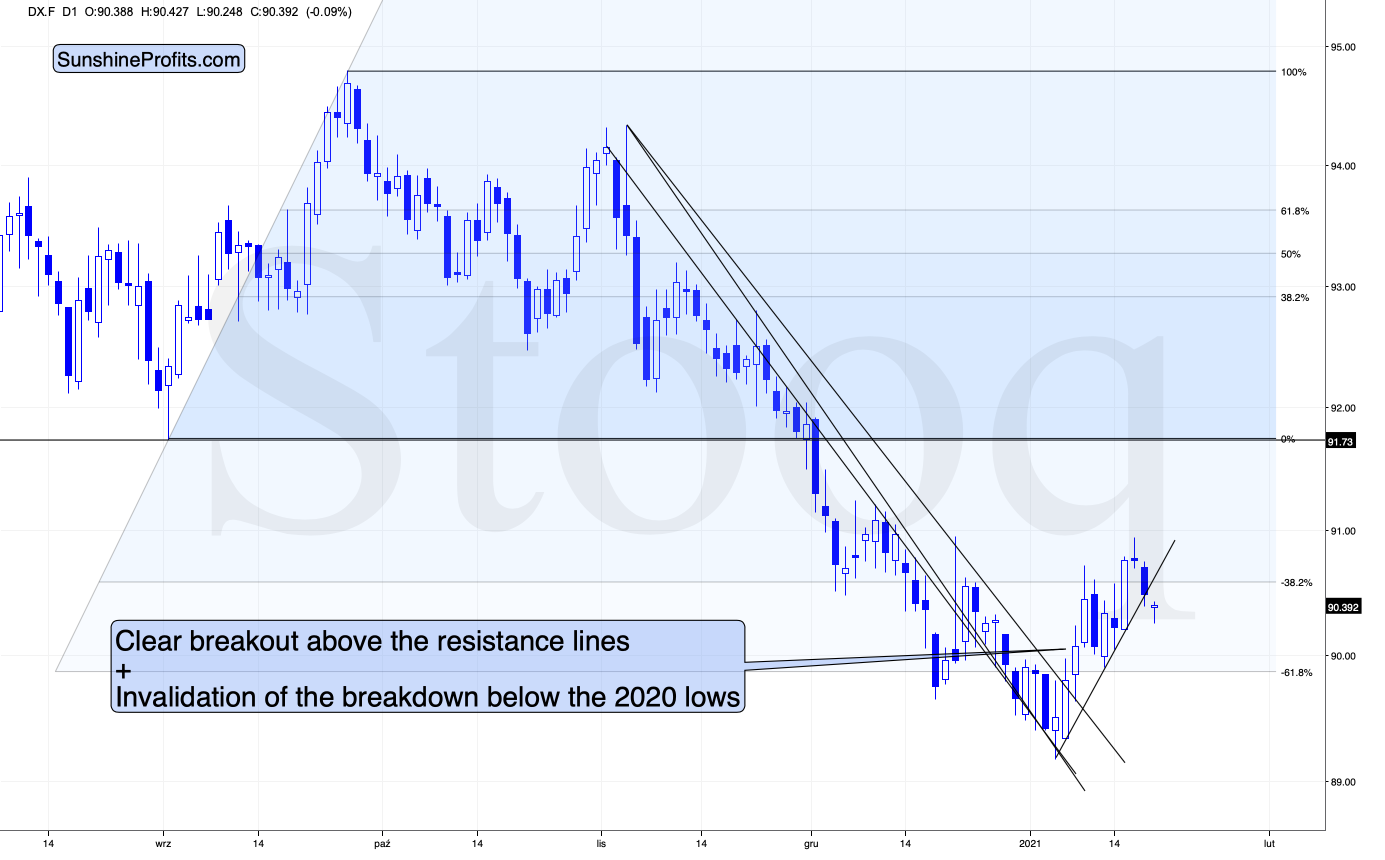
Figure 1 - USD Index
In yesterday’s (Jan. 19) analysis, I commented on the above USD Index chart in the following way:
The USD Index is after a major breakout above the declining resistance lines and this breakout was confirmed. Consequently, the USD Index is likely to rally, but is it likely to rally shortly? The answer to this question is being clarified at the moment of writing these words, because the USD Index moved back to its rising short-term support line that’s based on the 2021 bottoms.
If the USD Index breaks below it, traders will view the 2021 rally as a zigzag corrective pattern and will probably sell the U.S. currency, causing it to decline, perhaps to the mid-January low or even triggering a re-test of the 2021 low.
If the USD Index performs well at this time and rallies back up after touching the support line, and then moves to new yearly highs, it will be then that traders realize that it was definitely not just a zigzag correction, but actually the major bottom. In the previous scenario, they would also realize that, but later, after an additional short-term decline.
The weak performance of mining stocks that we saw last week, and relatively strong performance of silver (up by 1.24%) compared to gold (up by 0.34%) in today’s pre-market trading suggest that PMs are very ready to slide right now. This – as markets are interconnected – might make the strength in the USD Index more likely than not. In this case, the second above-mentioned scenario would be realized, and the price moves that I’ve been describing for some time now, would gain momentum quickly.
In either case, it seems that the outlook for the precious metals market remains bearish for the short and medium-term. It is only the immediate and very short term that have any notable differences. Therefore, it seems to make sense to keep the short positions in the mining stocks intact.
The USD Index moved lower, and at the moment of writing these words, its trading slightly below the rising support line. Is the more bearish (on a temporary basis) forecast for the USDX and more bullish forecast for gold being realized?
Let’s take a look at gold.
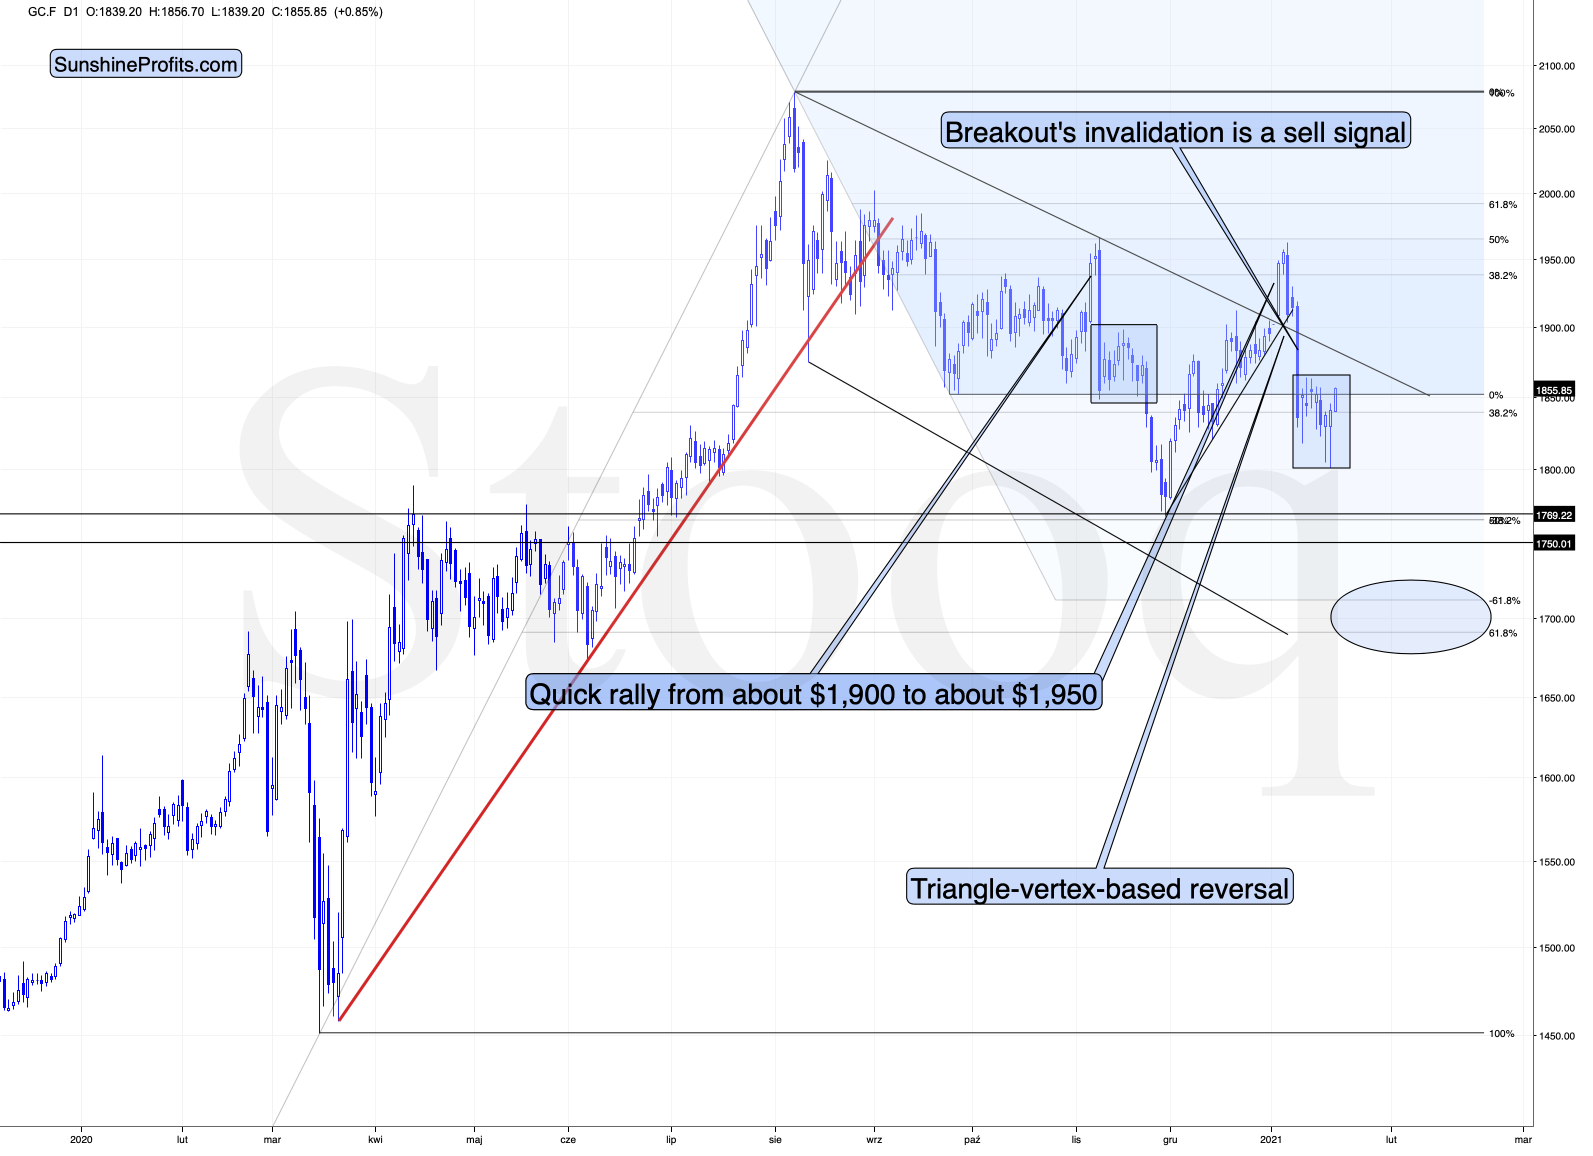
Figure 2 - COMEX Gold Futures
Gold is rallying today, but overall, it remains in a back-and-forth consolidation pattern, which continues to be similar to what we saw in November after a very similar (yet smaller) sharp decline.
Gold moved slightly above its September low in intraday terms, but not in terms of the closing prices.
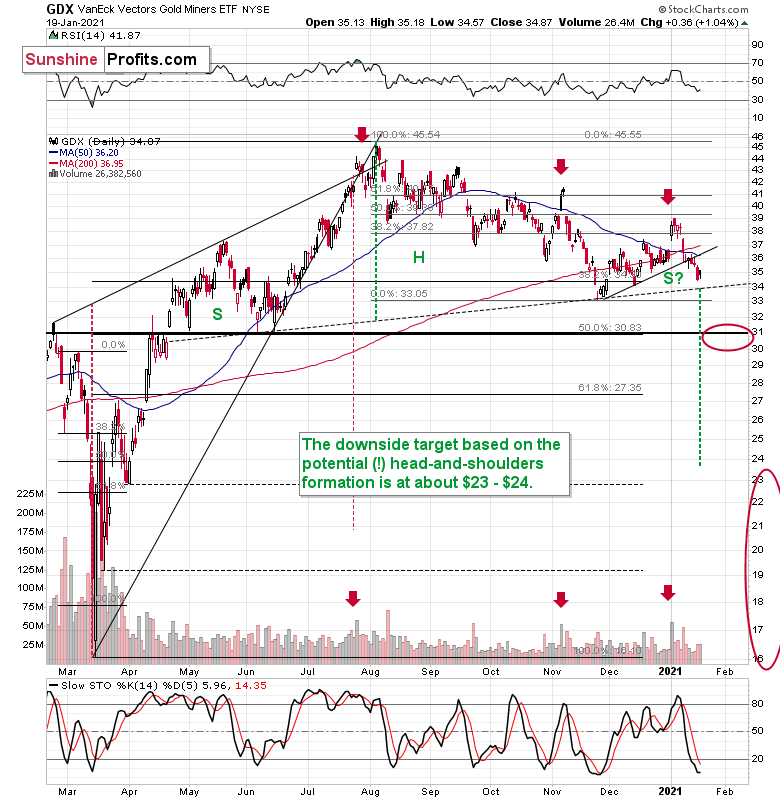
Figure 3 - VanEck Vectors Gold Miners ETF (GDX)
Miners were barely affected yesterday. They moved slightly higher, but it seems to have been just a pause, similar to what we saw in mid-November – nothing more than that.
Ok, so that’s what happened. Before stating that the USD’s breakdown and gold’s strength today are game changers for the very short term, let’s think about the possible explanation for these price moves. Is anything special happening today that makes today’s session at least a bit different than other sessions? Something that could be affecting the USD Index and gold?
Of course, there is something like that! It’s the U.S. President’s inauguration day!
In any case, such a day could affect the temporary market movement, but this year it’s particularly the case, because of the recent Washington D.C. riot and popular conviction that “something might happen” that would prevent the inauguration and effectively allow Donald Trump to remain the U.S. President.
As I explained previously, I think that the probability for seeing the above is extremely low, but at this time, the markets and investors might be worried that this really is something that’s at least somewhat possible. If so, then the USD Index should be moving temporarily lower and gold – being a safe-haven asset – is likely to be moving higher. Of course, only temporarily, because it will soon become clear that the inauguration takes place without any major obstacles. There might be some local protests etc., but nothing that would change the situation in any meaningful manner. Consequently, this is most likely the day when the uncertainties and tension regarding the transfer of power in the U.S. start to decrease. At the same time, it’s likely that they will peak right before decreasing. Therefore, what we’re seeing in the USD Index and gold right now is perfectly understandable and natural. And likely temporary.
This means that the breakdown in the USD Index could be invalidated soon – perhaps even tomorrow (or later today) and the opposite would be likely in the case of gold and silver’s strength. They might fade away quite quickly. Either way, the outlook remains bearish in my view.
Having said that, let’s discuss some non-technical issues.
All Aboard!
With record speculation underpinning the rise in U.S. equities, Bank of America’s Global Fund Manager Survey – a monthly report that canvasses the views of roughly 200 institutional investors – revealed (on Jan. 19) that positioning is even more one-sided than in the final moments of the Titanic.
Please have a look below:
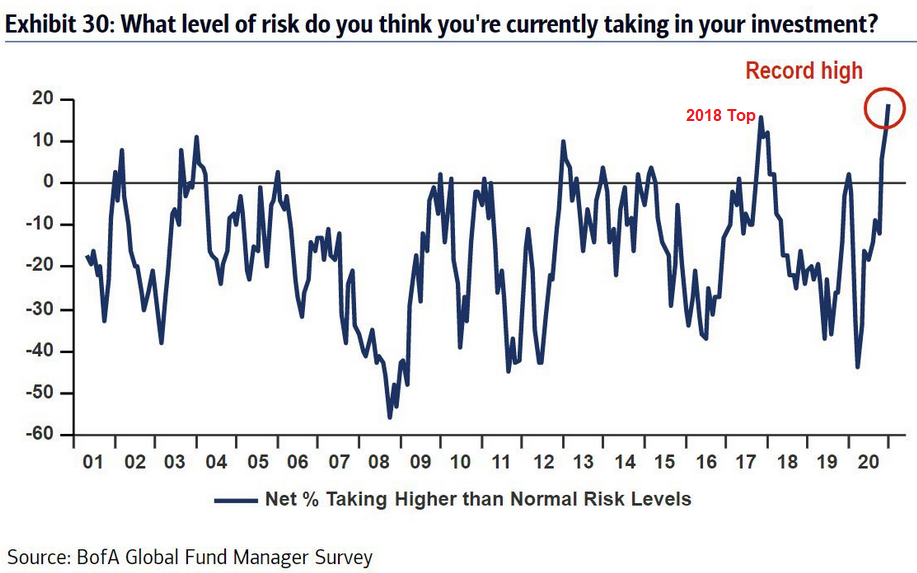
Figure 4
Unable to cash out of the U.S. equity casino, fund managers admitted to taking the most risk ever to achieve acceptable returns. And serving as a cherry on top, the ‘all aboard’ mentality has also coincided with fund managers’ cash balances hitting their lowest level since 2013 (the red circle below).
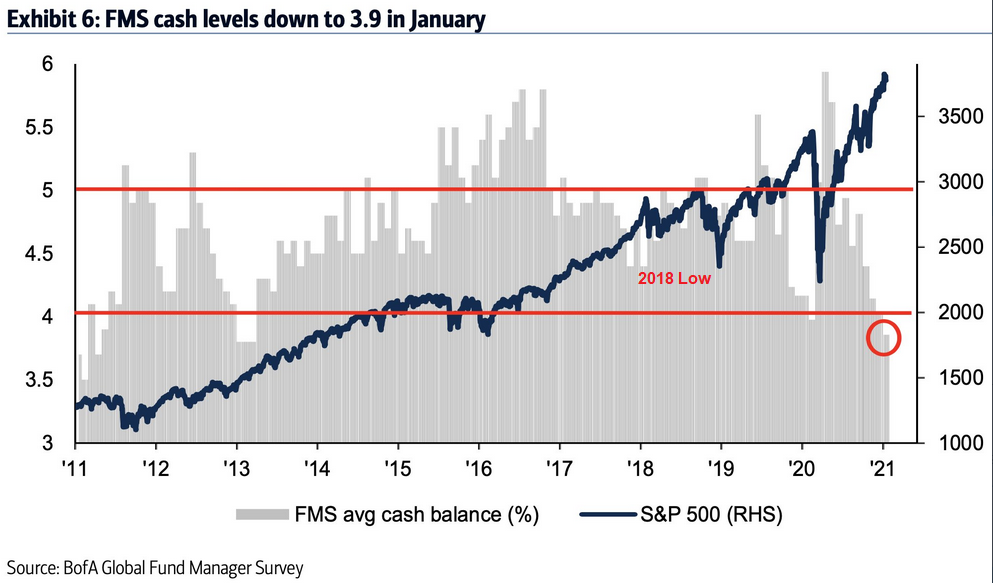
Figure 5
To explain, long-only institutional investors (like mutual funds) often keep 4% to 5% of their portfolios in cash (the horizontal red lines above). However, the vertical gray bars represent cash positions at different points in time (For context, the smaller the bar, the less cash they’re holding.) And if you analyze the gray bar intersecting with the red circle, it’s another sign of euphoric times.
However, if managers are already fully invested, who is left to buy if a drawdown occurs?
In addition, with valuations taking the elevator up and corporate profits stuck on the ground floor, the real earnings yield (the inverse of the P/E ratio adjusted for inflation) is also approaching the danger zone.
Please see below:
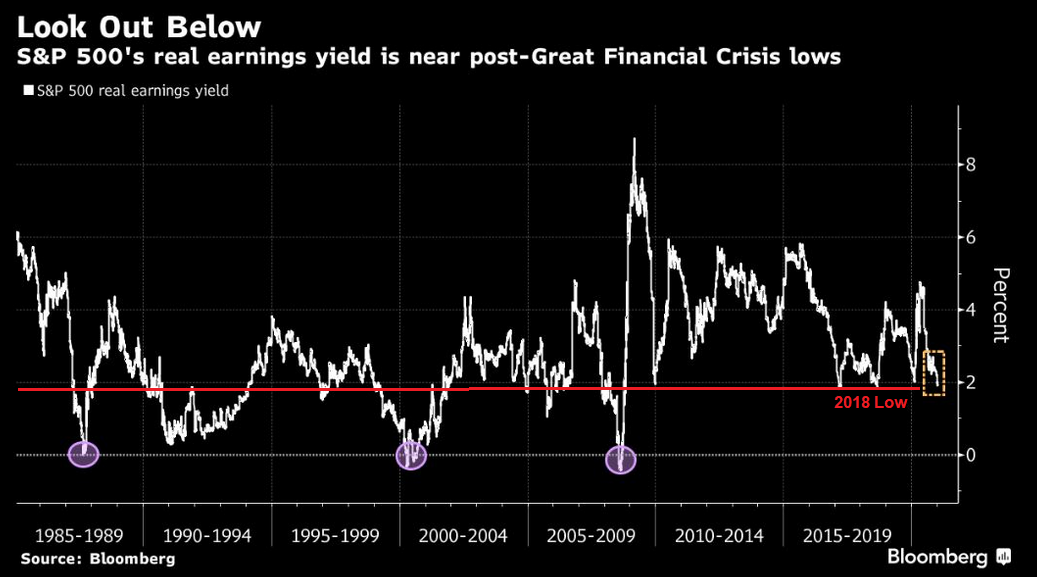
Figure 6
If you analyze the right side of the chart (Figure 6 - the small gold box), you can see that the S&P 500’s real earnings yield is nearing a point of no return. Positioned at the double-bottom set during the 2015 to 2019 interval, a continuation of the decline is exactly what happened right before the 1987 flash crash (Black Monday), the 2000 dot-com bubble and the 2008 financial (housing) crisis.
Furthermore, with gold miners already foretelling a potential top (which I covered in-depth on Jan. 18), Bank of America’s 3-month earnings revision ratio is at one of the highest levels in ~32 years.
Please see below:
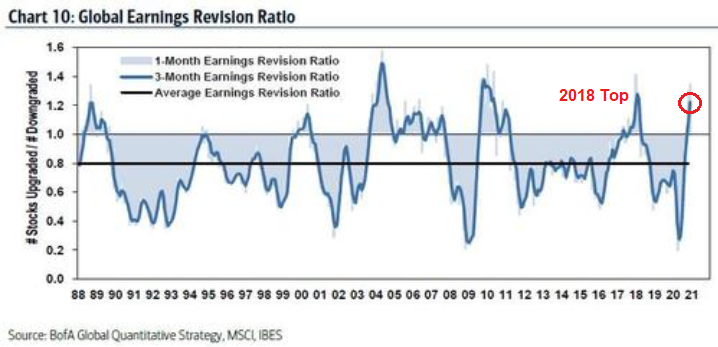
Figure 7
To explain, analysts increase their earnings estimates (the dark blue line moving higher) when they believe a company’s fundamentals have improved. Conversely, they revise earnings downward (the dark blue line moving lower) when they believe that fundamentals have deteriorated. More importantly though, upward revisions are met with cheers from market participants. When analysts forecast better performance, stock prices respond in kind. However, because the current reading is approaching all-time highs, the dynamic also works in reverse. If analysts maintain their current estimates (or even reduce them as reality sets in), the ratio’s decline to its historical average will put a major dent in the bull-case.
Even more telling, if you analyze the areas marked “2018 Top/Low” (on the charts above), you can see that today’s excess either equals or exceeds the levels that preceded the S&P 500 and NASDAQ’s 2018 end-of-year plunge.
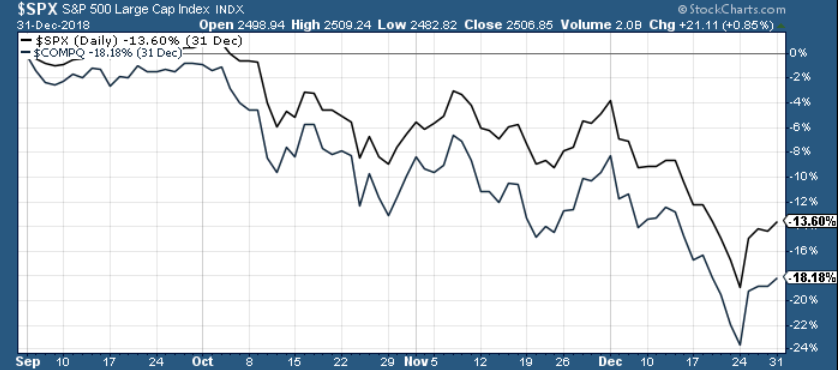
Figure 8
The bottom line?
U.S. equities are racing toward the edge of a cliff. And with no regard for traffic lights, warning signs or pedestrian gestures, investors are pressing the gas pedal harder each day. More importantly though, given the precious metals preference to tag along for the ride (in both directions due to their moderate-to-strong positive correlations), a reversal of fortunes could accelerate the pace and ferocity of the PMs’ likely decline – at least during the first part of the slide. Then, PMs and miners would likely eventually show strength despite the continuous declines in stocks, just like they did in the first half of 2020 – and this would likely serve as a confirmation of the bottom in the precious metals market.
The Eurozone Strikes Again
Despite the EUR/USD’s 0.43% bounce yesterday, the currency pair has been red for seven of the last nine trading days. And with each passing day, the Eurozone suffers more and more fundamental body blows (emphasizing that it’s only a matter of time before the euro is down for the count).
Yesterday, European car sales declined by another 3.7% in December – capping off their worst year ever.
Please see below:
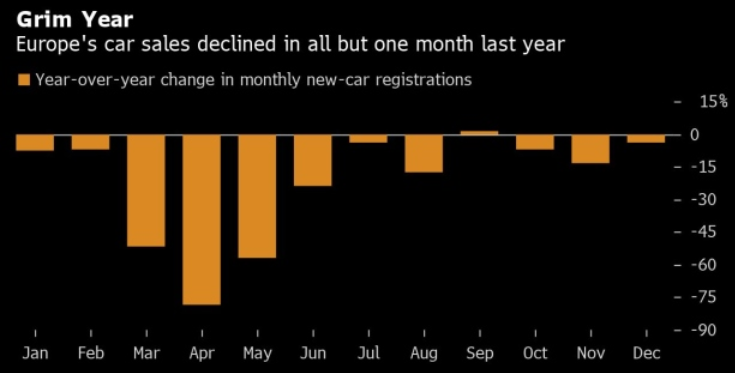
Figure 9 – European Car Sales (Jan – Dec, 2020)
Source: Bloomberg/ European Automobile Manufacturers Association
In relative contrast, U.S. auto sales have been much more resilient, delivering a higher trough (– 47% in the U.S. vs. – 78% in the Eurozone), thus the scale of Europe’s decline is much larger (For context, the U.S. data below is as of November, while the European data above is as of December.)
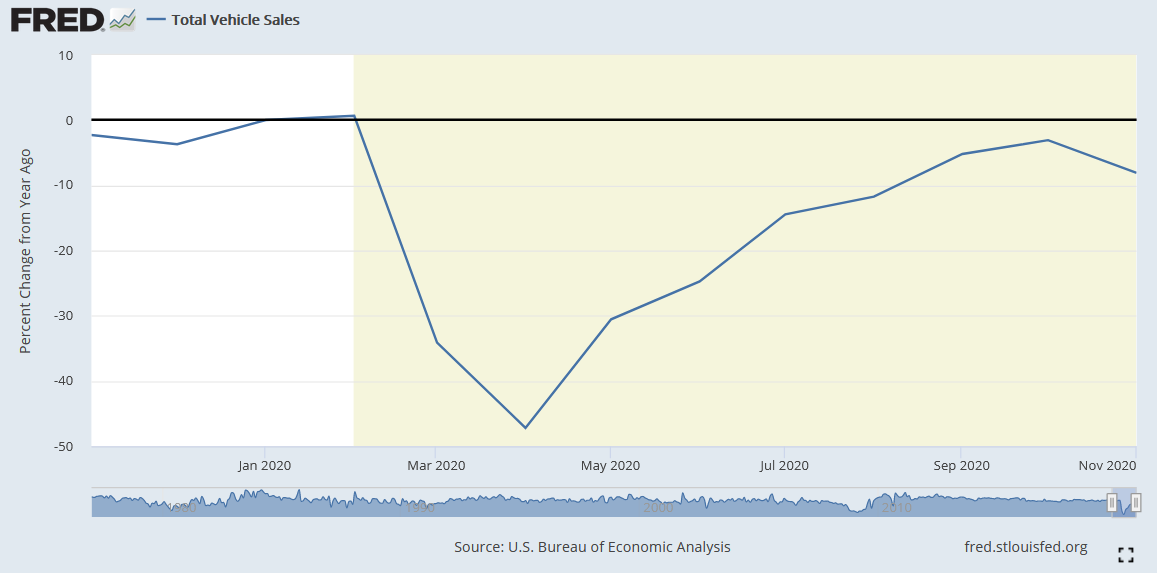
Figure 10 – U.S. Car Sales (Jan – Nov, 2020)
As you can see, the chart isn’t pretty. However, as I mentioned previously, currencies trade on a relative basis. Therefore, the less-bad U.S. data is bullish for the greenback.
In addition, Eurozone inflation is drastically underperforming the U.S. (And remember, inflation is a precursor to higher interest rates, which is a precursor to a stronger currency.) If you analyze the chart below, you can see the discrepancy.
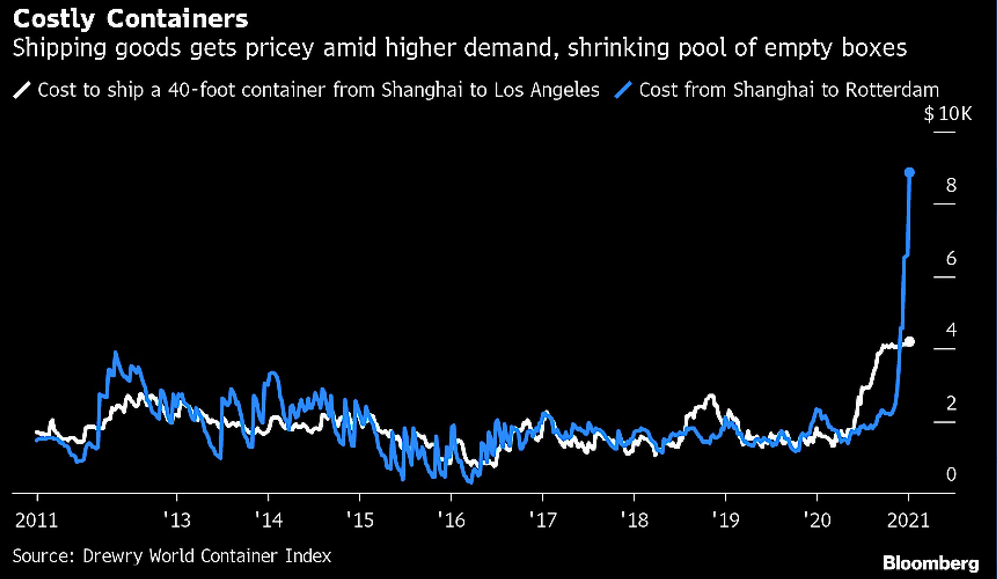
Figure 11
To explain, the Drewry World Container Index (WCI) measures shipping rates across eight routes to/from the U.S., Europe and Asia. And if you follow the blue line above, you can see that the cost of shipping from Shanghai (China) to Los Angeles has increased by more than double the cost to ship (the white line) from Shanghai to Rotterdam (the Netherlands).
Therefore, this is yet another sign that the Eurozone economy is recovering at a much slower pace than that of the U.S. Furthermore, considering that yesterday’s EUR/USD rally was more semblance than substance, the currency pair should continue its recent downtrend.
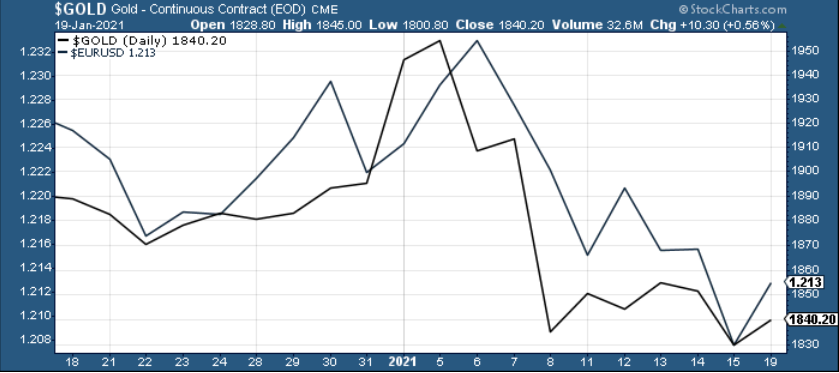
Figure 12
More importantly though, given gold’s strong correlation with the currency pair (highlighted by the movement of the two lines above), a declining EUR/USD should pressure the yellow metal in the coming weeks/months.
Letters to the Editor
Q: What price of gold will cancel the analysis and opinions which suggest to sell?
A: If you mean the stop-loss for gold, then I don’t have one. Well, if you insist, then I can say that if gold rallies above $2,200, then this price move – by itself – will cancel the bearish outlook. But this price level is so far away, that it’s relatively useless. There are many other factors that I’m monitoring in order to check if the outlook has changed or not. For instance, mining stocks’ strength relative to gold, or gold’s strength of reaction to the USD’s price movement. Plus, many other factors. Consequently, if the outlook changes, I will likely be able to say that well before gold moves to $2,200.
One more example of why price levels of gold are not enough: Let’s imagine that gold rallied $100 during one hypothetical week. Does it make the outlook bullish? (please keep in mind that outlook is about what is likely to happen next, not what happened previously). The correct reply is “I don’t know”, because the context is too important to be ignored. The first question would be what else happened during that hypothetical week, especially with the USD Index and the real interest rates.
If, during the same week, the USD Index declined by 0.50 (half of one index point), gold’s rally would be bullish, as it would be a sign of strength.
But, if – during the same, hypothetical week – the USD Index declined by a full 20 index points (sliding from 90 to 70, thus moving to all-time lows), then gold’s $100 rally would be very small compared to how it should have reacted, and it would be a show of weakness – thus making the outlook for gold bearish. The above are also examples of relative strength, which must be taken into account in analyses.
Overview of the Upcoming Decline
- As far as the current overview of the upcoming decline is concerned, I think it has already begun.
- During the final part of the slide (which could end within the next 1-12 weeks or so), I expect silver to decline more than miners. That would align with how the markets initially reacted to the COVID-19 threat.
- The impact of all the new rounds of money printing in the U.S. and Europe on the precious metals prices is incredibly positive in the long run, which does not make the short-term decline improbable. Markets can and will get ahead of themselves and decline afterward – sometimes very profoundly – before continuing with their upward climb.
- The plan is to exit the current short positions in miners after they decline far and fast, but at the same time, silver drops just “significantly” (we expect this to happen in 1 – 5 weeks ). In other words, the decline in silver should be severe, but the decline in the miners should look “ridiculous”. That’s what we did in March when we bought practically right at the bottom . It is a soft, but simultaneously broad instruction, so additional confirmations are necessary.
- As a point of reference, given that the inverse pattern above mirrors today’s price action, the duration of the precious metals’ decline could last longer than my initial forecast. Keep in mind though, a prolonged bear market is not my base case; I’m merely indicating that the possibility exists.
- In absence, I expect a bottom to form with gold falling to roughly $1,700 - $1,750 . If – at the same time – gold moves to about $1,700 - $1,750 and miners are already after a ridiculously big drop (say, to $31 - $32 in the GDX ETF – or lower), we will probably exit the short positions in the miners and at the same time enter short positions in silver. However, it could also be the case that we’ll wait for a rebound before re-entering short position in silver – it’s too early to say at this time. It’s also possible that we’ll enter very quick long positions between those short positions.
- The precious metals market's final bottom is likely to take shape when gold shows significant strength relative to the USD Index . It could take the form of a gold’s rally or a bullish reversal, despite the ongoing USD Index rally.
Summary
Summing up, the outlook for gold and the rest of the precious metals market is bearish for at least the next few weeks. After topping at its triangle-vertex-based reversal, gold moved sharply lower and it just invalidated the breakout above its declining resistance line, while breaking below the rising support line. All this happened as the USD Index rallied visibly above its declining resistance lines and invalidated the breakdown below the 2020 lows. This creates a strongly bearish combination for the precious metals market.
The USD Index and cryptocurrencies suggest that we’re seeing the repeat of early 2018, when the USD Index bottomed. Given the current correlations between PMs and the USD Index, the rally in the USDX is likely to have very bearish implications for the precious metals market.
Despite a recent decline, it seems that the USD Index is going to move higher in the following months and weeks, in turn causing gold to decline. At some point gold is likely to stop responding to dollar’s bearish indications, and based on the above analysis, it seems that this is already taking place.
Naturally, everyone's trading is their responsibility. But in our opinion, if there ever was a time to either enter a short position in the miners or increase its size if it was not already sizable, it's now. We made money on the March decline, and on the March rebound, with another massive slide already underway.
After the sell-off (that takes gold to about $1,500), we expect the precious metals to rally significantly. The final part of the decline might take as little as 1-5 weeks, so it's important to stay alert to any changes.
Most importantly, please stay healthy and safe. We made a lot of money on the March decline and the subsequent rebound (its initial part) price moves (and we'll likely earn much more in the following weeks and months), but you have to be healthy to enjoy the results.
As always, we'll keep you - our subscribers - informed.
To summarize:
Trading capital (supplementary part of the portfolio; our opinion): Full speculative short positions (300% of the full position) in mining stocks is justified from the risk to reward point of view with the following binding exit profit-take price levels:
Senior mining stocks (price levels for the GDX ETF): binding profit-take exit price: $32.02; stop-loss: none (the volatility is too big to justify a SL order in case of this particular trade); binding profit-take level for the DUST ETF: $28.73; stop-loss for the DUST ETF: none (the volatility is too big to justify a SL order in case of this particular trade)
Junior mining stocks (price levels for the GDXJ ETF): binding profit-take exit price: $42.72; stop-loss: none (the volatility is too big to justify a SL order in case of this particular trade); binding profit-take level for the JDST ETF: $21.22; stop-loss for the JDST ETF: none (the volatility is too big to justify a SL order in case of this particular trade)
For-your-information targets (our opinion; we continue to think that mining stocks are the preferred way of taking advantage of the upcoming price move, but if for whatever reason one wants / has to use silver or gold for this trade, we are providing the details anyway. In our view, silver has greater potential than gold does):
Silver futures downside profit-take exit price: unclear at this time - initially, it might be a good idea to exit, when gold moves to $1,703.
Gold futures downside profit-take exit price: $1,703
Long-term capital (core part of the portfolio; our opinion): No positions (in other words: cash
Insurance capital (core part of the portfolio; our opinion): Full position
Whether you already subscribed or not, we encourage you to find out how to make the most of our alerts and read our replies to the most common alert-and-gold-trading-related-questions.
Please note that we describe the situation for the day that the alert is posted in the trading section. In other words, if we are writing about a speculative position, it means that it is up-to-date on the day it was posted. We are also featuring the initial target prices to decide whether keeping a position on a given day is in tune with your approach (some moves are too small for medium-term traders, and some might appear too big for day-traders).
Additionally, you might want to read why our stop-loss orders are usually relatively far from the current price.
Please note that a full position doesn't mean using all of the capital for a given trade. You will find details on our thoughts on gold portfolio structuring in the Key Insights section on our website.
As a reminder - "initial target price" means exactly that - an "initial" one. It's not a price level at which we suggest closing positions. If this becomes the case (like it did in the previous trade), we will refer to these levels as levels of exit orders (exactly as we've done previously). Stop-loss levels, however, are naturally not "initial", but something that, in our opinion, might be entered as an order.
Since it is impossible to synchronize target prices and stop-loss levels for all the ETFs and ETNs with the main markets that we provide these levels for (gold, silver and mining stocks - the GDX ETF), the stop-loss levels and target prices for other ETNs and ETF (among other: UGL, GLL, AGQ, ZSL, NUGT, DUST, JNUG, JDST) are provided as supplementary, and not as "final". This means that if a stop-loss or a target level is reached for any of the "additional instruments" (GLL for instance), but not for the "main instrument" (gold in this case), we will view positions in both gold and GLL as still open and the stop-loss for GLL would have to be moved lower. On the other hand, if gold moves to a stop-loss level but GLL doesn't, then we will view both positions (in gold and GLL) as closed. In other words, since it's not possible to be 100% certain that each related instrument moves to a given level when the underlying instrument does, we can't provide levels that would be binding. The levels that we do provide are our best estimate of the levels that will correspond to the levels in the underlying assets, but it will be the underlying assets that one will need to focus on regarding the signs pointing to closing a given position or keeping it open. We might adjust the levels in the "additional instruments" without adjusting the levels in the "main instruments", which will simply mean that we have improved our estimation of these levels, not that we changed our outlook on the markets. We are already working on a tool that would update these levels daily for the most popular ETFs, ETNs and individual mining stocks.
Our preferred ways to invest in and to trade gold along with the reasoning can be found in the how to buy gold section. Furthermore, our preferred ETFs and ETNs can be found in our Gold & Silver ETF Ranking.
As a reminder, Gold & Silver Trading Alerts are posted before or on each trading day (we usually post them before the opening bell, but we don't promise doing that each day). If there's anything urgent, we will send you an additional small alert before posting the main one.
Thank you.
Przemyslaw Radomski, CFA
Founder, Editor-in-chief

