

Briefly: in our opinion, full (250% of the regular size of the position) speculative short positions in gold, silver and mining stocks are justified from the risk/reward perspective at the moment of publishing this Alert.
Almost nothing changed on the precious metals charts and the same goes for the charts featuring related markets. But that doesn’t mean that we have nothing interesting to say. Conversely, while there is little to say about yesterday’s price movement, there are three important developments that all gold and silver traders should be aware of, but that 95%+ of them miss (probably 99%+ as we didn’t see them described in any other publicly available analysis). In today’s analysis we prepared for you two long-term charts and one more short-term oriented, featuring silver.
Let’s start with the former. Both long-term signs are based on gold. One can be seen in gold’s price relative to the value of the general stock market and the other is based on gold’s price in terms of the Japanese yen.
Let’s take a look at the gold to S&P 500 ratio first.
Gold vs. Stocks
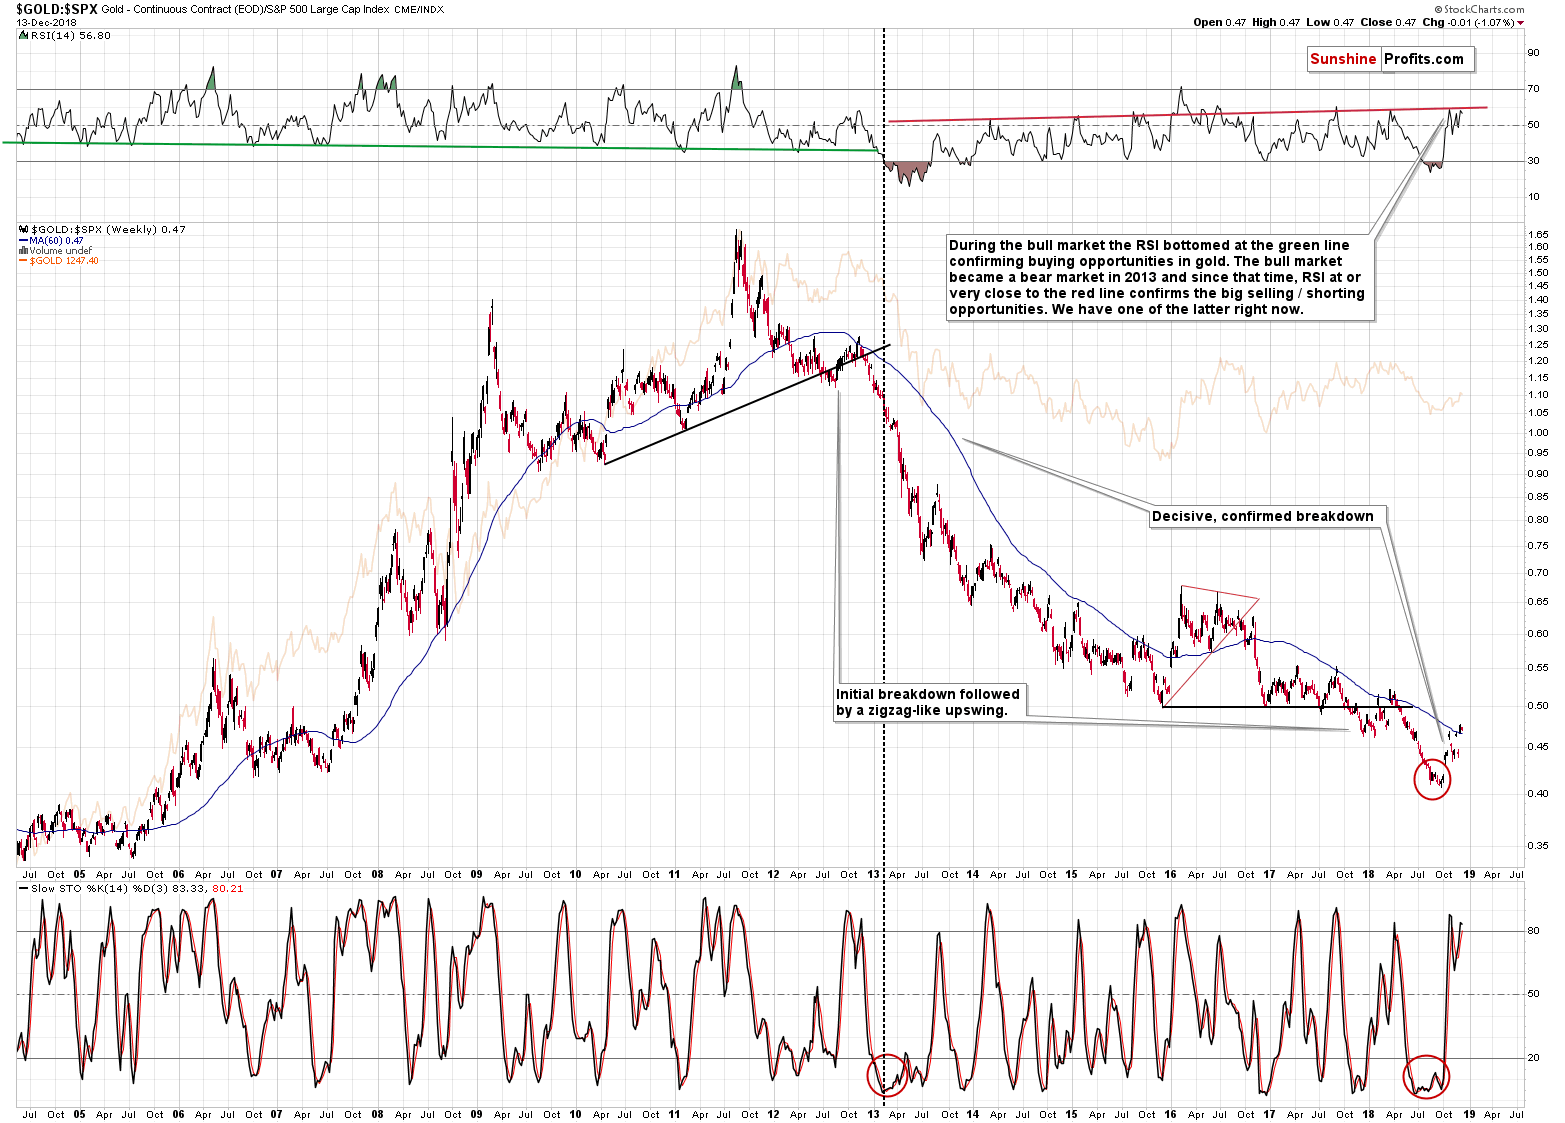
The important thing about this ratio is that it moved higher recently and based on 3 reasons, it appears too high.
One thing is that the ratio moved a bit above its 60-week moving average. That’s important because this is exactly what preceded the last two significant declines in gold (including the one that started in mid-2018). That’s also what directly preceded the huge 2013 slide.
The second thing is the RSI indicator. It moved to the red line that served as resistance multiple times since 2013. Reaching it often (almost always) meant a top in the ratio as well as in gold.
The third thing is that the Stochastic indicator just moved above 80, confirming the overbought status of the gold market.
The outlook for the ratio is bearish. This is important for gold and for the rest of the precious metals market, because the moves in the ratio quite often precede what happens in the metals. Moreover, the ratio does a great job at smoothing out the short-term price moves, while helping to stay focused on the big moves. And the next big move is likely to be to the downside.
Having said that, let’s move to the second gold-related chart.
Gold’s Japanese Triangles
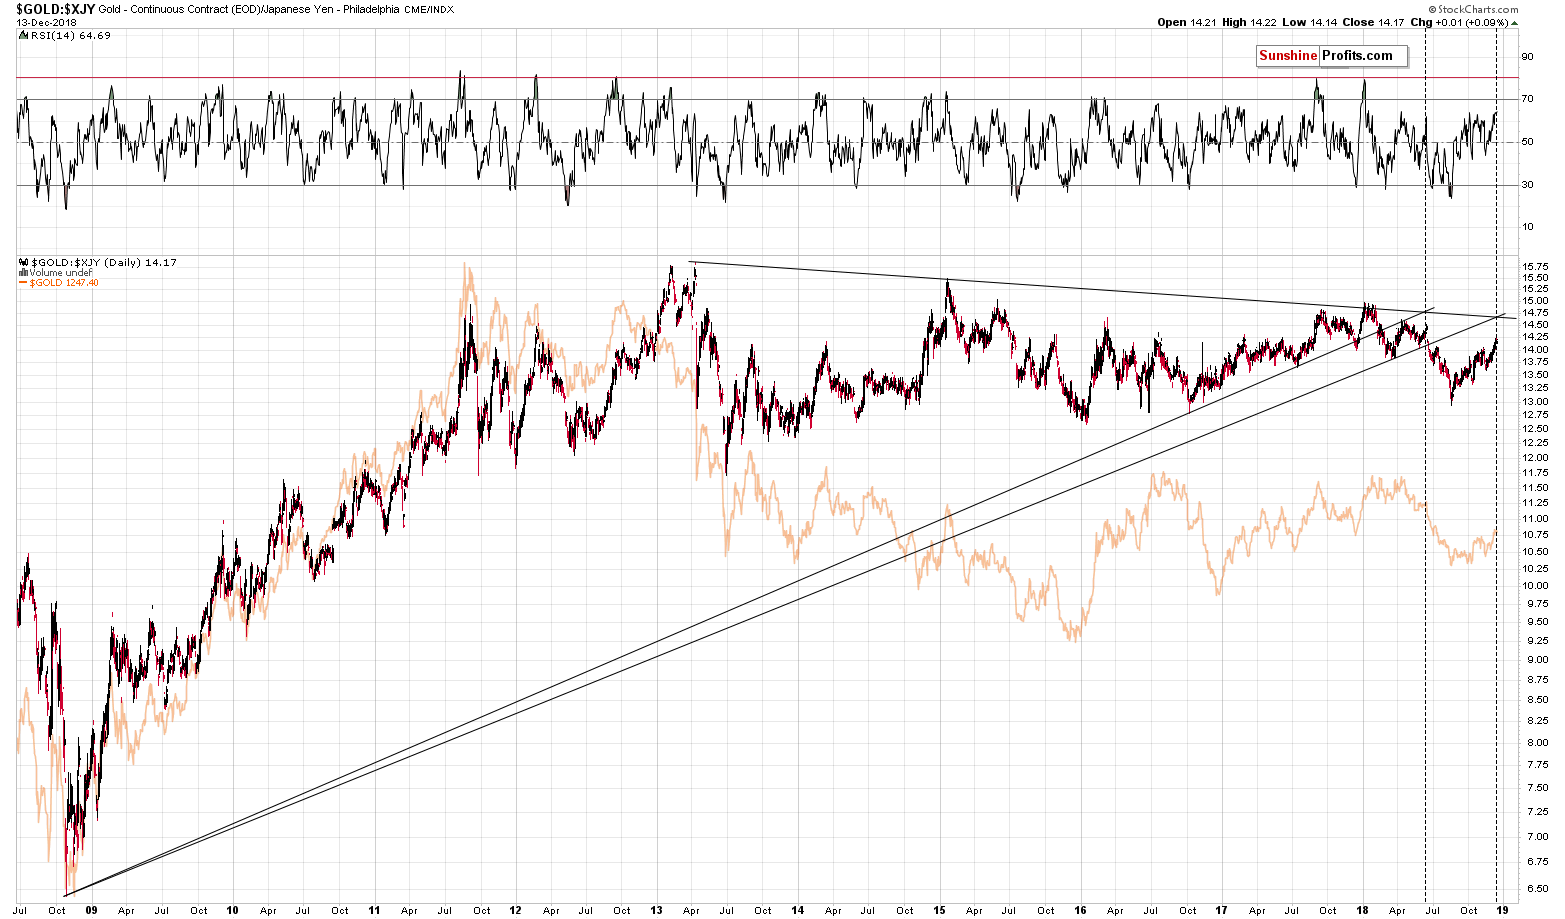
The key thing that we can see on the above chart are two big triangles. Both are based on the declining resistance line that’s based on the 2013 and 2015 tops. One is also based on the rising support line that’s based on the 2018 and late-2016 bottoms. The other is additionally based on the rising support line that’s based on the 2018 and early 2018 bottoms. Consequently, both triangles are quite similar, as only one bottom on which they are based is different. The above is important because of two reasons.
The first reason is that the vertexes of the triangles usually work as reversals. This is a general rule, but the important detail here is that it proved to work multiple times for the precious metals market – that’s why we’re using this technique.
The second reason is that the first triangle already worked in a situation that was similar to the current one. It was at the end of the previous consolidation in gold. The value of gold in terms of the Japanese yen moved higher beforehand and we can see the same thing also today. The reversal implies a change in direction, which in this case would obviously mean a start of a decline. It’s likely that this decline would be seen also from our regular USD perspective as the medium-term moves tend to take place at the same time in both cases. Consequently, the implications are bearish.
The third, and final chart for today is the one featuring silver.
Silver’s Self-Similarity
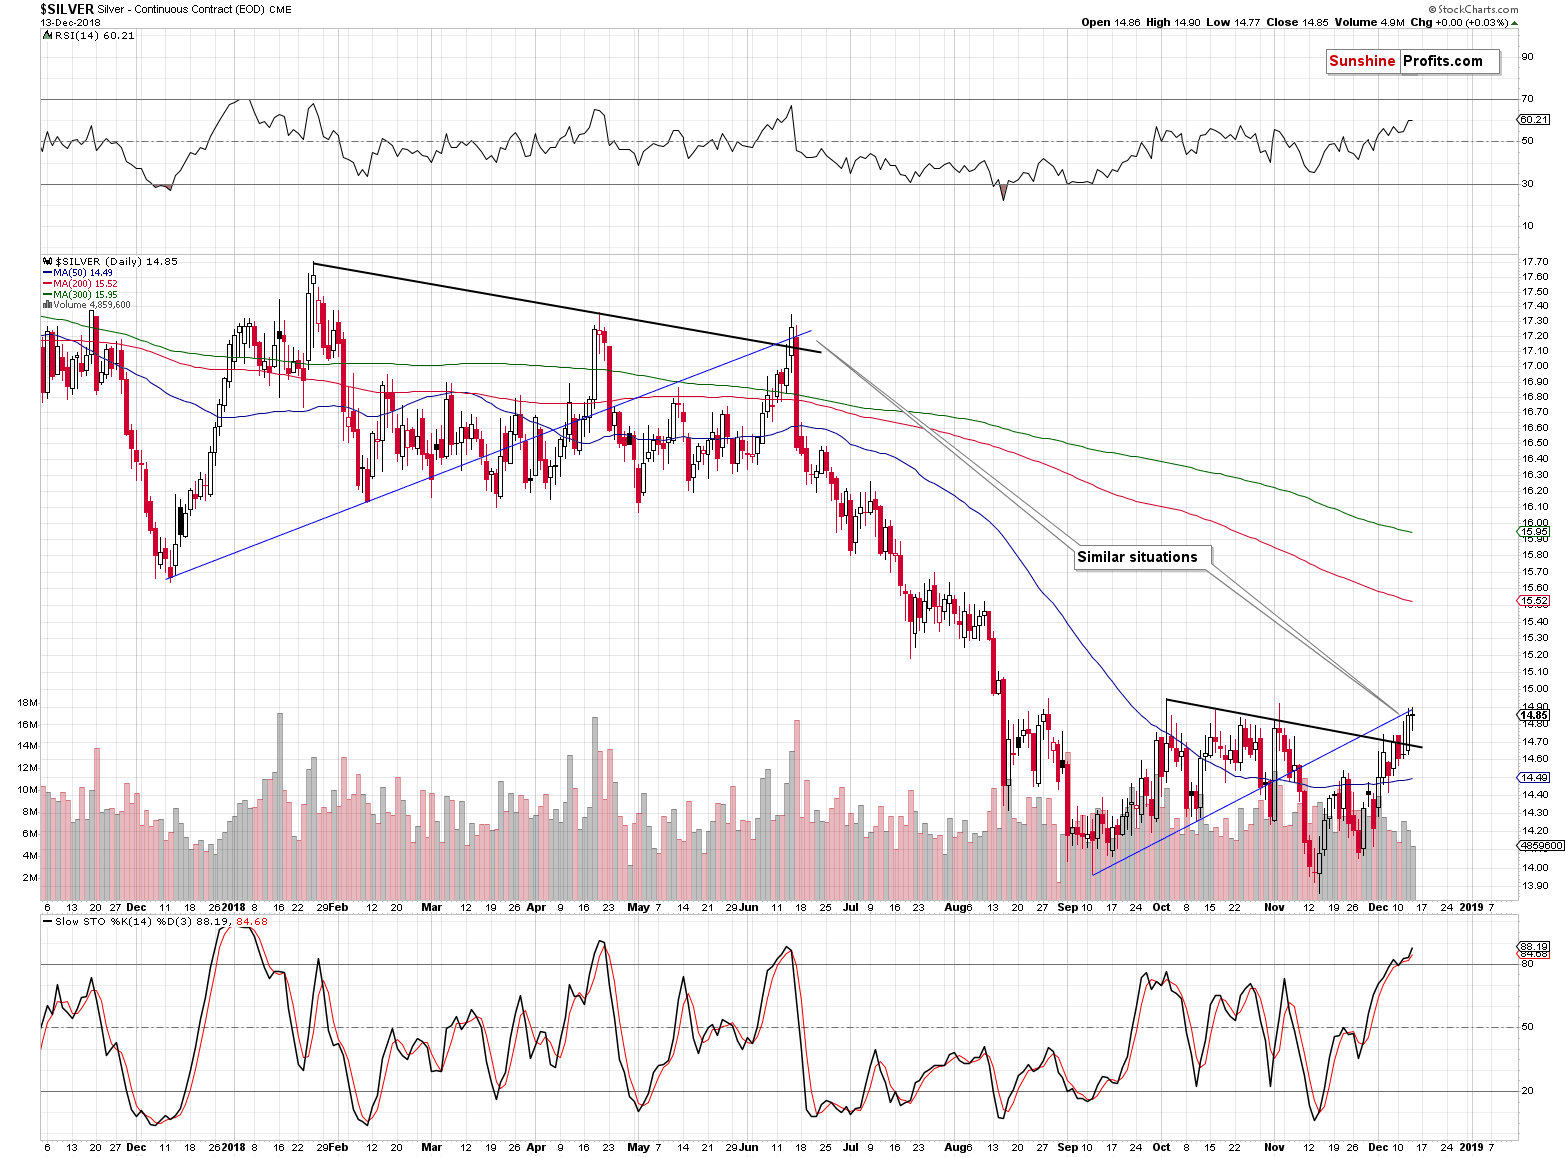
We already wrote about silver’s outperformance and that it serves as a bearish confirmation. We also wrote how this outperformance makes the self-similarity in the USD Index and its link to PMs even stronger. But what we didn’t write yet is how the series of recent highs is similar to the series of highs that we saw in the first half of this year.
The current back-and-forth movement is taking less time, but it’s quite similar in terms of shape. Please note the declining black lines based on the initial tops and the rising blue lines that were based on the initial bottoms. The entire pattern ended, and the biggest decline of the year started shortly after the blue line crossed the black line and the final confirmation came when silver moved a bit above the blue line.
That’s exactly what we saw this week. The move above the blue line was really small (just a few cents), but still, the pattern is very similar in general. This, plus all the points that we discussed earlier this week (and in the previous months) and above in today’s analysis confirm the bearish outlook for silver and the rest of the precious metals sector.
On a side note, do you remember the analysis of silver as an oscillator? Silver did break out of the pattern in which all the subsequent moves are smaller than the previous ones and the breakdown was – as we had indicated earlier – to the downside. And it most likely didn’t break below a multi-month pattern to end the move above the previous lows. The move lower has most likely never ended.
Summary
Summing up, this prolonged correction within the big downtrend has been very tiring, but based on the long-term factors being patient was very well worth it, and based on the short-term signs, it seems that the waiting is over or about to be over. The outlook for the precious metals market remains very bearish for the following weeks and months and short position remains justified from the risk to reward point of view, even if we see a few extra days of back and forth trading or even a small brief upswing. There is a very high probability of a huge downswing that makes the short position justified, not the outlook for the next few days. It's confirmed by multiple factors, i.a. silver’s recent outperformance, gold’s performance relative to the general stock market, USD’s self-similar pattern that’s confirmed by PMs performance, and many more.
As always, we’ll keep you – our subscribers – informed.
To summarize:
Trading capital (supplementary part of the portfolio; our opinion): Full short positions (250% of the full position) in gold, silver and mining stocks are justified from the risk/reward perspective with the following stop-loss orders and exit profit-take price levels:
- Gold: profit-take exit price: $1,062; stop-loss: $1,272; initial target price for the DGLD ETN: $82.96; stop-loss for the DGLD ETN $47.17
- Silver: profit-take exit price: $12.32; stop-loss: $15.11; initial target price for the DSLV ETN: $47.67; stop-loss for the DSLV ETN $28.37
- Mining stocks (price levels for the GDX ETF): profit-take exit price: $13.12; stop-loss: $20.83; initial target price for the DUST ETF: $80.97; stop-loss for the DUST ETF $24.87
Note: the above is a specific preparation for a possible sudden price drop, it does not reflect the most likely outcome. You will find a more detailed explanation in our August 1 Alert. In case one wants to bet on junior mining stocks’ prices (we do not suggest doing so – we think senior mining stocks are more predictable in the case of short-term trades – if one wants to do it anyway, we provide the details), here are the stop-loss details and target prices:
- GDXJ ETF: profit-take exit price: $17.52; stop-loss: $31.23
- JDST ETF: initial target price: $154.97 stop-loss: $51.78
Long-term capital (core part of the portfolio; our opinion): No positions (in other words: cash)
Insurance capital (core part of the portfolio; our opinion): Full position
Important Details for New Subscribers
Whether you already subscribed or not, we encourage you to find out how to make the most of our alerts and read our replies to the most common alert-and-gold-trading-related-questions.
Please note that the in the trading section we describe the situation for the day that the alert is posted. In other words, it we are writing about a speculative position, it means that it is up-to-date on the day it was posted. We are also featuring the initial target prices, so that you can decide whether keeping a position on a given day is something that is in tune with your approach (some moves are too small for medium-term traders and some might appear too big for day-traders).
Plus, you might want to read why our stop-loss orders are usually relatively far from the current price.
Please note that a full position doesn’t mean using all of the capital for a given trade. You will find details on our thoughts on gold portfolio structuring in the Key Insights section on our website.
As a reminder – “initial target price” means exactly that – an “initial” one, it’s not a price level at which we suggest closing positions. If this becomes the case (like it did in the previous trade) we will refer to these levels as levels of exit orders (exactly as we’ve done previously). Stop-loss levels, however, are naturally not “initial”, but something that, in our opinion, might be entered as an order.
Since it is impossible to synchronize target prices and stop-loss levels for all the ETFs and ETNs with the main markets that we provide these levels for (gold, silver and mining stocks – the GDX ETF), the stop-loss levels and target prices for other ETNs and ETF (among other: UGLD, DGLD, USLV, DSLV, NUGT, DUST, JNUG, JDST) are provided as supplementary, and not as “final”. This means that if a stop-loss or a target level is reached for any of the “additional instruments” (DGLD for instance), but not for the “main instrument” (gold in this case), we will view positions in both gold and DGLD as still open and the stop-loss for DGLD would have to be moved lower. On the other hand, if gold moves to a stop-loss level but DGLD doesn’t, then we will view both positions (in gold and DGLD) as closed. In other words, since it’s not possible to be 100% certain that each related instrument moves to a given level when the underlying instrument does, we can’t provide levels that would be binding. The levels that we do provide are our best estimate of the levels that will correspond to the levels in the underlying assets, but it will be the underlying assets that one will need to focus on regarding the signs pointing to closing a given position or keeping it open. We might adjust the levels in the “additional instruments” without adjusting the levels in the “main instruments”, which will simply mean that we have improved our estimation of these levels, not that we changed our outlook on the markets. We are already working on a tool that would update these levels on a daily basis for the most popular ETFs, ETNs and individual mining stocks.
Our preferred ways to invest in and to trade gold along with the reasoning can be found in the how to buy gold section. Additionally, our preferred ETFs and ETNs can be found in our Gold & Silver ETF Ranking.
As a reminder, Gold & Silver Trading Alerts are posted before or on each trading day (we usually post them before the opening bell, but we don't promise doing that each day). If there's anything urgent, we will send you an additional small alert before posting the main one.
=====
Latest Free Trading Alerts:
Central banks’ purchases create a floor for gold prices. Myth or fact? We invite you to read our today’s article about the central banks’ demand for gold and find out whether it will save gold.
=====
Hand-picked precious-metals-related links:
PRECIOUS-Gold wilts on dollar strength; set for weekly decline
Gold To Drop Below $1,200 In 2019 - BNP Paribas
Platinum price gets $6 billion shot in the arm
Gold Fields to restart production in South Africa as workers return
=====
In other news:
World stocks tumble on weak economic data from China and Europe
U.S. Stock Market Exodus Is Second-Biggest on Record, BofA Says
Blair: majority soon in parliament for new Brexit referendum – Politics live
‘123456’ Is 2018's Worst Password, Study Says. But This Year, ‘donald’ Joined the List
=====
Thank you.
Sincerely,
Przemyslaw Radomski, CFA
Editor-in-chief, Gold & Silver Fund Manager
Gold & Silver Trading Alerts
Forex Trading Alerts
Oil Investment Updates
Oil Trading Alerts

