

Briefly: in our opinion, full (250% of the regular size of the position) speculative short position in gold, silver, and mining stocks is justified from the risk/reward perspective at the moment of publishing this Alert.
The last few trading days in gold were quite interesting, but overall gold has been a quite boring market in the last couple of months. Gold's volatility index dropped to new lows as the current back and forth movement is just a small part of the same kind of movement on a broader scale. It's more of the same. And when gold's volatility gets very low, interesting things tend to happen next over 80% of the time. In other words, the situation in gold is now so boring that it's a signal on its own. In today's analysis, we'll dig into details and we will also discuss the likely reason for mining stocks' strength on Friday along with its implications.
Let's start with gold's boring, yet effective signal.
Extracting Value from Boredom
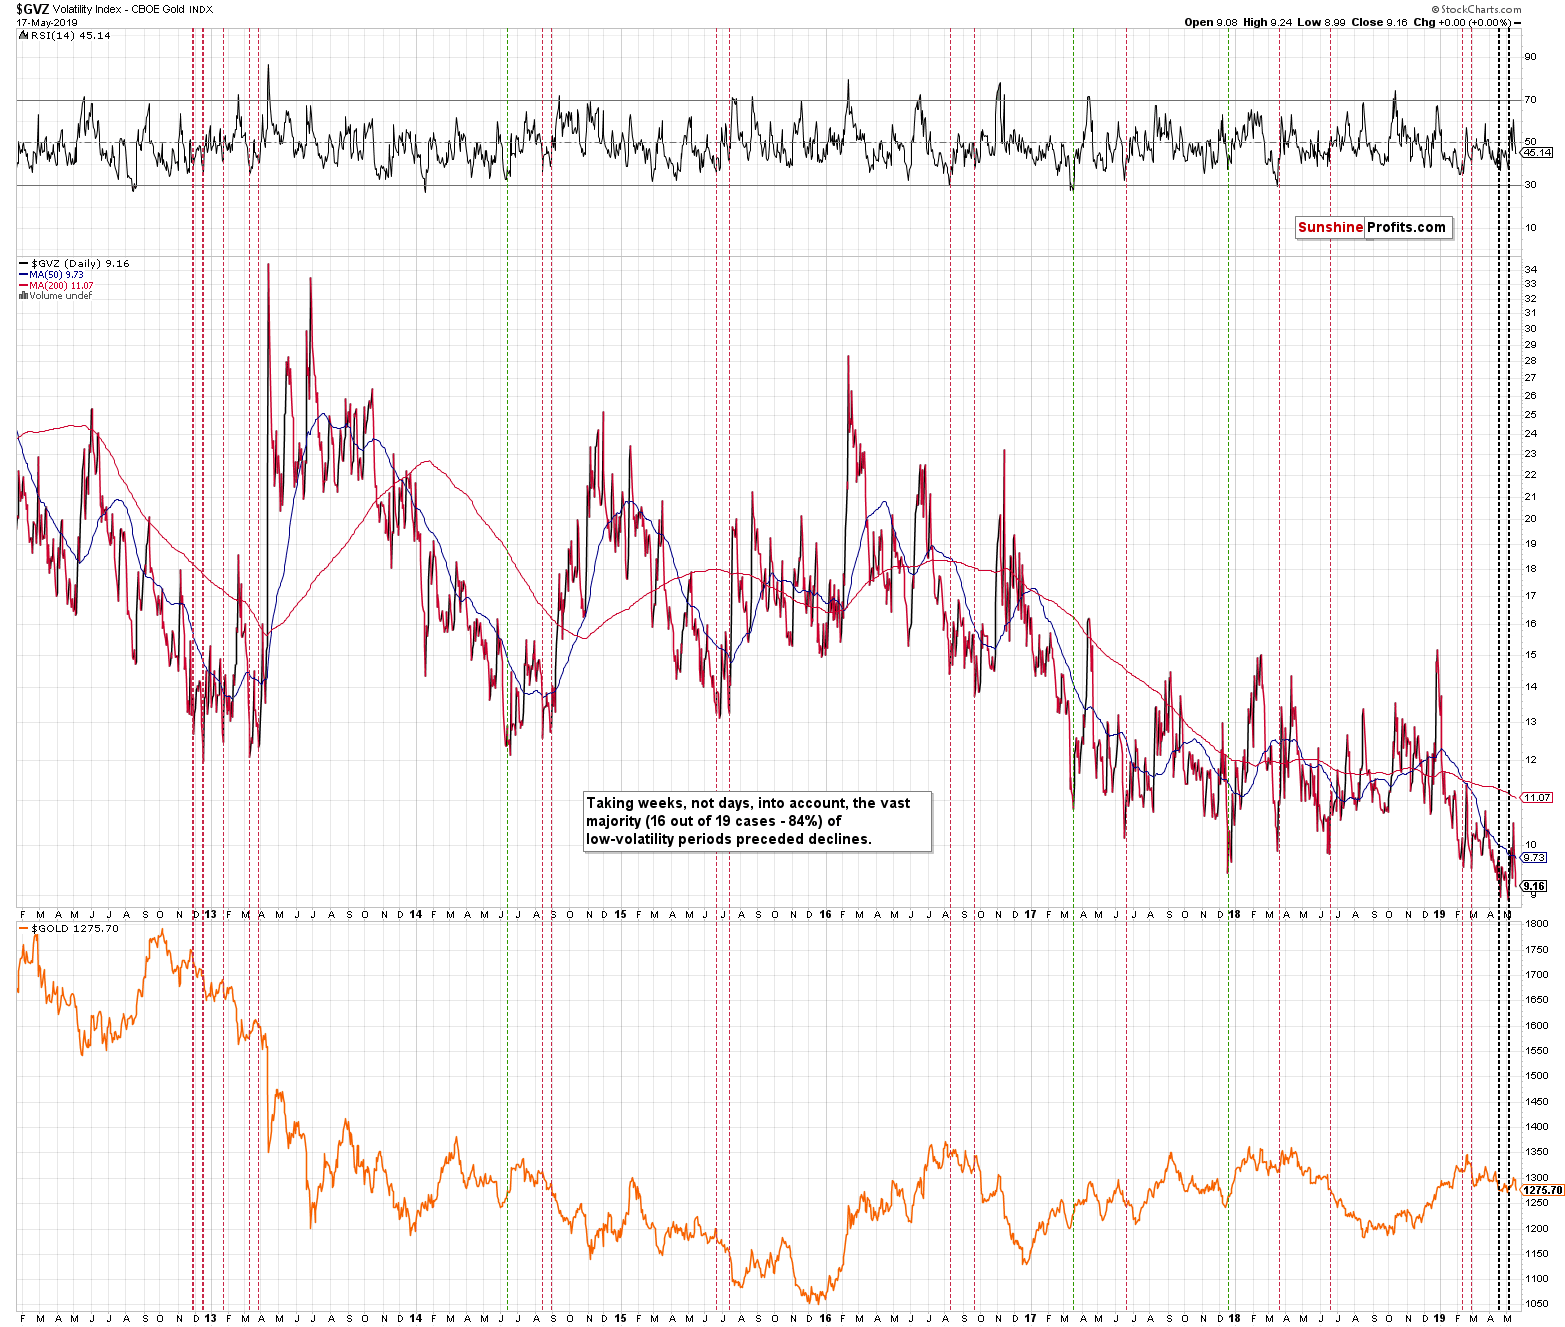
The gold volatility index moved to new lows this year and it is not a one-time event. There were already two moves below the 2017 and 2018 lows and the current move lower is the third attempt to slide even lower. The 50-day moving average is also at the levels that haven't been seen previously.
What does it mean? It most likely means lower gold prices.
We marked the similar very low-volume cases with vertical dashed lines. The red ones are the ones that were followed by gold's declines and the green ones are the ones that were followed by upswings in gold. We didn't pay attention to daily moves, but to bigger moves that one can measure in terms of weeks. It turns out that 16 out of 19 preceding signals (about 84% of them) were followed by gold's declines. We're not counting the last 2 signals as they are still "in play".
The only three bullish cases were actually single spikes lower in volatility. It was not a prolonged boredom, like the one that we saw in late 2012 / early 2013 and it's not like what we see right now. Consequently, it seems that the above-mentioned 84% is likely understated in terms of the volatility-based probability of declines in gold in the following weeks.
Many goldbugs and other investors will view the lack of volatility as something neutral. After all, gold is not doing much, so why should it have any implications going forward? The point is that it does have implications as almost all low-volatility periods, especially the ones similar to the current one are, were followed by meaningful downtrends.
Naturally, there are also other signals that that need to be considered, but they also support lower gold prices in the following weeks.
Let's examine the most recent ones.
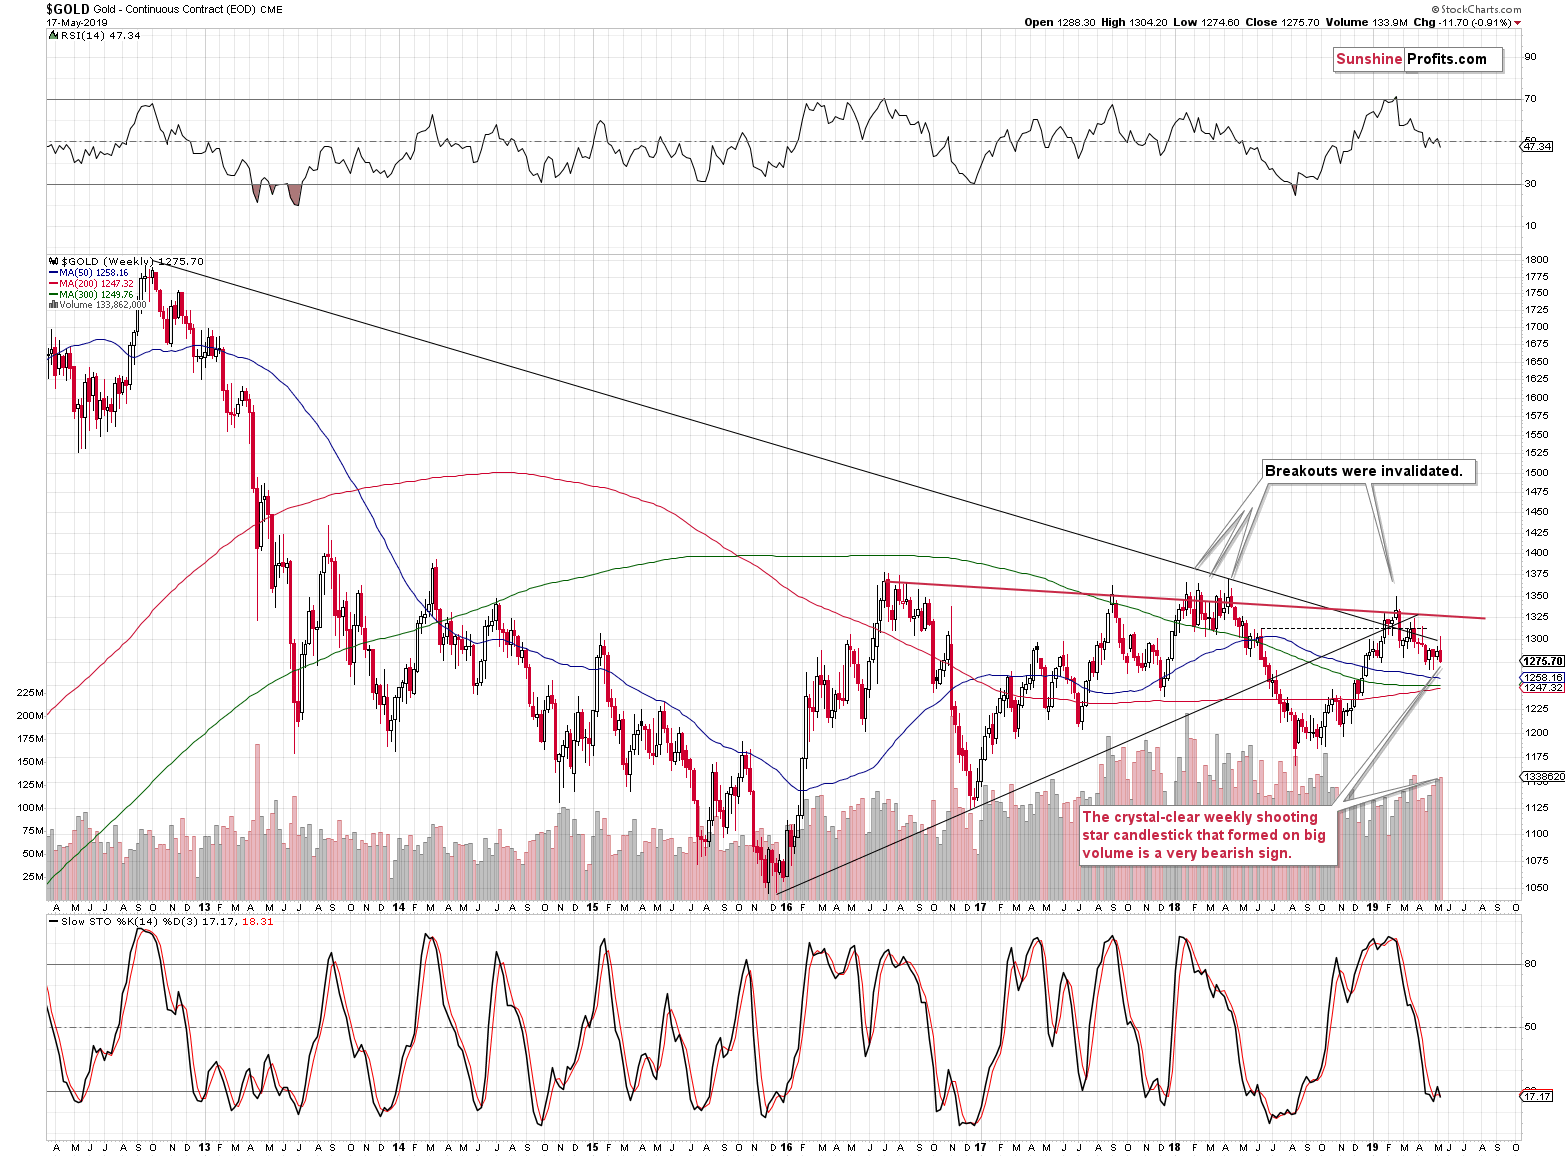
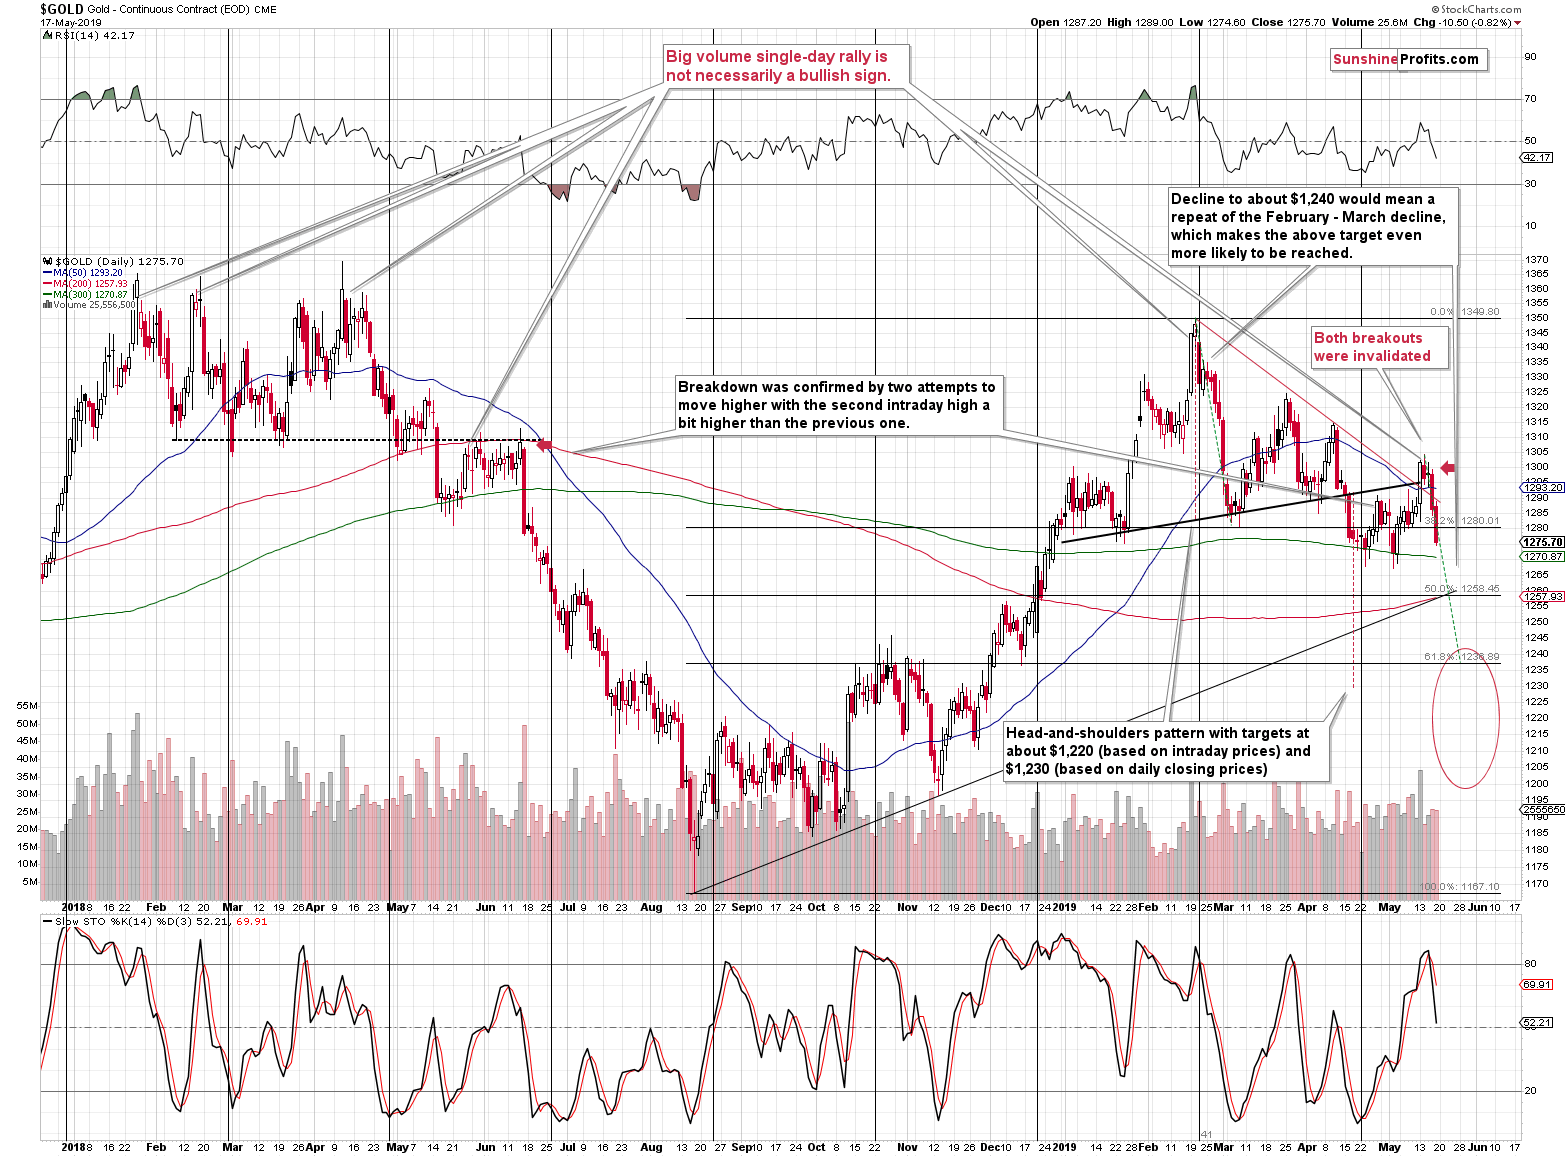
The previous week started with a geopolitical-news-based rally in gold that quickly became invalidated even though the tensions that made gold rally in the first place, didn't subside at all. Gold formed a weekly shooting star candlestick and it took place on relatively big volume. At the same time, it happened despite bullish news. This is an extremely bearish combination for the following weeks and a final warning sign that gold price is about to really slide.
As far as the short-term outlook is concerned, our previous discussion remains up-to-date as gold simply follows its likely price path:
The previously obscured view is now clear. Did the US-China trade conflict end or at least get better? Not really. What was necessary to trigger the decline? Nothing. The situation is still relatively bad and yet, gold declined nonetheless. Why? Because that's what it really wanted to do - that's the true trend that is currently in play. Instead of panicking when the markets are surprised, it proved once again to be much better to rely on long- and medium-term indications. The immediate term may be determined by the news to a varying extent, but the strength of reaction and its shelf life is a different matter entirely.
Technically, we can detect the above with the price-volume link, with the relative strength and - sometimes - with indicators and other trading techniques. In this case, we saw invalidation of a breakout and a sell signal from the Stochastic indicator. With regard to the price-volume link, we had already discussed it previously. When gold moved on Monday on huge volume, instead of chasing the market, we wrote that it's actually the way in which many other market tops formed.
Now, the new indication from the above chart is the duplication of the February - March decline. Markets quite often tend to repeat their previous moves and gold is no exception. While this - by itself - is not an indication that's strong enough to justify placing a target somewhere, it's still a great tool for confirming targets that were based on other techniques.
If we copy the February - March decline to the current situation (assuming that this week's top is the start of the next short-term wave down), then we get $1,240 as the price target. This is yet another confirmation that this level is going to trigger the next meaningful rebound. The other reasons are: similarity to the 2018 decline and its target, the similarity to the December 2012 decline, and the 61.8% Fibonacci retracement level based on the most recent medium-term rally.
Also, we adjusted the price target based on the head-and-shoulders pattern. The formation didn't change, but we added the emphasis on the target that is based on the closing prices, instead of the one based on the intraday moves. The latter is $1,220, while the former is $1,230. That's much closer to the target that we have based on other techniques.
All in all, the $1,240 target became even more likely than it was before.
Having said that, let's take a look at silver.
Silver Is on the Move
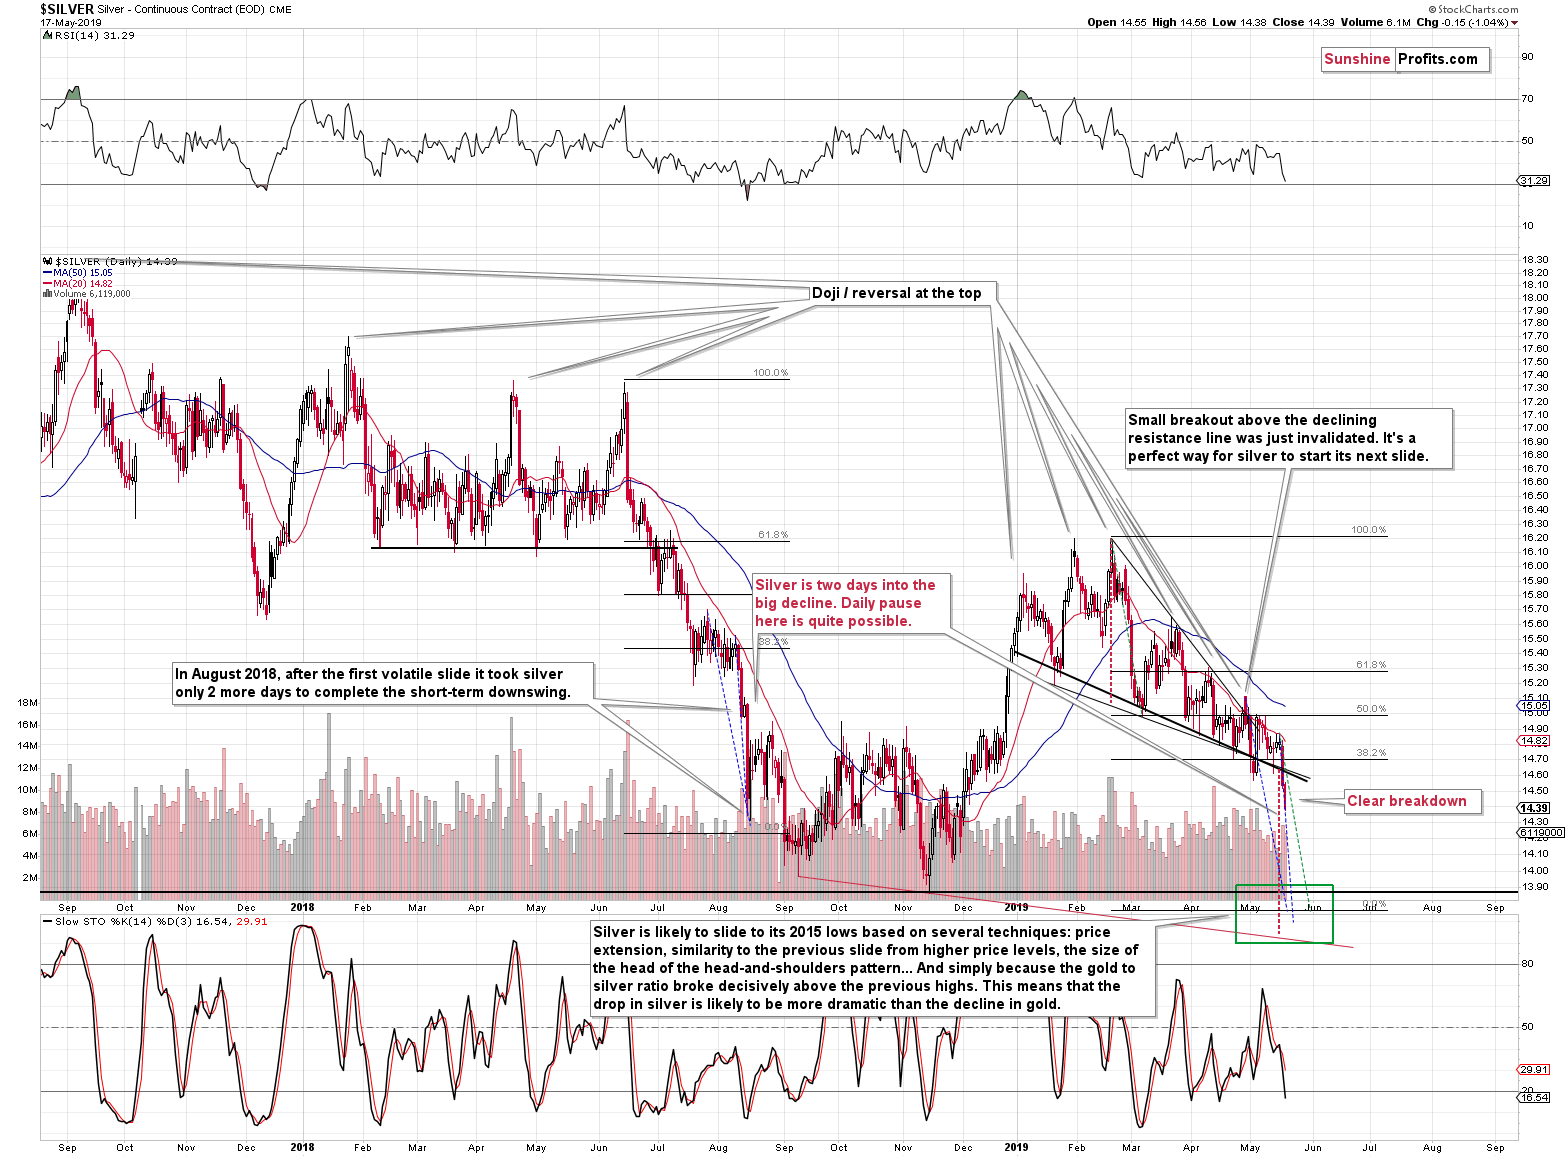
The white metal moved sharply lower and broke to new yearly lows. The sharpness of the decline is in tune with the previous downswings, so one shouldn't expect a rebound just because silver is already relatively low compared to where it was just a couple of days ago. Conversely, the size of the analogous downswing from 2018, the target based on the height of the declining wedge, below which silver just broke and the analogy to the February - March decline all suggest that the decline in silver has only begun.
Based on these techniques, silver is likely to slide below the 2018 lows before turning up once again. The 2015 lows appear to be a much better candidate for silver's temporary turnaround.
To be clear, we expect silver to decline well below its 2015 lows before the final bottom for the huge medium-term decline is in, but we don't expect it to be a straight line down, even though there will almost certainly be some dramatic short-term moves along the way.
Having said that, let's take a look at Friday's strength in the mining stocks sector. Let's start with the big picture.
Surprising Strength in the Miners?
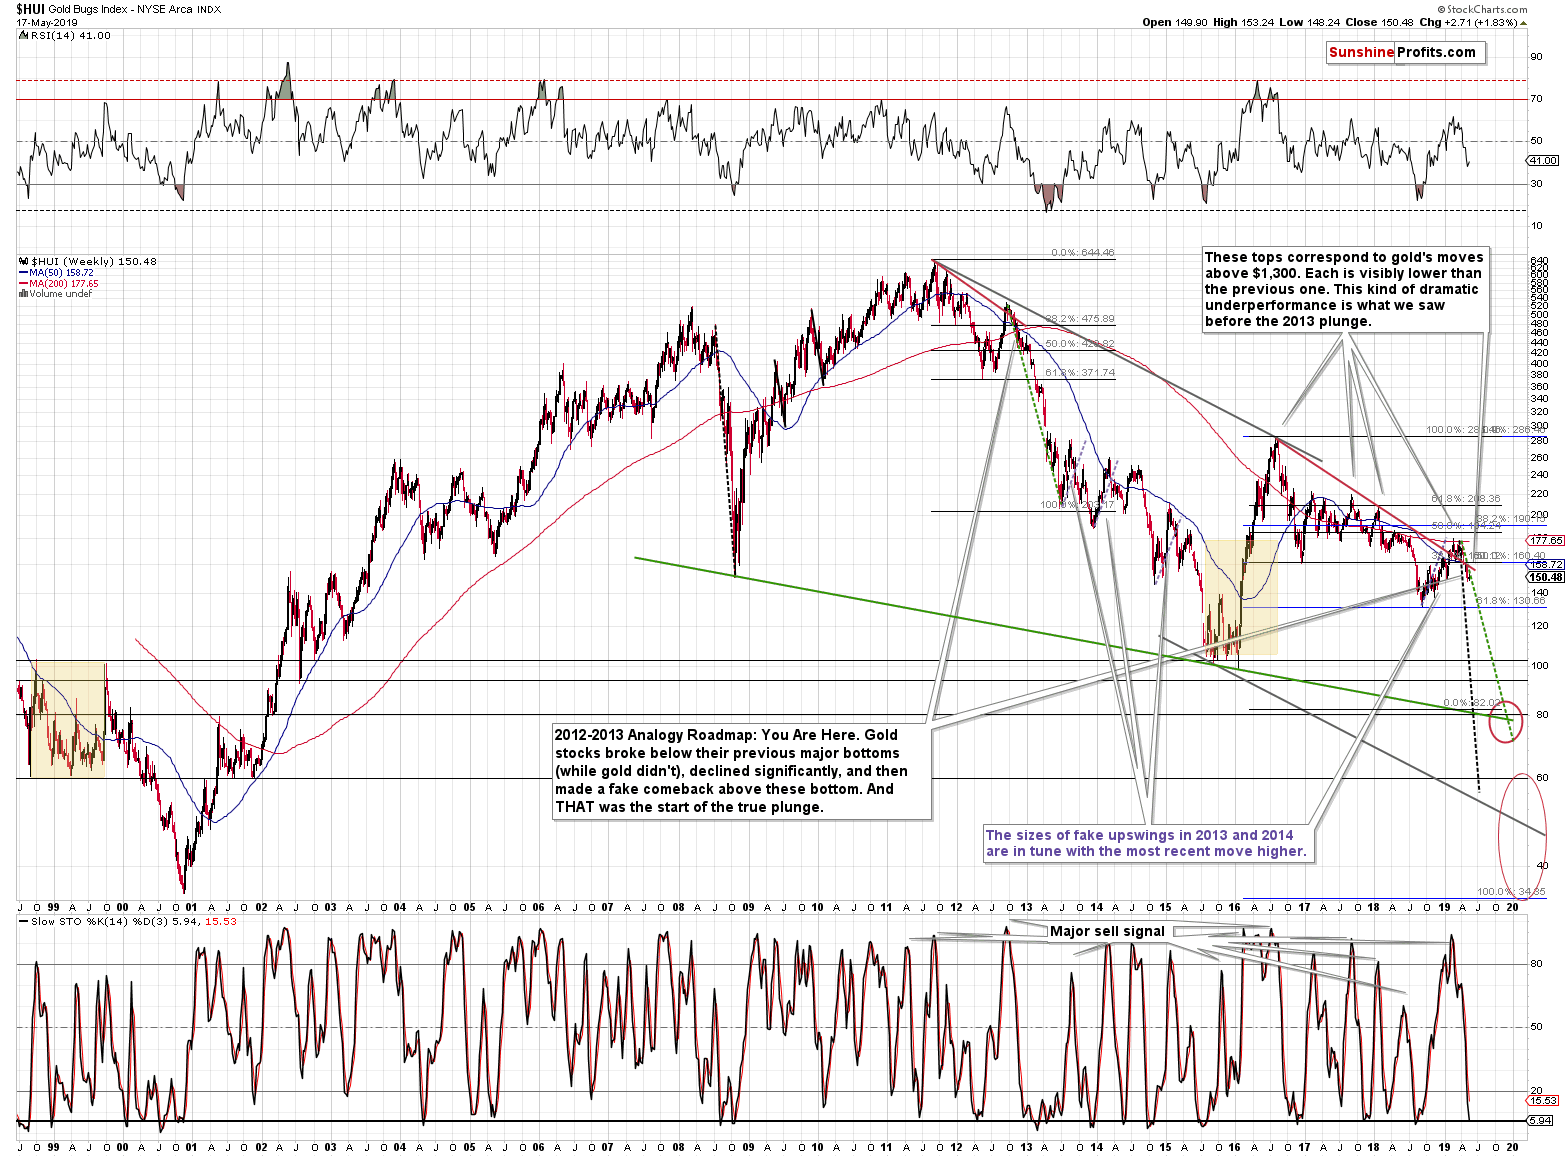
The reason for starting with it, is to show you that it's practically not visible and thus it hasn't changed anything from this point of view. The breakout above the declining red resistance line was clearly invalidated, just like the analogous breakout was invalidated in the second half of 2012. Gold stocks have been declining since that time just like they did in 2012 and 2013.
In both cases, there was some kind of pause more or less in the middle of the preceding upswing. Since the breather is already behind us, the decline is likely to continue.
Please note that the 2012-2013 decline was relatively smooth and if this continues to be the case for some time, it might be best not to use mining stocks for trading the interim upswings - should one want to do that at all. Silver and gold would be better candidates to do so in this case. At this time, it's a tough call, because the decline has only begun from the medium-term point of view, and we'll be watching and comparing it to the previous decline to estimate the level of similarity. We'll report to you - our subscribers - accordingly.
Still, let's discuss Friday's small upswing. Let's start with quoting what we wrote in Friday's Alert:
Silver declined to new 2019 lows while gold invalidated the previous small breakouts. But, does it mean that gold absolutely has to slide today? No. The initial slides were quite often followed by a daily pause (or a decline of smaller magnitude) that was then followed by the real move lower. This means that not much might happen today, and it would not invalidate anything that we wrote - it would be quite natural. In this case, we would expect to see the full-blown slide next week. Let's keep in mind that options expire today, which is a reason to expect market to hold its breath today and leave the big moves for the next week. The potential profits on this decline are enormous, and a daily pause wouldn't change it at all.
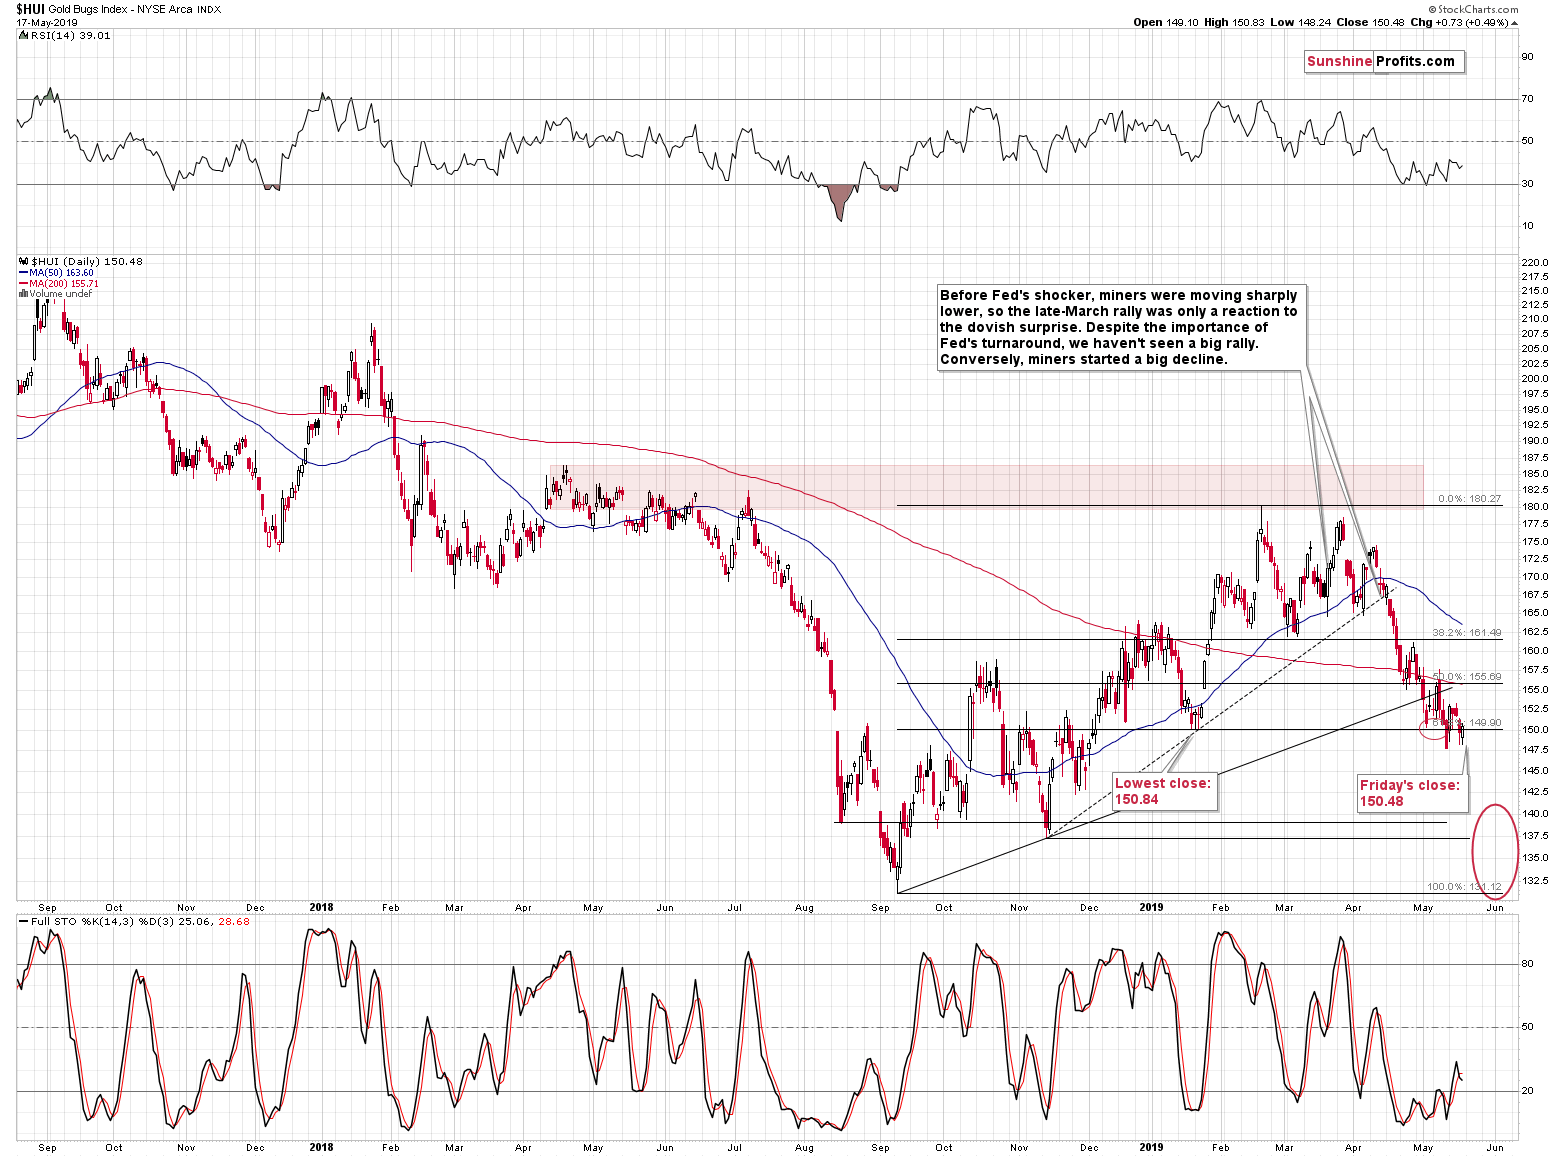
Gold didn't pause. Silver certainly didn't pause either. But mining stocks did. The options' expiration was a good reason for the miners to take a breather instead of following gold and silver lower. There are two other good reasons for it.
The second reason is that miners have been underperforming to an extreme extent in the preceding days and they simply had to correct some of this underperformance.
The third reason is that gold miners appear to have simply verified their breakdown below the January lows. The lowest closing price of January was 150.84 and the HUI Index temporarily moved to 150.83 (intraday high) on Friday, and then it closed at 150.48. It was not strength - it was verification of the breakdown that was successful. The previous attempt to break below the January lows was immediately invalidated on May 13. This time, there was no such invalidation. Even though it seems that there is little difference between May 13 and last Friday, it's actually enormous. The invalidation of the breakdown had been a bullish sign, whereas its confirmation is a clear bearish sign.
Summary
Summing up, miners "strength" seems to have been no strength at all and the outlook for the miners and the underlying precious metals remains very bearish. The ultra-low volatility in gold suggests that a very big move is just around the corner. Based on the previous low-volume periods, it's likely that it will be a move lower. Gold might reach our interim target level of $1,240 shortly and thus we might adjust our trading position also relatively soon (quite possibly this week).
To summarize:
Trading capital (supplementary part of the portfolio; our opinion): Full short position (250% of the full position) in gold, silver, and mining stocks is justified from the risk/reward perspective with the following stop-loss orders and exit profit-take price levels:
- Gold: profit-take exit price: $1,241; stop-loss: $1,357; initial target price for the DGLD ETN: $51.87; stop-loss for the DGLD ETN $39.87
- Silver: profit-take exit price: $13.81; stop-loss: $15.72; initial target price for the DSLV ETN: $39.38; stop-loss for the DSLV ETN $26.97
- Mining stocks (price levels for the GDX ETF): profit-take exit price: $17.61; stop-loss: $24.17; initial target price for the DUST ETF: $34.28; stop-loss for the DUST ETF $15.47
In case one wants to bet on junior mining stocks' prices (we do not suggest doing so - we think senior mining stocks are more predictable in the case of short-term trades - if one wants to do it anyway, we provide the details), here are the stop-loss details and target prices:
- GDXJ ETF: profit-take exit price: $24.71; stop-loss: $35.67
- JDST ETF: profit-take exit price: $78.21 stop-loss: $30.97
Long-term capital (core part of the portfolio; our opinion): No positions (in other words: cash)
Insurance capital (core part of the portfolio; our opinion): Full position
Whether you already subscribed or not, we encourage you to find out how to make the most of our alerts and read our replies to the most common alert-and-gold-trading-related-questions.
Please note that the in the trading section we describe the situation for the day that the alert is posted. In other words, it we are writing about a speculative position, it means that it is up-to-date on the day it was posted. We are also featuring the initial target prices, so that you can decide whether keeping a position on a given day is something that is in tune with your approach (some moves are too small for medium-term traders and some might appear too big for day-traders).
Plus, you might want to read why our stop-loss orders are usually relatively far from the current price.
Please note that a full position doesn't mean using all of the capital for a given trade. You will find details on our thoughts on gold portfolio structuring in the Key Insights section on our website.
As a reminder - "initial target price" means exactly that - an "initial" one, it's not a price level at which we suggest closing positions. If this becomes the case (like it did in the previous trade) we will refer to these levels as levels of exit orders (exactly as we've done previously). Stop-loss levels, however, are naturally not "initial", but something that, in our opinion, might be entered as an order.
Since it is impossible to synchronize target prices and stop-loss levels for all the ETFs and ETNs with the main markets that we provide these levels for (gold, silver and mining stocks - the GDX ETF), the stop-loss levels and target prices for other ETNs and ETF (among other: UGLD, DGLD, USLV, DSLV, NUGT, DUST, JNUG, JDST) are provided as supplementary, and not as "final". This means that if a stop-loss or a target level is reached for any of the "additional instruments" (DGLD for instance), but not for the "main instrument" (gold in this case), we will view positions in both gold and DGLD as still open and the stop-loss for DGLD would have to be moved lower. On the other hand, if gold moves to a stop-loss level but DGLD doesn't, then we will view both positions (in gold and DGLD) as closed. In other words, since it's not possible to be 100% certain that each related instrument moves to a given level when the underlying instrument does, we can't provide levels that would be binding. The levels that we do provide are our best estimate of the levels that will correspond to the levels in the underlying assets, but it will be the underlying assets that one will need to focus on regarding the signs pointing to closing a given position or keeping it open. We might adjust the levels in the "additional instruments" without adjusting the levels in the "main instruments", which will simply mean that we have improved our estimation of these levels, not that we changed our outlook on the markets. We are already working on a tool that would update these levels on a daily basis for the most popular ETFs, ETNs and individual mining stocks.
Our preferred ways to invest in and to trade gold along with the reasoning can be found in the how to buy gold section. Additionally, our preferred ETFs and ETNs can be found in our Gold & Silver ETF Ranking.
As a reminder, Gold & Silver Trading Alerts are posted before or on each trading day (we usually post them before the opening bell, but we don't promise doing that each day). If there's anything urgent, we will send you an additional small alert before posting the main one.
=====
Latest Free Trading Alerts:
Stocks retraced some of their short-term rebound on Friday, as investors' sentiment worsened once again. The S&P 500 index bounced off the nearest important resistance level of around 2,890-2,900. Will stocks resume their downtrend?
Trade War Fears Again, Will Stocks Resume the Downtrend?
=====
Thank you.
Sincerely,
Przemyslaw Radomski, CFA
Editor-in-chief, Gold & Silver Fund Manager

