

Briefly: in our opinion, full (300% of the regular position size) speculative short positions in mining stocks are justified from the risk/reward point of view at the moment of publishing this Alert.
During yesterday’s (May 20) session, we saw more or less the repeat of the previous day’s indications – gold stocks reversed once again, and gold is trading where it was trading two days ago. Silver is already trading lower. Consequently, much of my previous comments remain up-to-date.
On Wednesday, gold miners reversed in a classically bearish way, and yesterday’s low-volume session (also a reversal) looks like Wednesday’s reversal’s shadow.
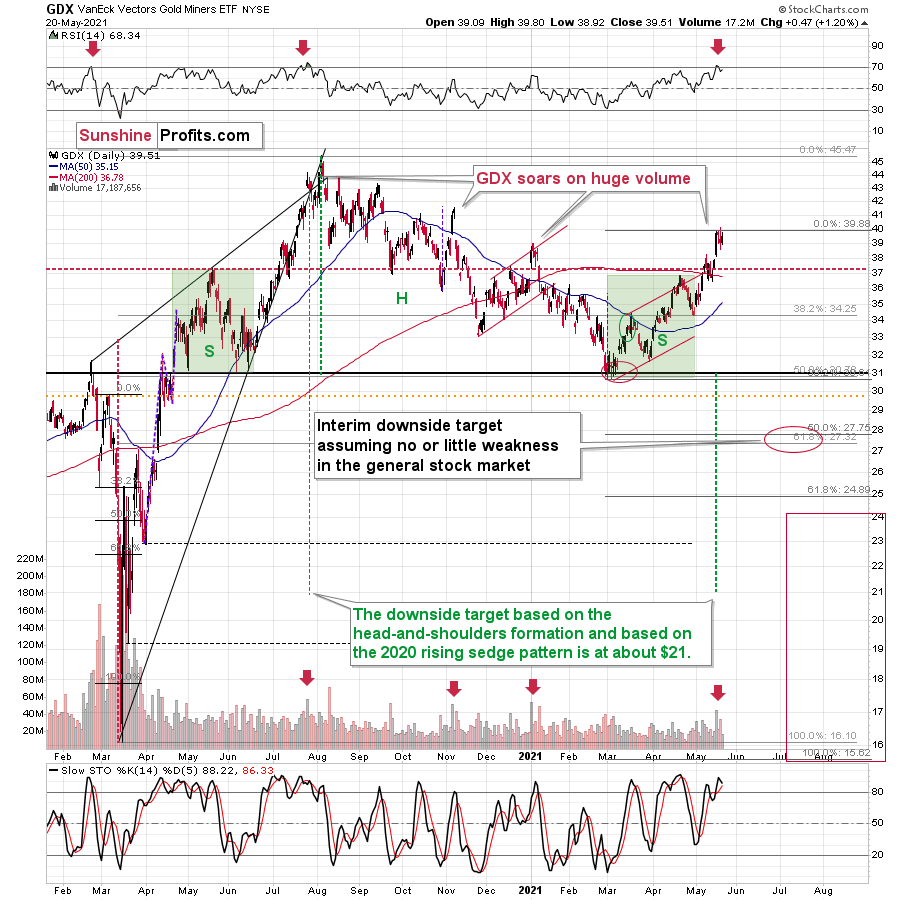
The GDX ETF first tried to rally to new highs, then it failed to hold them. Wednesday’s reversal took place on big volume (important bearish confirmation), and the “shadow reversal” took place on relatively low volume. The low volume doesn’t confirm the reversal, but it more or less invalidates the seemingly bullish fact that miners closed yesterday’s session higher.
Moreover, please note that the volume was similarly low to what we saw on January 7, 2021, when the 4-day top was ending. Yesterday was the fourth day of what appears to be a broad top.
Let’s also keep in mind that the RSI indicator just moved back below 70 after being above it. This happens rarely, and when it happened previously (in the past 1.5 years), it meant that a huge price decline was about to follow.
Silver reversed in a different manner.
The white metal didn’t move to new highs yesterday. Conversely, it moved lower, and then it only recovered intraday decline without moving visibly higher (silver futures ended the day only $0.04 higher). The true reversal happened on Tuesday – and what we saw yesterday and on Wednesday was just its consequence. It’s quite often the case that the tops and bottoms in the precious metals market take place more or less (!) simultaneously, but not necessarily exactly on the same day. Consequently, what we saw this week is quite normal.
Gold didn’t manage to move to new intraday highs yesterday – however, it didn’t decline visibly either.
It moved a bit lower in today’s pre-market trading, and overall, it’s just $8 higher than it was at the end of Tuesday’s session. This might seem positive given that gold managed to move slightly above its declining medium-term resistance lines. However, given what’s happening in the mining stocks and all the signals from them, I doubt this breakout will really hold.
Here’s another reason: the Fed is attempting to control the long-term rates, and we just saw a short-term exodus from the cryptocurrency market. Theoretically, capital should be flowing into gold as a safe-haven / inflation-hedge asset, and it should be soaring. But it’s not. It did move higher recently, but compared to what “should have” happened given the importance of the above-mentioned developments, the reaction is barely noticeable.
Instead, gold seems to be insisting on repeating – to some extent – its 2012 performance, and – to some extent – its 2008 performance. Either way, it seems that gold is about to slide.
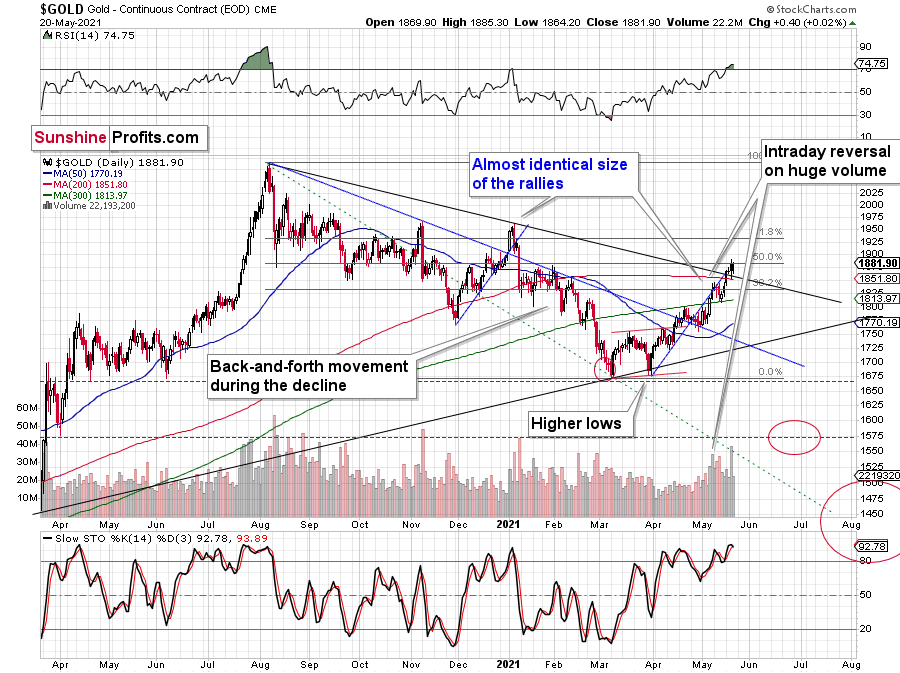
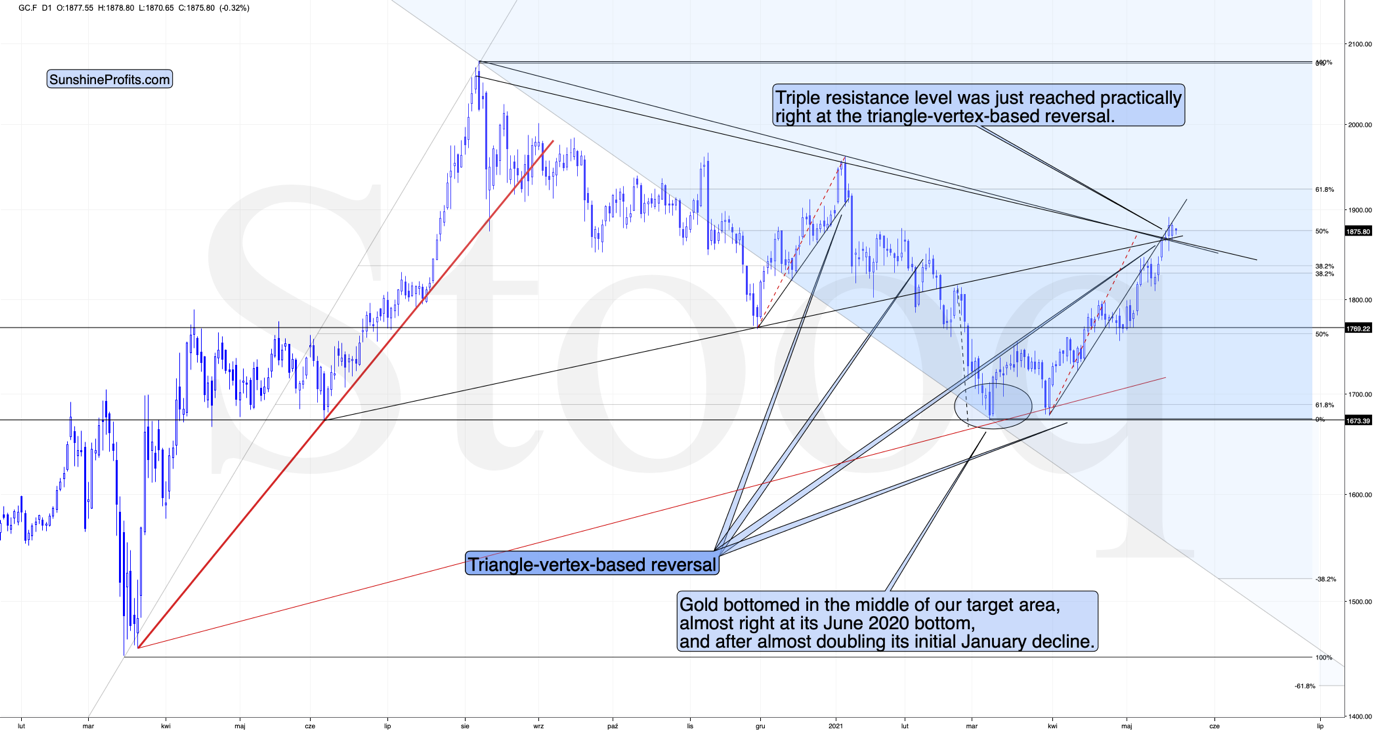
The reversal in gold took place after gold moved very close to its mid-January highs and the 50% Fibonacci retracement based on the August 2020 – March 2021 decline.
The sizes of the current rally (taking the second March bottom as the starting point) and the rally that ended at the beginning of this year are practically identical at the moment.
Just as the rallies from early 2012 and late 2012 (marked with blue) were almost identical, the same could happen now.
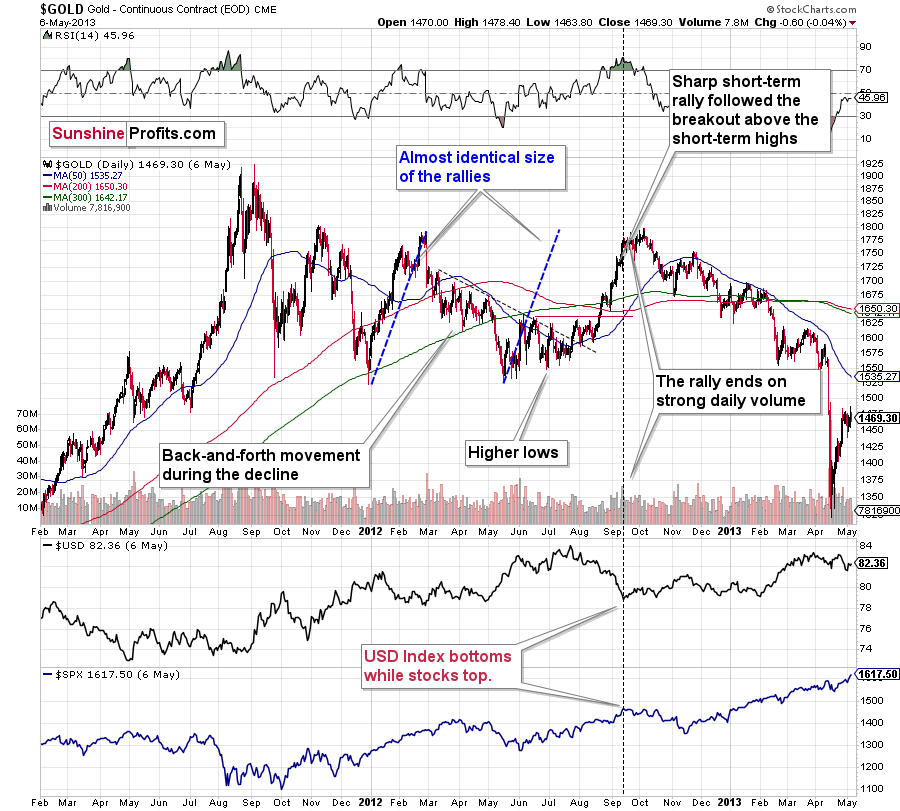
The March 2021 low formed well below the previous low, but as far as other things are concerned, the current situation is similar to what happened in 2012.
The relatively broad bottom with higher lows is what preceded both final short-term rallies – the current one, and the 2012 one. Their shape as well as the shape of the decline that preceded these broad bottoms is very similar. In both cases, the preceding decline had some back-and-forth trading in its middle, and the final rally picked up pace after breaking above the initial short-term high.
Interestingly, the 2012 rally ended in huge volume, which is exactly what we saw also on May 19 this year.
What is even more interesting is that back in 2013 gold started its gargantuan (…) slide from about $1,800 and it is not far (from the long-term point of view) from this level also today.
Moreover, let’s keep in mind that the RSI indicator just topped slightly above 70, which is what tends to happen when gold tops. The upside seems very limited. In fact, it seems that the top in gold might already be in.
The lower part of the above chart shows how the USD Index and the general stock market performed when gold ended its late-2012 rally and was starting its epic decline. In short, that was when the USD Index bottomed, and when the general stock market topped. Let’s take a closer look at the short-term developments on the stock market.
Stock Market
In short, the situation doesn’t look pretty. To explain, I wrote the following on May 11:
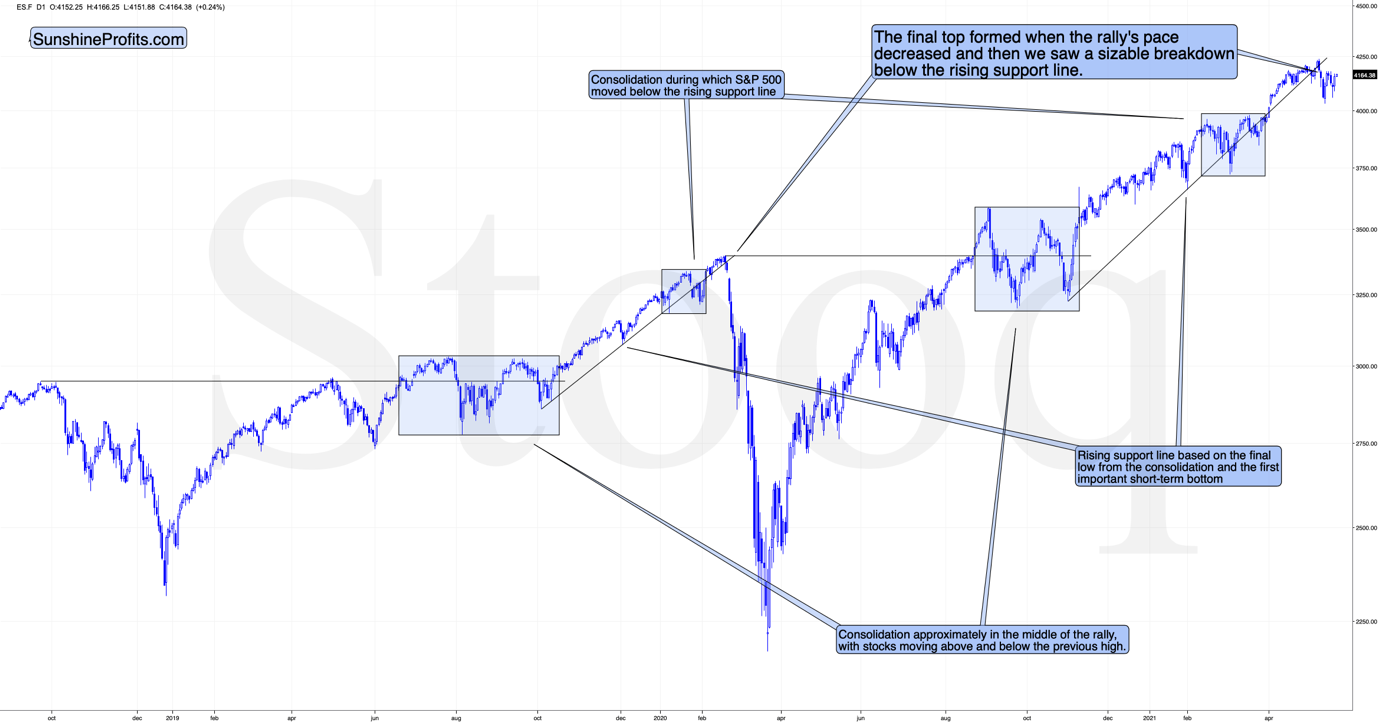
The markets are self-similar (which is another way of saying that they have a fractal nature), which generally means that while the history tends to rhyme, it also tends to rhyme in similar shapes of alike or various sizes.
For example, the rally from 2018–2020 seems very similar to the rally from 2020 to the present. Both rallies started after a sharp decline, and the first notable correction took the form of back-and-forth trading around the previous high. I marked those situations with big rectangles.
Then the rally continued with relatively small week-to-week volatility. I created rising support lines based on the final low of the broad short-term consolidation and the first notable short-term bottom.
This line was broken, and some back-and-forth trading followed, but it was only about half of the previous correction in terms of price and time.
Then, we saw a sharp rally that then leveled off. And that was the top. The thing that confirmed the top was the visible breakdown below the rising support line right after stocks invalidated a tiny breakout to new highs. That’s what happened in February 2020, and that’s what happened this month.
“Time is more important than price; when the time comes, the price will reverse”. Both rallies took an almost identical amount of time: 60 weeks vs. 59 weeks.
Stocks moved a bit higher recently, but the most important thing with regard to the above chart is what’s not on it. There was no invalidation of the breakdown below the rising support line, and that’s what makes this move lower special. This is the first time when the S&P 500 was unable to get back above its rising support line after temporarily breaking below it. It seems that the initial slide was not just another correction in the bull market.
This is bearish for gold, silver, and mining stocks – in particular for the last two.
The USD Index
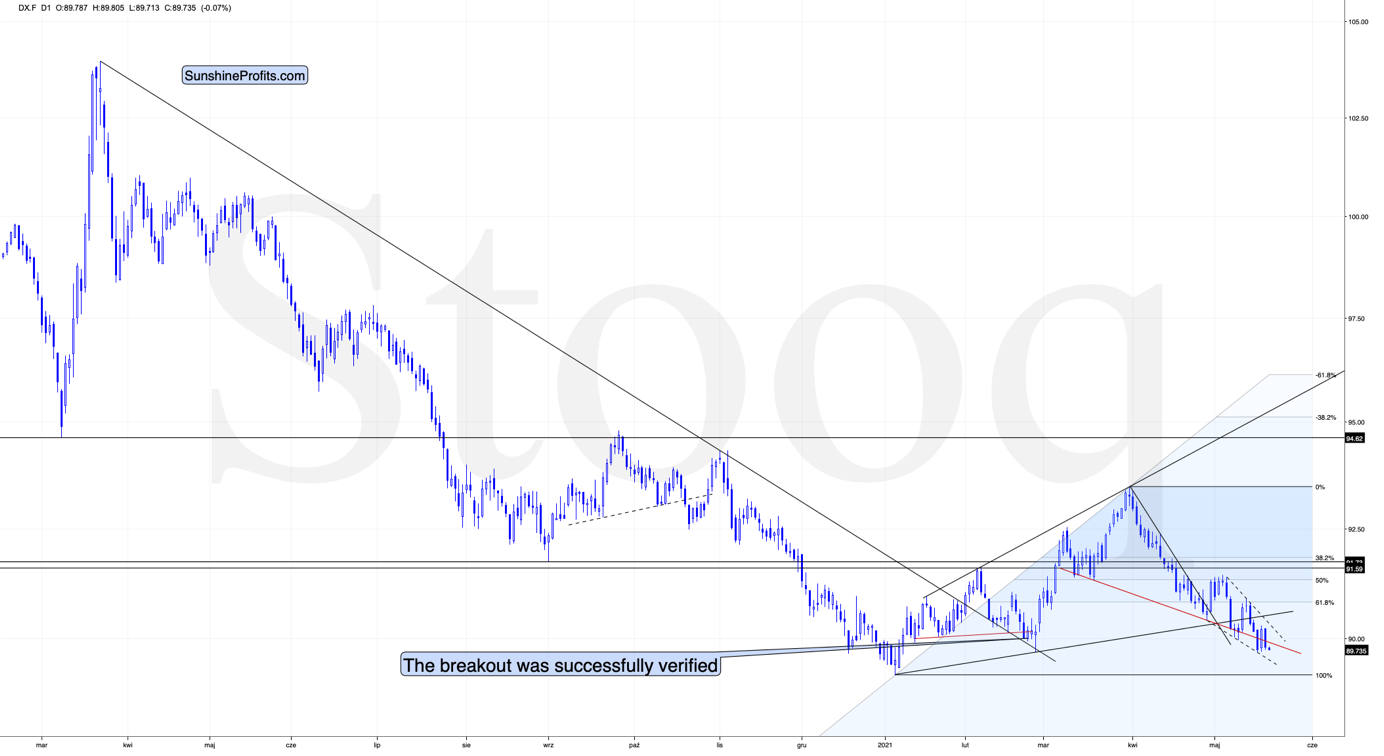
As you can see in the above chart, the USD Index rallied after reaching its horizontal support provided by the previous important low – the low that was formed after a fake breakdown below the neck level of a supposedly bearish head-and-shoulders pattern. And then it declined once again, testing the previous lows. The USDX is not only at similar price levels; it’s also right after yet another supposedly bearish breakdown.
Is the back-and-forth movement discouraging? Not necessarily – that’s exactly how the USD Index bottomed at the beginning of the year. The bottom in late February was not that different either.
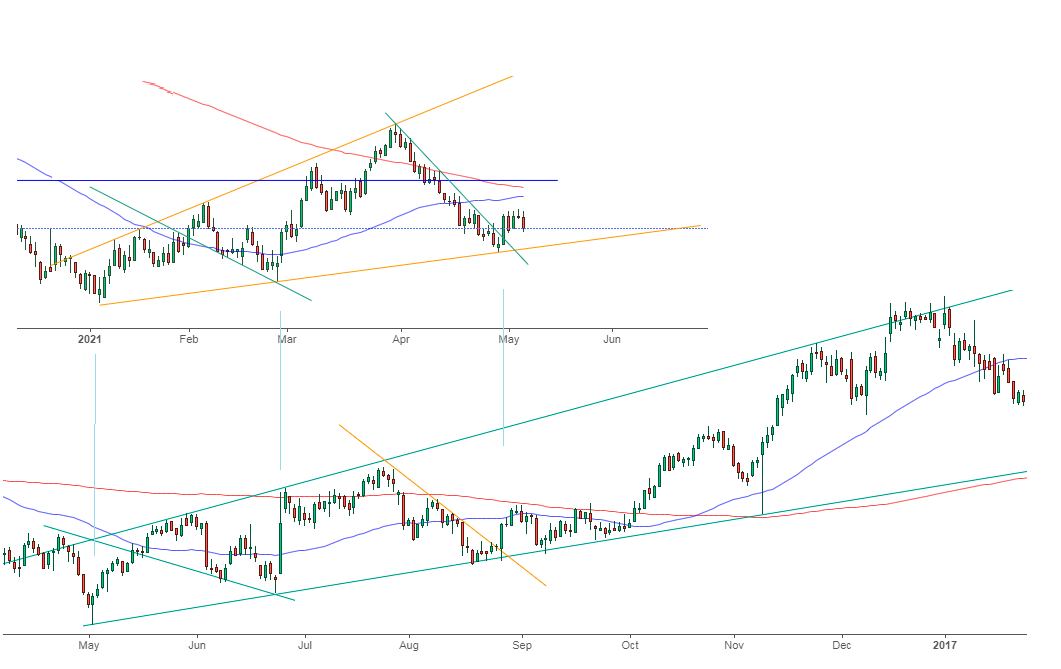
So, it seems like the USD Index is ready to move higher, just as in 2016.
Having said that, let’s take a look at the markets from a more fundamental point of view.
Coming in Hot
Jerome Powell, Chairman of the U.S. Federal Reserve (FED), reassured investors in June 2020 that “we’re not even thinking about thinking about raising rates." But now, suddenly, the thought may have crossed his mind. With inflation surging and the latest FOMC minutes revealing that “a number of participants” believe that “it might be appropriate at some point in upcoming meetings to begin discussing a plan for adjusting the pace of asset purchases," the weather won’t be the only thing heating up this summer.
On May 18, I noted that the real (inflation-adjusted) federal funds rate has recorded its third-lowest reading ever.
I wrote:
The real federal funds rate is plunging toward an all-time low. For context, the federal funds rate is the overnight lending rate set by the FOMC, while the real federal funds rate is adjusted for inflation by using the Consumer Price Index (CPI).
Please see below:
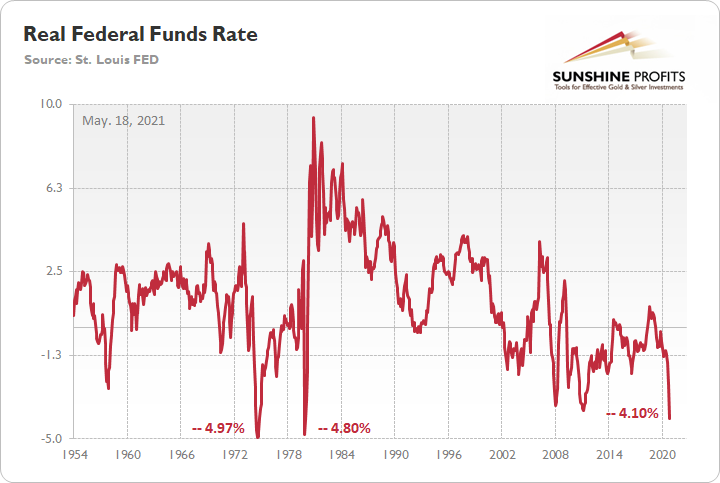
If you analyze the middle of the chart, you can see that the all-time low for the real federal funds rate is -4.97%. And if you move to the right side of the chart, you can see that the current reading is -4.10%. More importantly, though, notice how abnormally low readings often result in sharp moves higher once a reversal occurs? And with inflation showing no signs of slowing down, the ball is currently in the FED’s court.
To that point, with a summertime sizzle likely to push the Consumer Price Index (CPI) even higher, -4.97% may not hold up for much longer. Case in point: the Philadelphia FED released its Manufacturing Business Outlook Survey on May 20. The consolidated index decreased by 19 points to 31.5 – and also came in below the consensus estimate of 43.0 – notice a recurring theme?
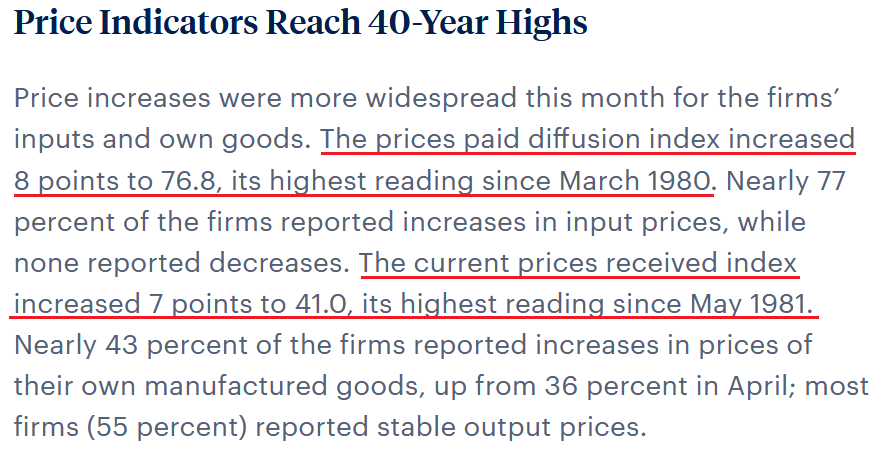 Source: Philadelphia FED
On top of that, when respondents were asked to forecast their price expectations over the next four quarters, the results were:
- “Regarding their own prices, the firms’ median forecast was for an increase of 5.0 percent, an increase from 3.0 percent when the question was last asked in February.
- The firms expect their employee compensation costs (wages plus benefits on a per-employee basis) to rise 4.0 percent over the next four quarters, an increase from 3.0 percent in the previous quarter.
- When asked about the rate of inflation for U.S. consumers over the next year, the firms’ median forecast was 4.0 percent, an increase from 3.0 percent in the previous quarter.”
The bottom line?
With cost-push inflation surging and manufacturers in Philadelphia expecting the momentum to continue “over the next four quarters,” Powell’s promise of “transitory” inflation contradicts the mood music on the ground. What’s more, with the Philadelphia FED’s prices paid index demonstrating a strong correlation with the headline CPI (which includes the inflationary effects of food and energy), the FED’s Jun. 15/16 policy meeting could be rather interesting.
Please see below:
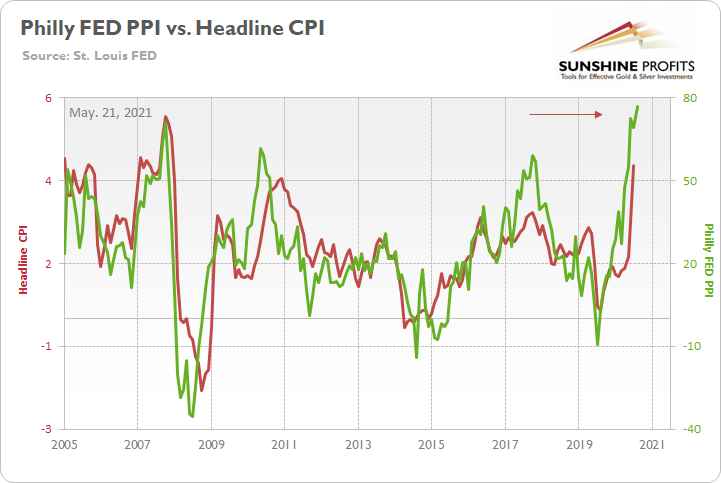
To explain, the green line above tracks the Philadelphia FED’s prices paid index, while the red line above tracks the headline CPI. If you analyze the right side of the chart, you can see that the former has run away from the latter. Moreover, if May’s Manufacturing Business Outlook Survey proves prescient, a reconnect with the green line implies a headline CPI of roughly 5.75%.
As further evidence, with cost-push inflation a function of speculation in the commodities market, investors’ appetite for raw materials is mirroring 2011.
Please see below:
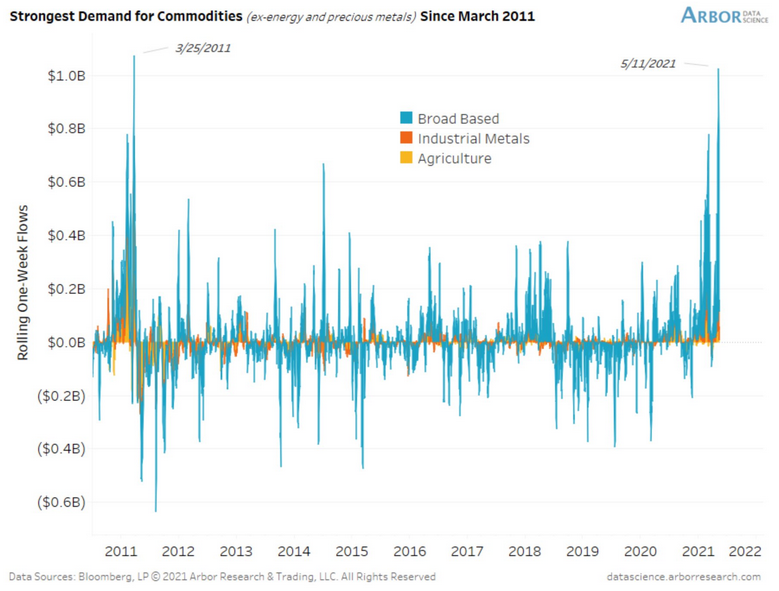
To explain, the blue bars above represent the rolling one-week fund flows into broad-based commodity ETFs (excluding energy and precious metals). If you analyze the right side of the chart, you can see that massive spikes have occurred in recent weeks. And with fund managers responding by purchasing spot commodities and/or increasing their exposure to futures contracts, investors’ heavy hands continue to increase businesses’ cost pressures.
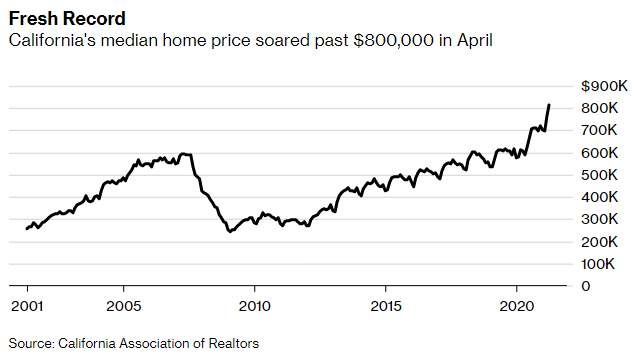
Home Prices’ Impact
If that wasn’t enough, the U.S. housing market remains on high alert. With the median home price in California surging above $800,000 for the first time ever (released on May 17), California Association of Realtors (C.A.R.) President Dave Walsh said that "the high demand and shortage of homes for sale, driven by these market factors, continued to drive up home prices and shatter the record-high set just last month."
Please see below:
Moreover, with the Bank of Canada (BOC) releasing its Financial System Review (FSR) on May 20, BOC Governor Tiff Macklem said that “It is important to understand that the recent rapid increases in home prices are not normal. Counting on even higher house prices to build home equity that can be used to refinance mortgages in the future is a bad idea.”
However, in a classic case of ‘do as I say, not as I do,’ like Powell, Macklem’s obsession with easy monetary policy continues to fuel the bubble. And while the BOC has already scaled back its asset purchases – which the FED is slowly realizing is a necessary evil – and Canada’s financial regulator has also tightened mortgage-lending standards, the BOC and the FED are two peas in a pod. Case in point: with rampant speculation pushing the share of Canadian mortgages with a loan-to-income (LTI) ratio above 450% to their highest level ever, has everyone forgotten about 2008?
Please see below:
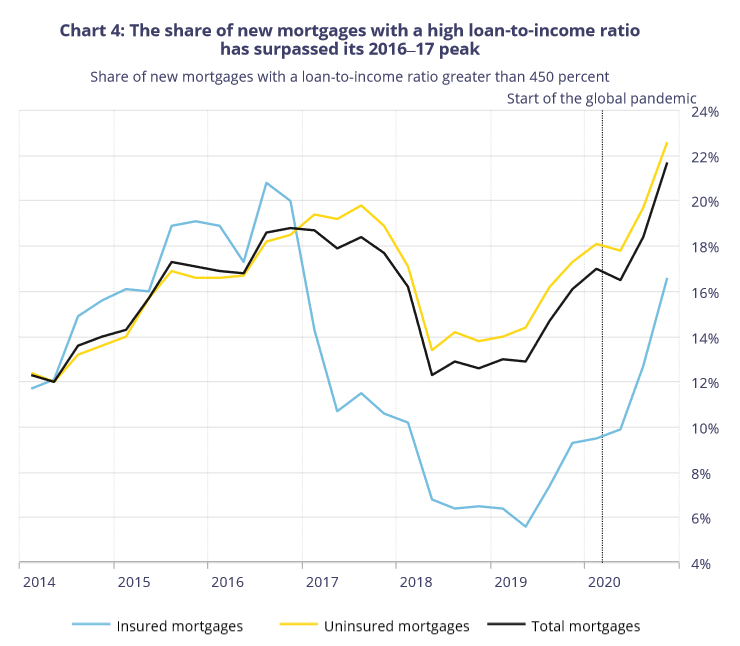 Source: BOC
But why is all of this so important?
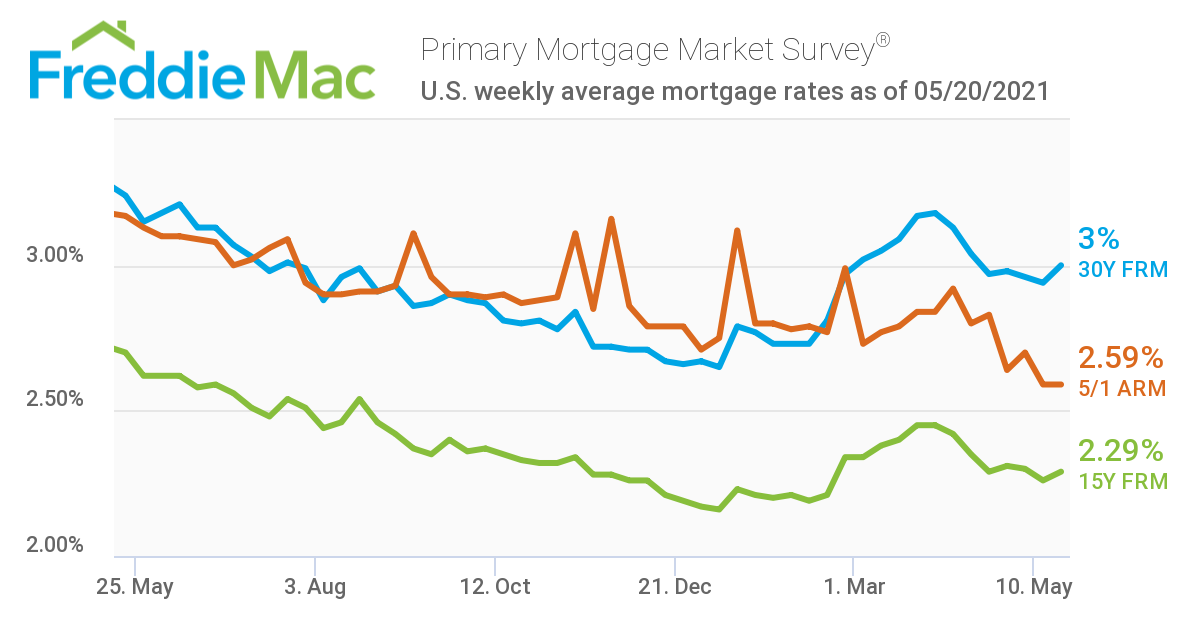
Well, because raising interest rates is the only way for the central banks to cool their sizzling housing markets before they spiral out of control. If not, the commercial banks that underwrite these loans will likely increase their mortgage rates to avoid being left holding the bag during the next downturn (like in 2008). To that point, the average U.S. 30-year fixed-rate mortgage (FRM) increased by six basis points over the last week and is now back at 3%.
Please see below:
More importantly, though, with gold moving inversely of the average 30-year FRM, another move higher could spell trouble for the yellow metal.
Please see below:
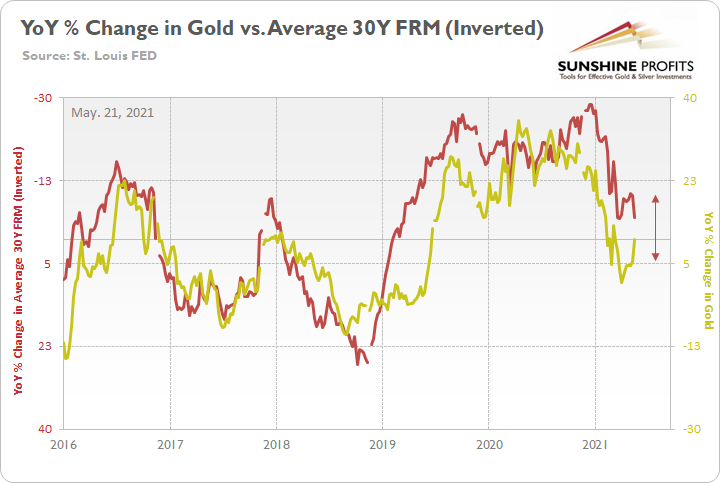
To explain, the gold line above tracks the year-over-year (YoY) percentage change in the London Bullion Market Association (LBMA) Gold Price, while the red line above tracks the inverted YoY percentage change in the average 30-year FRM. For context, inverted means that the latter’s scale is flipped upside down and that a rising red line represents a falling average 30-year FRM, while a falling red line represents a rising average 30-year FRM.
If you analyze the relationship, you can see that the two have a strong negative correlation. Moreover, if you focus your attention on the right side of the chart, you can see that gold is attempting to buck the trend. Despite the average 30-year FRM moving higher this week, gold hasn’t acknowledged the reality. However, if history is any indication, the yellow metal could be playing catch up in the coming weeks.
In conclusion, the PMs remained buoyant on May 20, but their medium-term outlook is extremely treacherous. With inflation surging and the temperature poised to heat up over the next few months, the FED will likely have to scale back its asset purchases. And with the PMs extremely allergic to reduced liquidity, the move is unlikely to elicit any applause. Moreover, with volatility rising across global stock markets and the USD Index poised to pounce over the medium term, the double-edged sword should only enhance the forthcoming destruction. Thus, while chasing higher prices may seem like an effective strategy, in time, the prospect will likely prove otherwise.
Overview of the Upcoming Part of the Decline
- It seems likely to me that the current corrective upswing is very close to being over, given gold’s similarity to what happened in 2012, USD’s similarity to 2016 and the situation in the general stock market.
- After miners slide once again in a meaningful and volatile way, but silver doesn’t (and it just declines moderately), I plan to switch from short positions in miners to short positions in silver (this could take another 1-2 weeks to materialize). I plan to exit those short positions when gold shows substantial strength relative to the USD Index, while the latter is still rallying. This might take place with gold close to $1,450 - $1,500 and the entire decline (from above $1,700 to about $1,475) would be likely to take place within 1-12 weeks, and I would expect silver to fall hardest in the final part of the move. This moment (when gold performs very strongly against the rallying USD and miners are strong relative to gold – after gold has already declined substantially) is likely to be the best entry point for long-term investments, in my view. This might happen with gold close to $1,475, but it’s too early to say with certainty at this time. In other words, the entire decline could take between 1 and 12 weeks, with silver declines occurring particularly fast in the final 1-2 weeks.
- If gold declines even below $1,500 (say, to ~$1350 or so), then it could take another 10 weeks or so for it to bottom, but this is not what I view as a very likely outcome.
- As a confirmation for the above, I will use the (upcoming or perhaps we have already seen it?) top in the general stock market as the starting point for the three-month countdown. The reason is that after the 1929 top, gold miners declined for about three months after the general stock market started to slide. We also saw some confirmations of this theory based on the analogy to 2008. All in all, the precious metals sector would be likely to bottom about three months after the general stock market tops. If the general stock market puts the final top in the first half of May (which seems quite likely given NASDAQ’s top in late April), then we might expect the precious metals sector to bottom sometime in August.
- The above is based on the information available today, and it might change in the following days/weeks.
Please note that the above timing details are relatively broad and “for general overview only” – so that you know more or less what I think and how volatile I think the moves are likely to be – on an approximate basis. These time targets are not binding or clear enough for me to think that they should be used for purchasing options, warrants or similar instruments.
Summary
To summarize, even though it doesn’t seem to be the case based on this month’s price change in gold, it seems that the yellow metal’s days are numbered. This is based not only on the excessively oversold USD Index and its 2016 self-similar pattern but also on what’s happening in the stock market, silver’s recent outperformance and price levels reached throughout the precious metals sector. From the long-term point of view, the current situation seems similar to what we saw in the second half of 2012, while from the short-term point of view it seems similar to what we saw at the beginning of 2021. While the very near term remains unclear (today’s pre-market reversal might have been the final top, but there’s no certainty there), the outlook for the next several months remains very bearish.
After the sell-off (that takes gold to about $1,350 - $1,500), we expect the precious metals to rally significantly. The final part of the decline might take as little as 1-5 weeks, so it's important to stay alert to any changes.
Most importantly, please stay healthy and safe. We made a lot of money last March and this March, and it seems that we’re about to make much more on the upcoming decline, but you have to be healthy to enjoy the results.
As always, we'll keep you - our subscribers - informed.
To summarize:
Trading capital (supplementary part of the portfolio; our opinion): Full speculative short positions (300% of the full position) in mining stocks are justified from the risk to reward point of view with the following binding exit profit-take price levels:
Mining stocks (price levels for the GDXJ ETF): binding profit-take exit price: $24.12; stop-loss: none (the volatility is too big to justify a stop-loss order in case of this particular trade)
Alternatively, if one seeks leverage, we’re providing the binding profit-take levels for the JDST (2x leveraged) and GDXD (3x leveraged – which is not suggested for most traders/investors due to the significant leverage). The binding profit-take level for the JDST: $39.87; stop-loss for the JDST: none (the volatility is too big to justify a SL order in case of this particular trade); binding profit-take level for the GDXD: $94.87; stop-loss for the GDXD: none (the volatility is too big to justify a SL order in case of this particular trade).
For-your-information targets (our opinion; we continue to think that mining stocks are the preferred way of taking advantage of the upcoming price move, but if for whatever reason one wants / has to use silver or gold for this trade, we are providing the details anyway.):
Silver futures upside profit-take exit price: unclear at this time - initially, it might be a good idea to exit, when gold moves to $1,512.
Gold futures upside profit-take exit price: $1,512.
Long-term capital (core part of the portfolio; our opinion): No positions (in other words: cash
Insurance capital (core part of the portfolio; our opinion): Full position
Whether you already subscribed or not, we encourage you to find out how to make the most of our alerts and read our replies to the most common alert-and-gold-trading-related-questions.
Please note that we describe the situation for the day that the alert is posted in the trading section. In other words, if we are writing about a speculative position, it means that it is up-to-date on the day it was posted. We are also featuring the initial target prices to decide whether keeping a position on a given day is in tune with your approach (some moves are too small for medium-term traders, and some might appear too big for day-traders).
Additionally, you might want to read why our stop-loss orders are usually relatively far from the current price.
Please note that a full position doesn't mean using all of the capital for a given trade. You will find details on our thoughts on gold portfolio structuring in the Key Insights section on our website.
As a reminder - "initial target price" means exactly that - an "initial" one. It's not a price level at which we suggest closing positions. If this becomes the case (like it did in the previous trade), we will refer to these levels as levels of exit orders (exactly as we've done previously). Stop-loss levels, however, are naturally not "initial", but something that, in our opinion, might be entered as an order.
Since it is impossible to synchronize target prices and stop-loss levels for all the ETFs and ETNs with the main markets that we provide these levels for (gold, silver and mining stocks - the GDX ETF), the stop-loss levels and target prices for other ETNs and ETF (among other: UGL, GLL, AGQ, ZSL, NUGT, DUST, JNUG, JDST) are provided as supplementary, and not as "final". This means that if a stop-loss or a target level is reached for any of the "additional instruments" (GLL for instance), but not for the "main instrument" (gold in this case), we will view positions in both gold and GLL as still open and the stop-loss for GLL would have to be moved lower. On the other hand, if gold moves to a stop-loss level but GLL doesn't, then we will view both positions (in gold and GLL) as closed. In other words, since it's not possible to be 100% certain that each related instrument moves to a given level when the underlying instrument does, we can't provide levels that would be binding. The levels that we do provide are our best estimate of the levels that will correspond to the levels in the underlying assets, but it will be the underlying assets that one will need to focus on regarding the signs pointing to closing a given position or keeping it open. We might adjust the levels in the "additional instruments" without adjusting the levels in the "main instruments", which will simply mean that we have improved our estimation of these levels, not that we changed our outlook on the markets. We are already working on a tool that would update these levels daily for the most popular ETFs, ETNs and individual mining stocks.
Our preferred ways to invest in and to trade gold along with the reasoning can be found in the how to buy gold section. Furthermore, our preferred ETFs and ETNs can be found in our Gold & Silver ETF Ranking.
As a reminder, Gold & Silver Trading Alerts are posted before or on each trading day (we usually post them before the opening bell, but we don't promise doing that each day). If there's anything urgent, we will send you an additional small alert before posting the main one.
Thank you.
Przemyslaw Radomski, CFA
Founder, Editor-in-chief

