

Briefly: in our opinion, full (300% of the regular position size) speculative short positions in junior mining stocks are justified from the risk/reward point of view at the moment of publishing this Alert.
The precious metals sector rallied yesterday, but it didn’t change the short-term downtrend. It seems that the markets got scared of the consequences of QE in the U.K., as there was significant safe-haven buying. However, it’s unlikely that this will affect even the short-term trend.
In short, I don’t think that the GDXJ will rally above $30 before plunging, and it could be the case that the top is already in.
For more technical details, I recorded a video (yes, I’m back on the video front after a long break!) and I hope you like it.
For more fundamental details, I invite you to read more below.
Panic in Britain
With the Bank of England (BoE) resuming QE due to a “material risk to U.K. financial stability,” overleveraged pension funds and margin calls forced the BoE’s hand. Moreover, with the post-GFC crowd following their familiar script, the bulls piled into risk assets, sending gold, silver, mining stocks and the S&P 500 higher.
Conversely, the USD Index and U.S. nominal and real yields were major casualties, as actions in one market often send ripples across others.
Yet, the price action on Sep. 28 was another instance of short-term sentiment overpowering medium-term fundamentals. For example, with British pension funds implementing leveraged strategies to enhance their returns, some were caught flat-footed when bond prices tumbled amid the surge in global interest rates.
In addition, with these institutions suffering heavy losses and their brokers demanding collateral, the funds opted to sell their U.K. bonds rather than post more cash. However, with buyers nowhere to be found, further selling would have resulted in even lower bond prices, more margin calls, and a continuation of the vicious circle. Therefore, the BoE stepped in to provide liquidity amid the chaos.
But, while investors view the developments as bullish – since QE is like catnip for the post-GFC crowd – the reality is that bond buying only amplifies the original problem.
Remember, the U.K. Consumer Price Index (CPI) increased by 9.9% year-over-year (YoY) in August. As a result, Britain has a worse inflation problem than the U.S. Furthermore, purchasing U.K. bonds and increasing the money supply is like putting out one fire by starting another.
Second, the pound has been under immense pressure in 2022. In fact, the GBP/USD’s rally on Sep. 28 was largely immaterial when considering that the currency pair closed at an all-time low on Sep. 26. Thus, the extension of QE is profoundly bearish for the GBP.
Please see below:
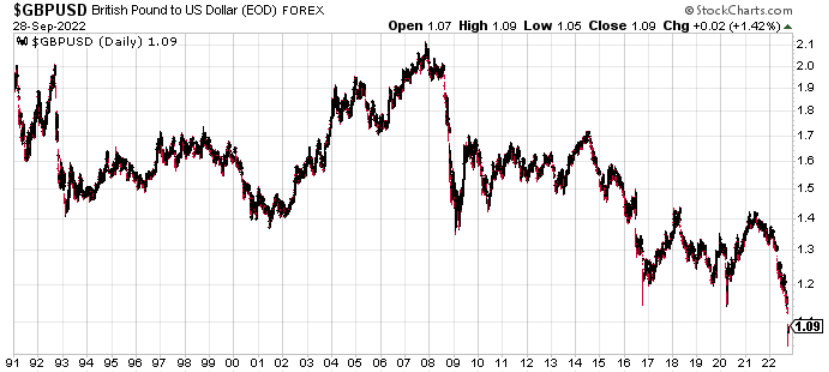
Also, please note that FX-adjusted import costs increase when a country’s currency decreases. As such, that’s why I was bullish on demand-driven U.S. inflation because a soaring USD Index did little to alleviate the pricing pressures despite making imports cheaper in FX terms.
In contrast, a weaker GBP amplifies Britain’s already troublesome inflationary problem. So while the ‘buy the dip’ crowd was out in full force on Sep. 28, like always, they misunderstand or don’t care about the medium-term consequences. As a result, while faulty narratives can provide a short-term lift to oversold assets, the gains should evaporate when reality re-emerges.
Same Story, Different Day
While the S&P 500 celebrated its first green close in the last seven sessions, the price action on Sep. 28 screamed of short covering. For example, I’ve noted on numerous occasions that the liquidity beneficiaries often rise and fall the most during daily rallies. The reason is that the shorts often cover their positions, which leads to abnormally large daily moves.
Please see below:
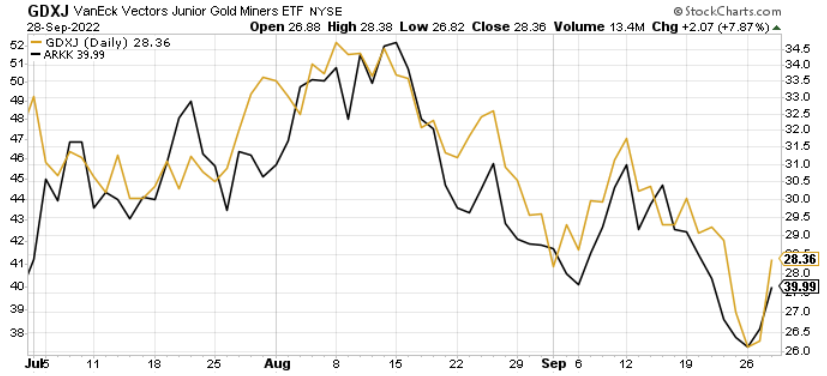
To explain, the gold line above tracks the GDXJ ETF, while the black line above tracks the ARK Innovation ETF (AARK). If you analyze the relationship, you can see that the pair have essentially moved in lockstep since July. As such, the Fed’s hawkish rhetoric/policy and the rapid rise in real interest rates often have similar effects on both assets.
Thus, with the GDXJ and ARKK ETFs rallying sharply on Sep. 28, the manic moves were similar to the short squeezes of 2021 and 2022. During that time, the GDXJ ETF recorded 12 daily rallies of 5% or more. However, the junior miners’ index is down by 47.7% from its Dec. 31, 2020 close. So, while short squeezes are far from fun, they’re largely immaterial when taking a big-picture view.
Showcasing a similar pattern, the ARKK ETF has recorded 28 daily rallies of 5% or more since the beginning of 2021. Yet, it’s down by 67.9% from its Dec. 31, 2020 close.
As a result, while short squeezes are painful, the moral of the story is that short-term sentiment highs don’t last when the technicals and the fundamentals do not support them.
The Fundamentals Didn’t Change
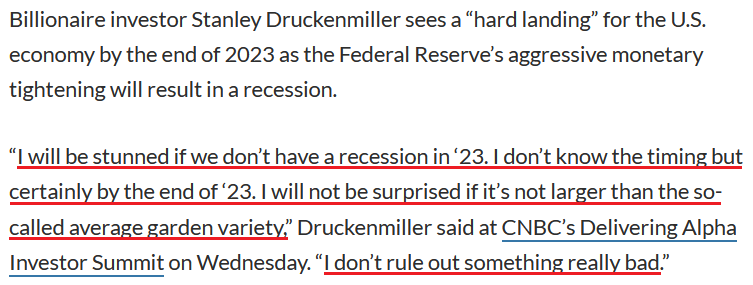
While financial markets partied like it was the summer of 2020, the ominous implications of unanchored inflation and higher interest rates remain. Moreover, billionaire investor Stanley Druckenmiller highlighted the challenges that lie ahead.
He said during CNBC’s Delivering Alpha conferance on Sep. 28:
“Our central case is a hard landing by the end of next year,” as U.S. QE, low interest rates and “all those factors that cause a bull market, they’re not only stopping, they’re reversing every one of them. We are in deep trouble.”
He added that the Fed’s transitory blunder should have drastic consequences over the next several months.
“When you make a mistake, you got to admit you’re wrong and move on, [while for] nine or 10 months, [the Fed] just sat there and bought $120 billion in bonds. I think the repercussions of that are going to be with us for a long, long time,” he said.
“You don’t even need to talk about Black Swans to be worried here. To me, the risk-reward of owning assets doesn’t make a lot of sense.”
As such, Druckenmiller knows that every Fed inflation fight since 1954 has ended with a recession.
Please see below:
 Source: MarketWatch
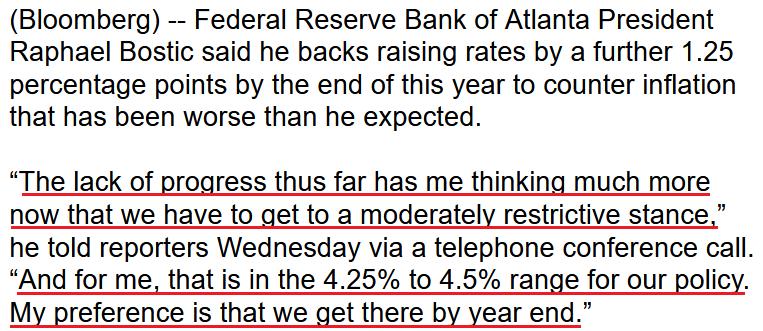
In addition, while investors hope the Fed pulls a BoE and resumes QE, officials are steadfast in their commitment to taming inflation. For example, Atlanta Fed President Raphael Bostic said on Sep. 28 that the “U.S. economy still has a considerable amount of momentum” and that it’s less susceptible to “contagion” because of its economic strength.
He added:
“Inflation is still high and too high and not moving with enough speed back down to our 2% target,” and with normalizing supply chains not having the desired impact, “it’s caused me to really adjust my policy thinking.”
Therefore, he’s the latest Fed official to advocate for a 4.25%+ U.S. federal funds rate (FFR).
Please see below:
 Source: Bloomberg
Finally, while the U.K. pension market required monetary intervention, the situation in the U.S. is materially different.
Please see below:
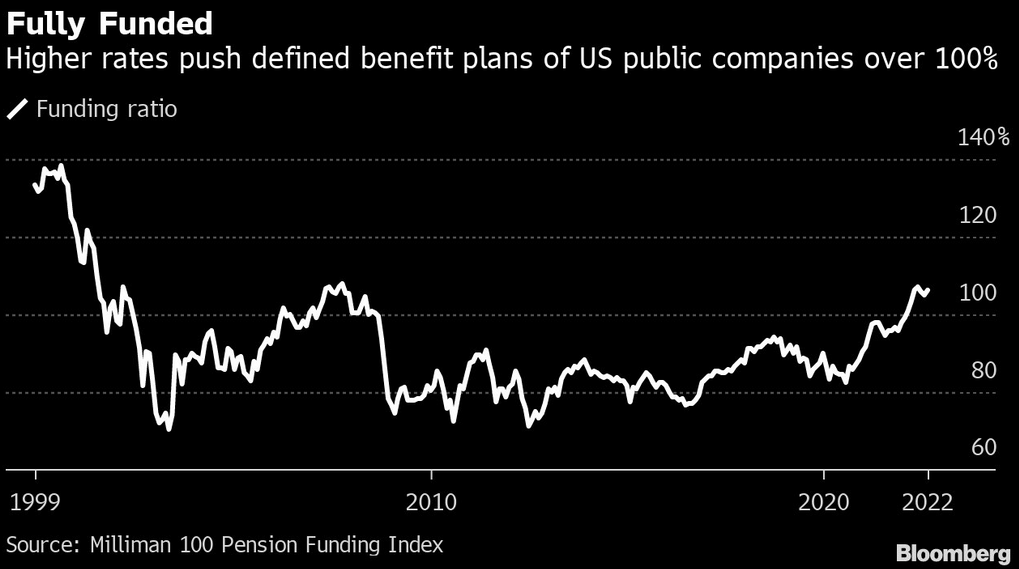
To explain, the white line above tracks the funding ratio of the 100 largest corporate defined benefit pension plans in the U.S. If you analyze the right side of the chart, you can see that the index hit 106.4% in August, which means that the 100 largest U.S. pension funds have an average of $106.4 in assets for every $100 in liabilities. In a nutshell: they have more than enough to meet potential claims, and the higher the white line, the better.
More importantly, the ratio has risen alongside U.S. Treasury yields, as higher interest rates allow pension funds to earn a better return with less risk. Therefore, they don’t have to chase stocks to keep pace with their liabilities.
As a result, the U.K. stress is not present in the U.S., and the fundamental ramifications of a higher FFR should continue to weigh on asset prices over the medium term.
The Bottom Line
Short squeezes have been a dime a dozen in 2022, and I warned repeatedly that the ‘buy the dip’ crowd won’t die easily. Moreover, while the BoE’s announcement and the GDXJ ETF’s ascent on Sep. 28 were unwelcome surprises, the ominous technical and fundamental developments that plagued the junior miners in 2021 and 2022 remain. Thus, while the short-term is difficult to predict, the medium-term outlooks for gold, silver, and mining stocks are profoundly bearish.
In conclusion, the PMs rallied on Sep. 28, as risk-on sentiment returned to the financial markets. However, large daily moves have happened before, and they haven’t stopped the USD Index or the U.S. 10-Year real yield from making new highs or the GDXJ ETF from making new lows. As such, we view the PMs’ daily uprisings as countertrend rallies within medium-term downtrends.
Overview of the Upcoming Part of the Decline
- It seems to me that the corrective upswing is over, and that the next big move lower is already underway.
- If we see a situation where miners slide in a meaningful and volatile way while silver doesn’t (it just declines moderately), I plan to – once again – switch from short positions in miners to short positions in silver. At this time, it’s too early to say at what price levels this could take place and if we get this kind of opportunity at all – perhaps with gold prices close to $1,600.
- I plan to switch from the short positions in junior mining stocks or silver (whichever I’ll have at that moment) to long positions in junior mining stocks when gold / mining stocks move to their 2020 lows (approximately). While I’m probably not going to write about it at this stage yet, this is when some investors might consider getting back in with their long-term investing capital (or perhaps 1/3 or 1/2 thereof).
- I plan to return to short positions in junior mining stocks after a rebound – and the rebound could take gold from about $1,450 to about $1,550, and it could take the GDXJ from about $20 to about $24.
- I plan to exit all remaining short positions once gold shows substantial strength relative to the USD Index while the latter is still rallying. This may be the case with gold prices close to $1,400 and GDXJ close to $15 . This moment (when gold performs very strongly against the rallying USD and miners are strong relative to gold after its substantial decline) is likely to be the best entry point for long-term investments, in my view. This can also happen with gold close to $1,400, but at the moment it’s too early to say with certainty.
- The above is based on the information available today, and it might change in the following days/weeks.
You will find my general overview of the outlook for gold on the chart below:
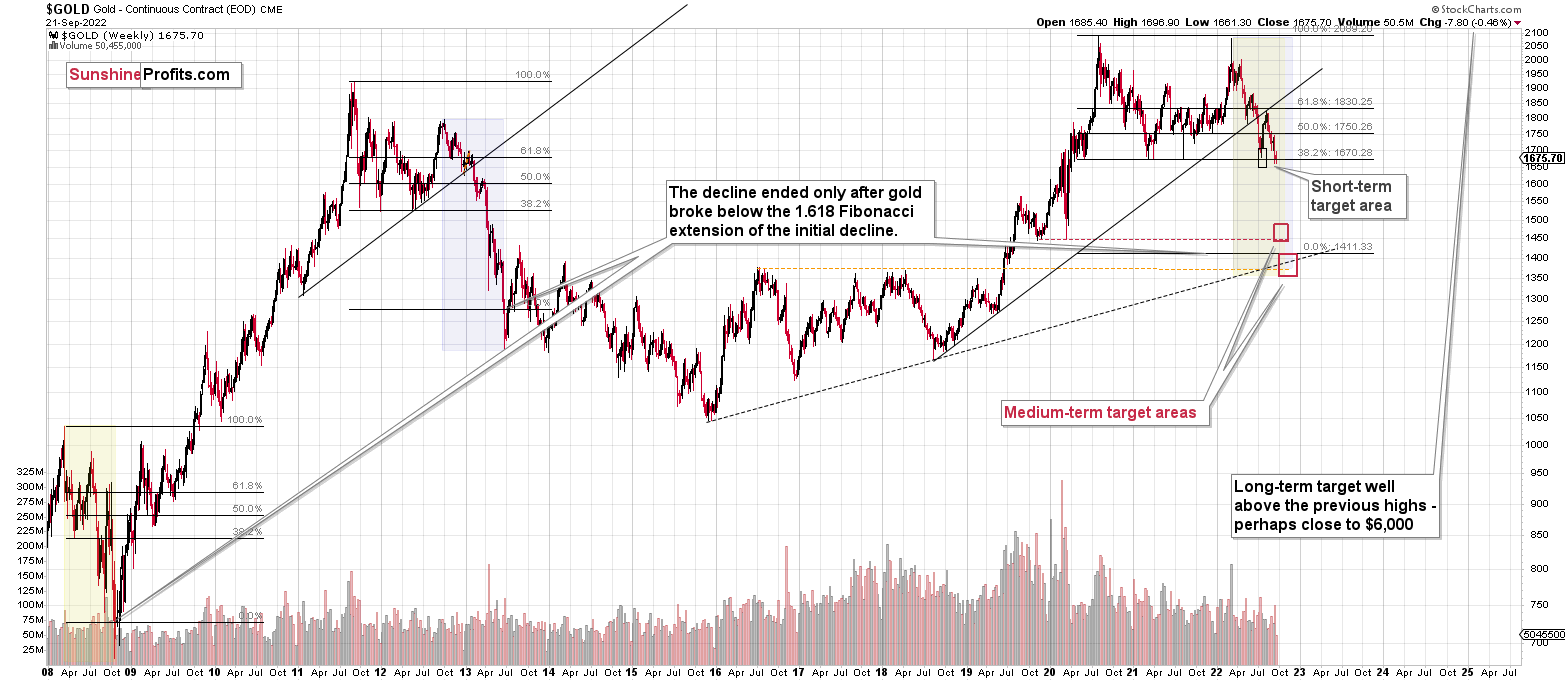
Please note that the above timing details are relatively broad and “for general overview only” – so that you know more or less what I think and how volatile I think the moves are likely to be – on an approximate basis. These time targets are not binding nor clear enough for me to think that they should be used for purchasing options, warrants, or similar instruments.
Summary
Summing up, it seems that the biggest part of the 2013-like decline is taking place right now, and – while I can’t make any promises regarding performance - it seems likely to me that our big profits are about to become huge, and then ridiculously big in the relatively near future.
Things might happen very fast in the coming days, and if I plan to make any adjustments, I’ll keep you informed. Still, if the targets that I’m mentioning in the “Trading” part of the summary are reached, I think that profits should be taken off the table without an additional confirmation from me. I will probably get on the long side of the market at that time, but I’ll send a confirmation if I decide to do so.
After the final sell-off (that takes gold to about $1,350-$1,500), I expect the precious metals to rally significantly. The final part of the decline might take as little as 1-5 weeks, so it's important to stay alert to any changes.
As always, we'll keep you – our subscribers – informed.
To summarize:
Trading capital (supplementary part of the portfolio; our opinion): Full speculative short positions (300% of the full position) in junior mining stocks are justified from the risk to reward point of view with the following binding exit profit-take price levels:
Mining stocks (price levels for the GDXJ ETF): binding profit-take exit price: $20.32; stop-loss: none (the volatility is too big to justify a stop-loss order in case of this particular trade)
Alternatively, if one seeks leverage, we’re providing the binding profit-take levels for the JDST (2x leveraged). The binding profit-take level for the JDST: $29.87; stop-loss for the JDST: none (the volatility is too big to justify a SL order in case of this particular trade).
For-your-information targets (our opinion; we continue to think that mining stocks are the preferred way of taking advantage of the upcoming price move, but if for whatever reason one wants / has to use silver or gold for this trade, we are providing the details anyway.):
Silver futures downside profit-take exit price: $12.32
SLV profit-take exit price: $11.32
ZSL profit-take exit price: $79.87
Gold futures downside profit-take exit price: $1,504
HGD.TO – alternative (Canadian) 2x inverse leveraged gold stocks ETF – the upside profit-take exit price: $19.87
HZD.TO – alternative (Canadian) 2x inverse leveraged silver ETF – the upside profit-take exit price: $49.87
Long-term capital (core part of the portfolio; our opinion): No positions (in other words: cash)
Insurance capital (core part of the portfolio; our opinion): Full position
Whether you’ve already subscribed or not, we encourage you to find out how to make the most of our alerts and read our replies to the most common alert-and-gold-trading-related-questions.
Please note that we describe the situation for the day that the alert is posted in the trading section. In other words, if we are writing about a speculative position, it means that it is up-to-date on the day it was posted. We are also featuring the initial target prices to decide whether keeping a position on a given day is in tune with your approach (some moves are too small for medium-term traders, and some might appear too big for day-traders).
Additionally, you might want to read why our stop-loss orders are usually relatively far from the current price.
Please note that a full position doesn't mean using all of the capital for a given trade. You will find details on our thoughts on gold portfolio structuring in the Key Insights section on our website.
As a reminder - "initial target price" means exactly that - an "initial" one. It's not a price level at which we suggest closing positions. If this becomes the case (as it did in the previous trade), we will refer to these levels as levels of exit orders (exactly as we've done previously). Stop-loss levels, however, are naturally not "initial", but something that, in our opinion, might be entered as an order.
Since it is impossible to synchronize target prices and stop-loss levels for all the ETFs and ETNs with the main markets that we provide these levels for (gold, silver and mining stocks - the GDX ETF), the stop-loss levels and target prices for other ETNs and ETF (among other: UGL, GLL, AGQ, ZSL, NUGT, DUST, JNUG, JDST) are provided as supplementary, and not as "final". This means that if a stop-loss or a target level is reached for any of the "additional instruments" (GLL for instance), but not for the "main instrument" (gold in this case), we will view positions in both gold and GLL as still open and the stop-loss for GLL would have to be moved lower. On the other hand, if gold moves to a stop-loss level but GLL doesn't, then we will view both positions (in gold and GLL) as closed. In other words, since it's not possible to be 100% certain that each related instrument moves to a given level when the underlying instrument does, we can't provide levels that would be binding. The levels that we do provide are our best estimate of the levels that will correspond to the levels in the underlying assets, but it will be the underlying assets that one will need to focus on regarding the signs pointing to closing a given position or keeping it open. We might adjust the levels in the "additional instruments" without adjusting the levels in the "main instruments", which will simply mean that we have improved our estimation of these levels, not that we changed our outlook on the markets. We are already working on a tool that would update these levels daily for the most popular ETFs, ETNs and individual mining stocks.
Our preferred ways to invest in and to trade gold along with the reasoning can be found in the how to buy gold section. Furthermore, our preferred ETFs and ETNs can be found in our Gold & Silver ETF Ranking.
As a reminder, Gold & Silver Trading Alerts are posted before or on each trading day (we usually post them before the opening bell, but we don't promise doing that each day). If there's anything urgent, we will send you an additional small alert before posting the main one.
Thank you.
Przemyslaw Radomski, CFA
Founder, Editor-in-chief

