

Briefly: in our opinion, full (300% of the regular position size) speculative short positions in mining stocks are justified from the risk/reward point of view at the moment of publishing this Alert.
Confirmed, unconfirmed, verified, and invalidated: breakouts and breakdowns are now ubiquitous. And the implications are bearish for gold.
Let’s start today’s analysis with a discussion of the key market that everyone is interested in – gold.
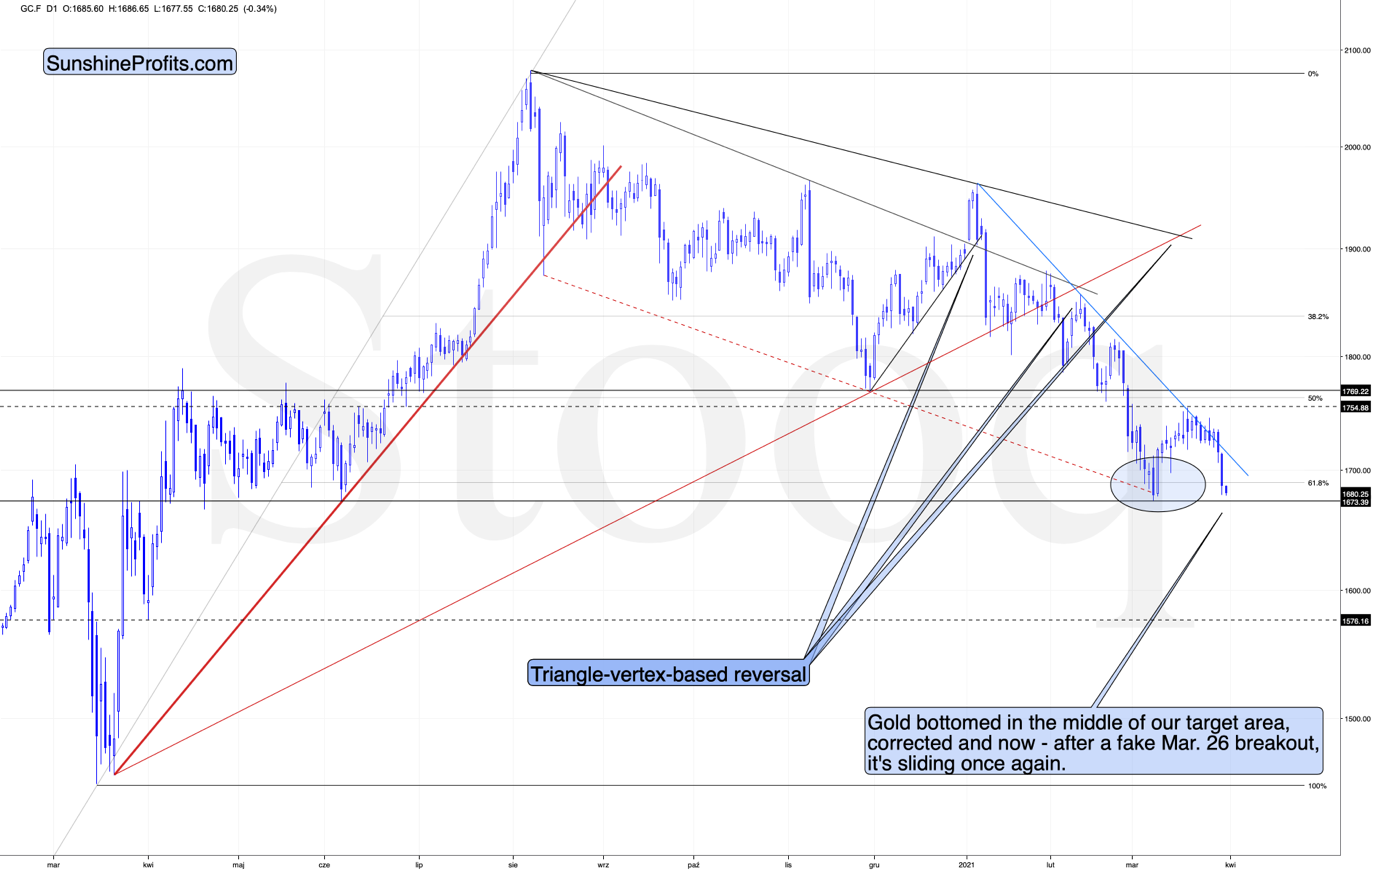
In short, gold just invalidated its small breakout above the declining blue resistance line. The previous breakout was small and thus it required a confirmation. It never got one, and instead gold plunged, invalidating the move. This is yet another sell sign that we saw.
It also serves as further proof that ever since the beginning of the year, gold permabulls (many people continue to claim that gold can only go up, even now) were destroying value rather than creating it. On a side note, we have nothing against checking out the work of other analysts, but we encourage you to check if someone was both bullish and bearish on a given market. If they never changed their mind, it seems that you can save some time by not reading what they come up with, as you already know the outcome. Besides it’s not like they would prepare you in advance for any decline (in case of permabulls).
Getting back to the current market situation – since gold moved lower quite visibly yesterday (Mar. 30), and even (almost) reached its early-March high, it might be tempting to think that the decline is over. This seems unlikely in my opinion.
The less important reason for the above is visible right on the above chart. Earlier this month, gold topped very close to its triangle-vertex-based reversal. The previous two triangle-vertex-based reversals also triggered declines. So, if something similar triggered similar moves, then it might be worth checking how big did the previous declines end up being.
Both previous 2021 declines were followed by quite visible declines. The one that started in early Jan. took gold over $130 lower, and the one that started in mid-Feb. took gold over $170 lower. The current decline started at $1,754.20, so if the history is to rhyme (as it often does), gold would be likely to decline to at least $1,584 - $1,624. This target area corresponds quite well to the support provided by the early Mar. and early Apr. 2020 lows.
The more important reasons due to which it seems likely that the decline will continue are: the rally in the USD Index and the rally in the long-term interest rates.
As far as the latter is concerned, it seems unlikely that we’ll see the Fed stepping into action with another Operation Twist until the general stock market slides. Otherwise, such a big intervention might seem uncalled for. Consequently, the long-term rates are likely to rally some more. And gold is likely to respond by declining further.
As far as the USD Index in concerned, it just moved to new yearly highs, and since the nearest strong resistance is relatively far (from the short-term point of view), it seems that the move higher will continue with only small corrections along the way.
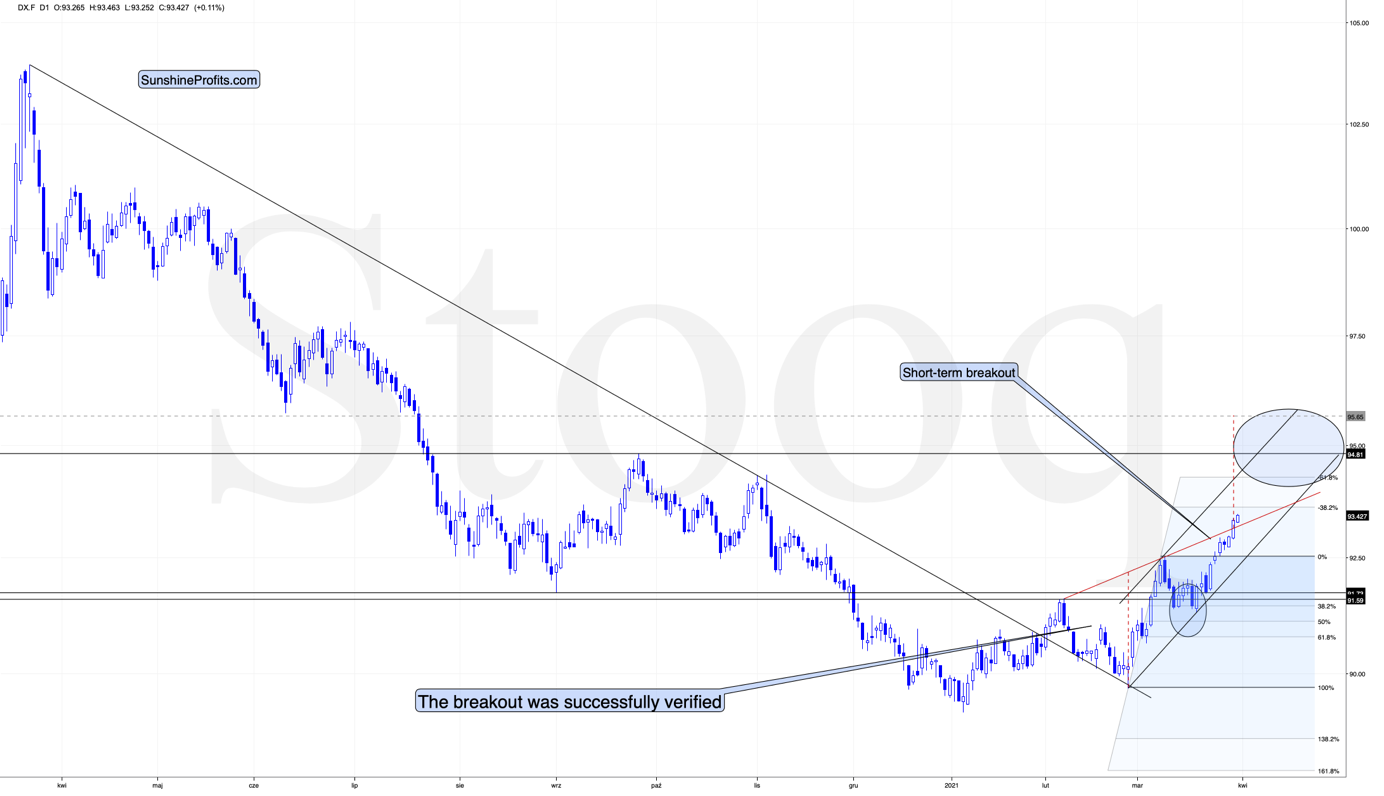
The USD Index has not only confirmed the breakout above its Feb. highs, but it even managed to break above the rising red support line. This line, along with the rising black line based on the Feb. and mid-March lows, creates a rising wedge pattern that was already broken to the upside. The moves that tend to follow such breakouts often are as big as the size of the wedge. I used red, dashed lines for this target-determining technique. Based on it, the USD Index is likely to rally to about 96.65.
The above target is slightly above the mid-2020 highs, so it might seem more conservative to set the upside target at those highs, close to the 94.5-94.8 area. The mid-2020 highs are likely to trigger a breather, but it doesn’t have to be the case that the USD Index pauses below these highs. Conversely, it could be the case that the USD Index first breaks above the mid-2020 highs and consolidates after the breakout. In fact, that’s what it did with regard to the breakout above the Feb. 2021 highs.
Consequently, I’m broadening the target area for the USD Index, so that it now encompasses also the more bullish scenario in which the USDX takes out the mid-2020 highs before consolidating.
Either way, we’re currently in the “easy part” of the USD’s rally. Even if it’s going to consolidate at or below the mid-2020 highs, it’s still very likely to first get there, and this implies a move higher by at least another full index point. This means that the gold price is likely to decline some more before finding short-term support. The scenario fits very well with the situation that I outlined based on the gold chart earlier today.
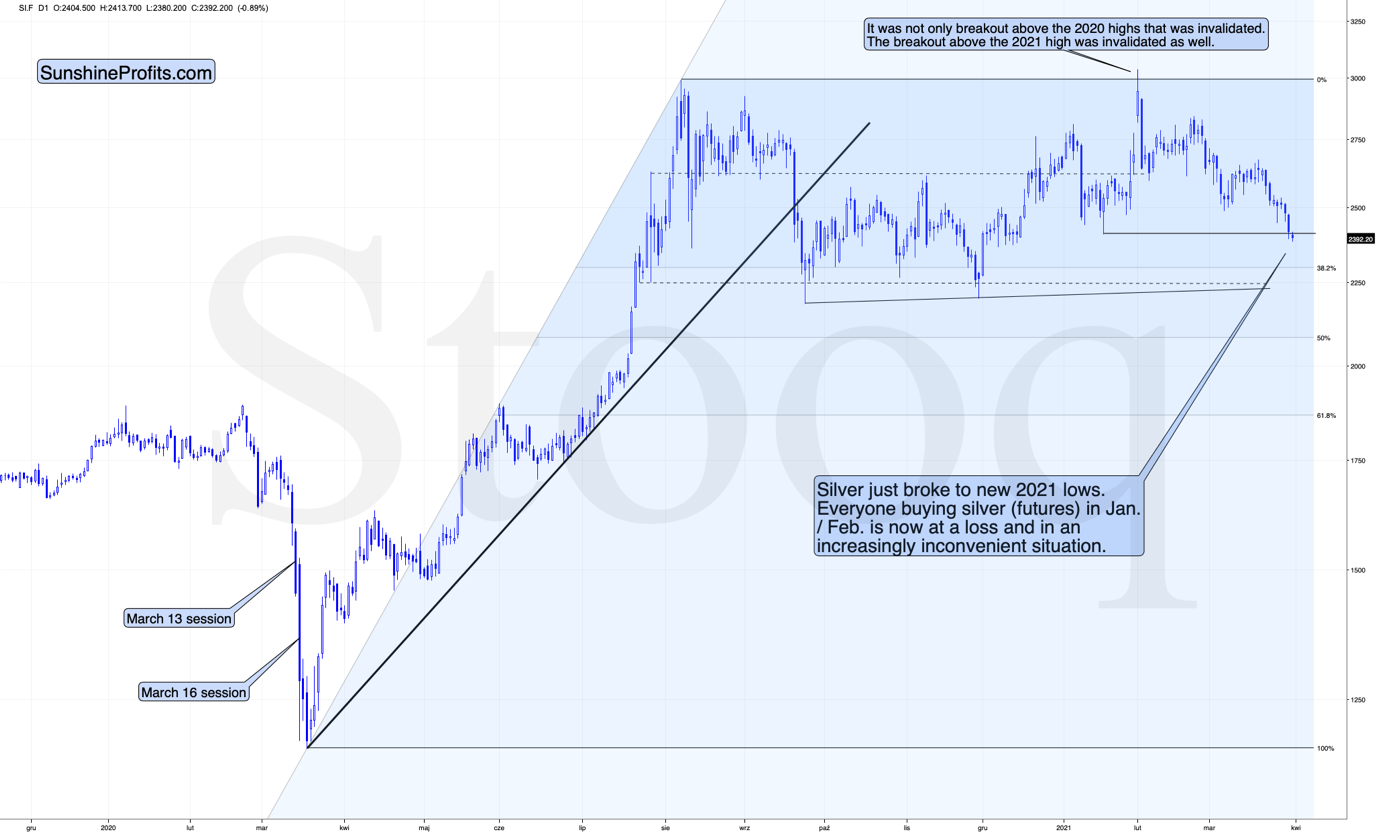
Silver just broke to new 2021 lows. Everyone buying silver (futures) in Jan. / Feb. is now at a loss and in an increasingly inconvenient situation.
Why would this be important? Because it means that everyone who jumped into the silver market with both feet based on just very brief research (“research”?) which in many cases was following instructions provided at various forums is in a losing position right now.
Sometimes the losses are small – for the very few, who were early, but in some cases, the losses are already quite visible – especially for those, who bought close to $30.
Why is this important? Because it emphasizes the need to verify the quality of the information that one chooses to act on, and because it’s a tipping point after which the previous buyers are likely to start becoming sellers, thus adding to decline’s sharpness.
The “new silver buyers” losses are not huge yet, but after another move lower, they will likely become such and the sales from those buyers would likely make these declines even bigger.
When everyone and their brother was particularly bullish on silver a few months ago, I wrote that they might be quite right, but the timing was terrible. So far, the losses for those, who bought silver earlier this year are not that big, but, in my opinion, they are likely to become much bigger in the following weeks.
Of course, I expect silver price to soarin the following years (well over $100), but not without plunging first in the short and/or medium term.
Let’s take a look at the mining stocks. In yesterday’s analysis, I explained the likely reason behind the temporary strength in the mining stocks, and I emphasized that it’s not likely to last. This explanation remains up-to-date:
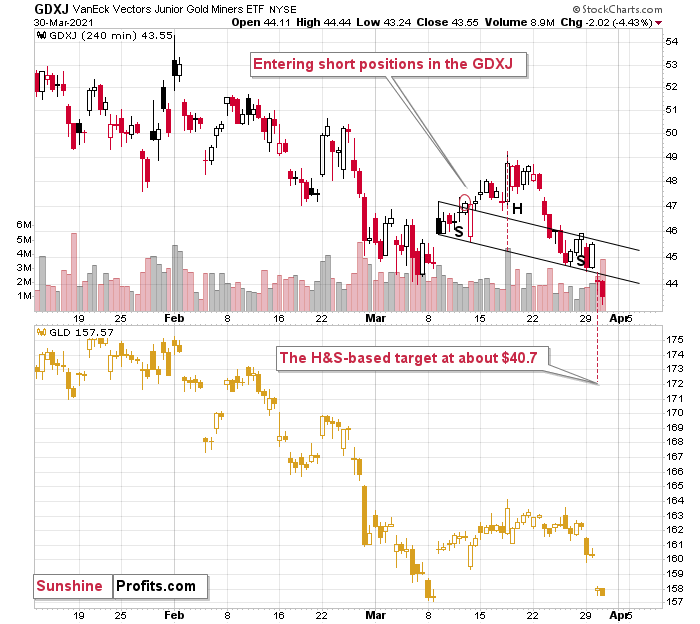
Ultimately, it’s never possible to reply to the “why did a given market move” other than that “because buyers won over sellers”. It’s not particularly informative, though. The reason that seems most likely to me is that it was… a purely technical development that “needed” to happen for a formation to be complete.
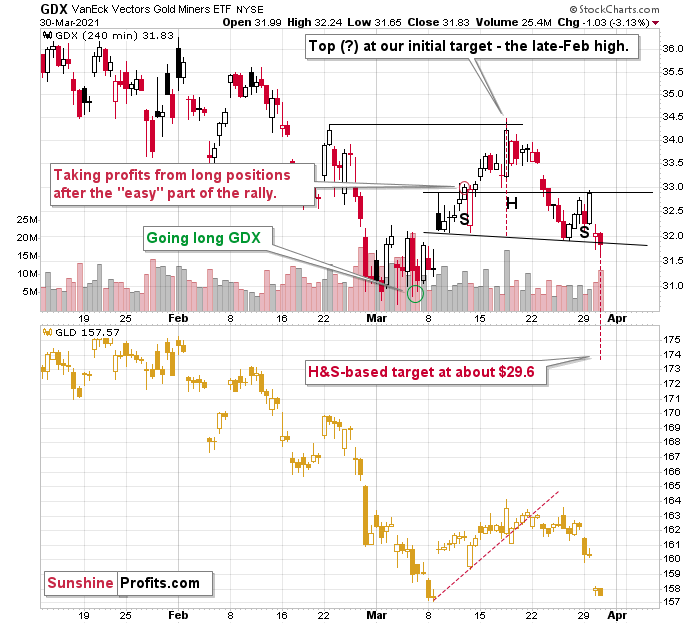
This hypothesis would explain also one odd thing that happened yesterday. Namely, while the GDX closed the day slightly higher, the GDXJ ended the day lower. This would make sense if the general stock market declined (junior mining stocks – GDXJ tend to follow its lead more than seniors – GDX) – but the point is that the general stock market ended yesterday’s session basically flat (declining by mere 0.09% decline).
“Ok, so what kind of formation are miners completing?”
Quite likely the head and shoulders formations. The reason for yesterday’s underperformance of the GDXJ would be the fact that in case of this ETF’s head-and-shoulders formation, the neckline is descending much more visibly. These formations are more visible on the 4-hour charts – so, let’s zoom in.
Currently – based on yesterday’s (Mar. 30) closing prices – both formations are completed, and while it could still be the case that both ETFs move back to their previous necklines to verify the breakdowns, the implications are already bearish for the short term.
The price targets based on those formations are $29.6 and $40.7 for the GDX and GDXJ, respectively. However, let’s keep in mind that the H&S-based targets should be viewed as “minimum” targets, not necessarily the final ones.
All in all, the technical picture currently favors lower precious metals (and mining stock) prices over the next several weeks. In my view, this is either the middle or the final part of the very final decline in the precious metals market, before it takes off based on multiple positive factors of long-term nature.
Having said that, let’s take a look at the market from a more fundamental angle.
Slowly, and Then All at Once
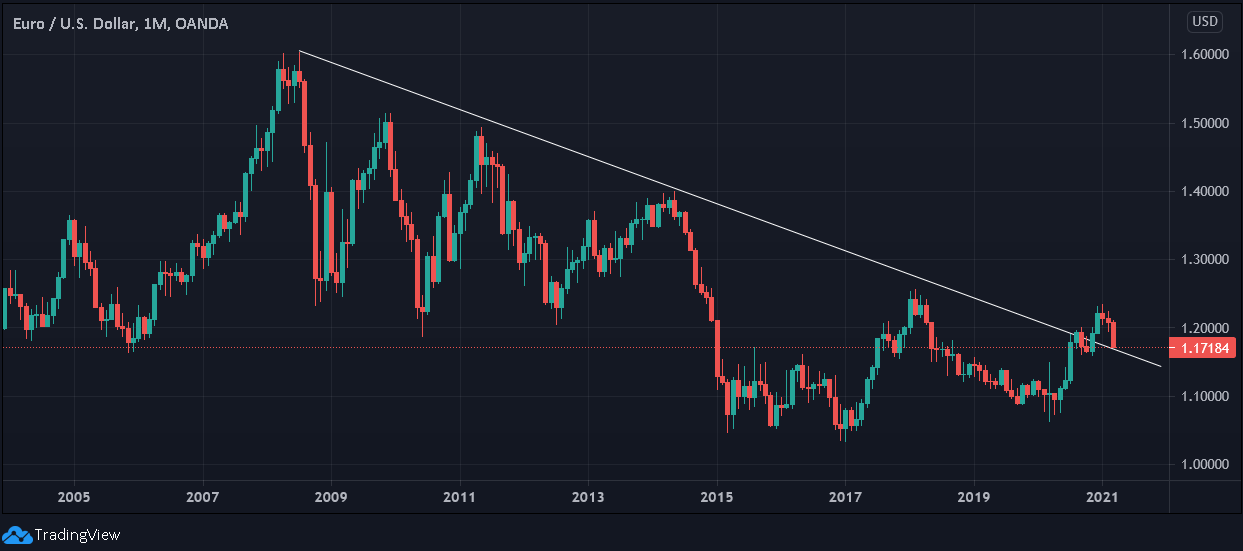
For two months, I’ve been warning that the EUR/USD was on a collision course lower. And because the EUR/USD accounts for nearly 58% of the movement of the USD Index, the currency pair is an extremely important piece of the PMs’ puzzle.
Moreover, because the euro is bought on hope and sold on reality, the latter has the EUR/USD fast approaching its September/November lows.
Please see below:
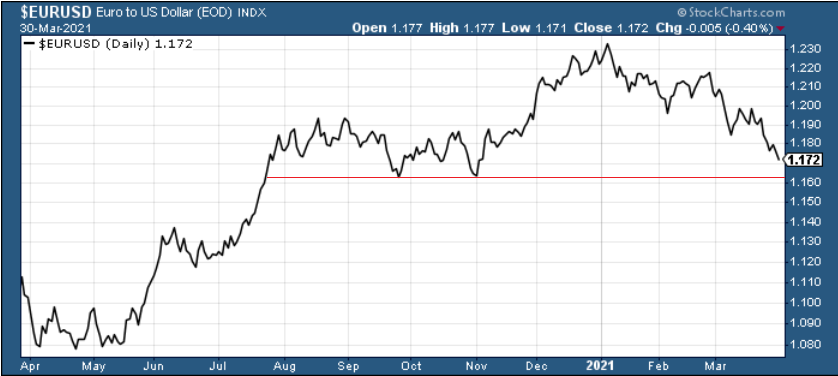
More importantly though, a potential breach of the September/November lows also implies a break below the EUR/USD’s long-term declining resistance line. Thus, if the development materializes, the euro’s plight could be the engine that drives the USD Index back above 94.5.
But because Wall Street analysts spend more time following the price than leading it, euro vultures are only now beginning to circle. Case in point: on Mar. 25, I wrote that Capital Economics – an independent analysis, research and consulting firm – cut its 2021 Eurozone GDP growth estimate.
An excerpt from the report read:
“We now think that the euro-zone economy will recover more slowly than we previously anticipated, growing by about 3% this year and 4.5% in 2022. Meanwhile, euro-zone government bond yields seem unlikely to fall much further, and with Treasury yields set to increase significantly, we expect the widening yield gap to cause the euro to weaken against the US dollar.”
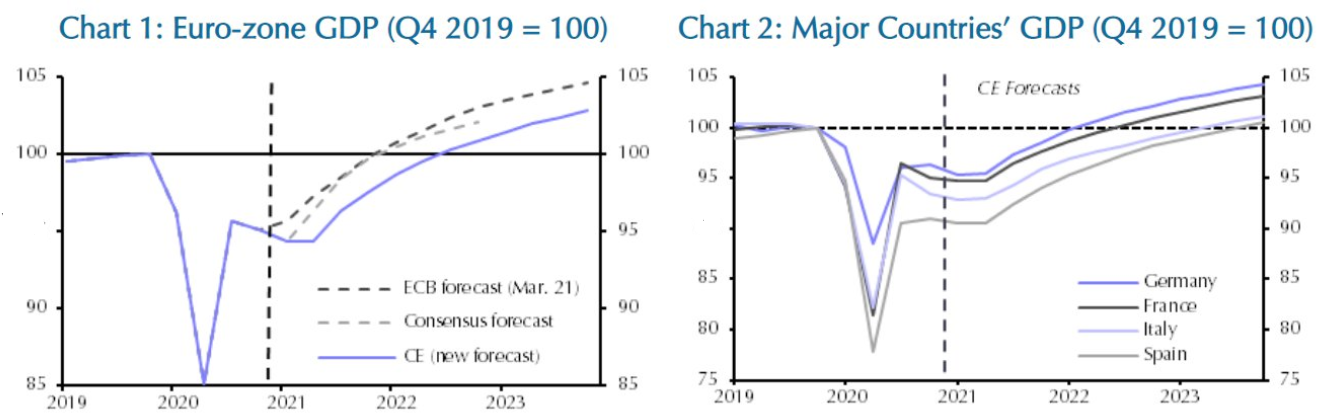 Source: Capital Economics
Joining the herd, Bloomberg Intelligence also reduced its first-quarter Eurozone GDP growth estimate.
And likely not the last scavenger to peck at the euro’s carcass, UBS also reduced its 2021 Eurozone GDP growth estimate from 5.0% to 4.1%.
But what caused the sudden shift?
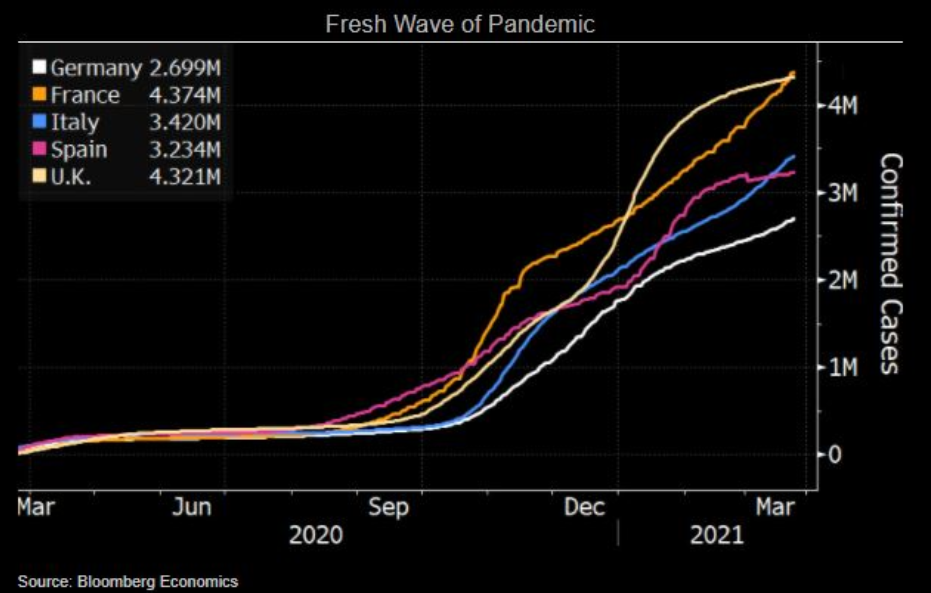
Well, underpinning the bearish about face, coronavirus cases continue to surge across Europe.
Please see below:
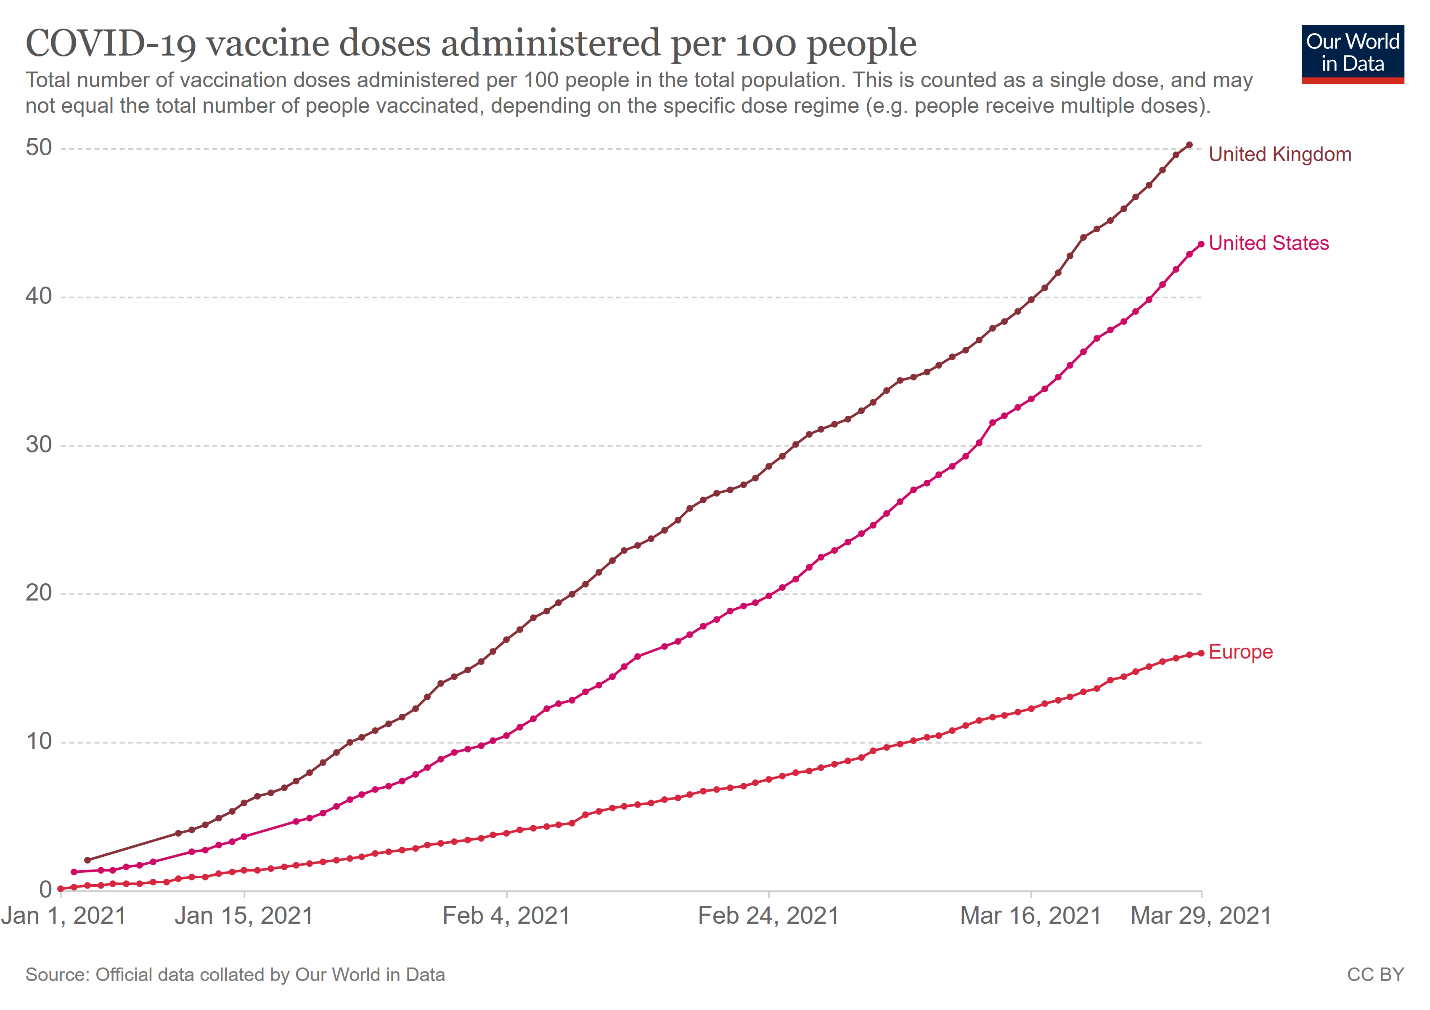
And lagging far behind in the vaccine race, COVID-19 vaccinations across Europe are still drastically underperforming the United States.
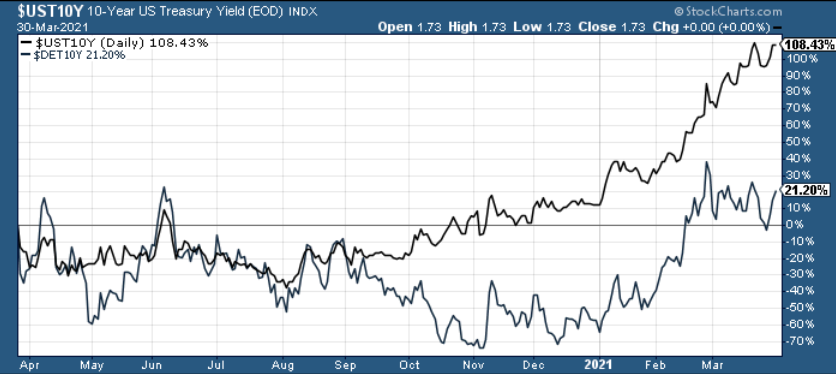
In addition, the widening divergence between U.S. and Eurozone interest rates is extremely bearish for the EUR/USD. On several occasions, I’ve reiterated that higher interest rates (unless brought about by some kind of sovereign crisis) go hand-in-hand with a stronger currency. And if you analyze the chart below, you can see that the U.S. 10-Year Treasury yield has completely decoupled from the German 10-Year Bond yield. For context, we believe that German yields are most relevant because Germany is Europe’s largest economy.
Furthermore, U.S.-Eurozone interest rate differentials have the potential to significantly impact the carry trade. For context, the carry trade is an arbitrage strategy where an investor borrows money in one currency and invests the proceeds in another currency. To explain, an investor could borrow in euros, convert the funds to U.S. dollars (effectively shorting the euro) and invest the money in U.S. Treasuries.
Now, the most important point is that the carry trade incurs interest charges. And because Eurozone interest rates are much lower than U.S. interest rates, it’s cheaper to use the euro as the ‘funding’ currency.
Thus, because most carry trades involve shorting a developed-market currency and investing the proceeds in a high-yielding emerging market currency, the euro is a more attractive short than the U.S. dollar. Think about it: if interest charges are embedded in the trade, wouldn’t you rather short the euro instead of the USD?
Expecting just that, Vanda Research’s latest FX Outlook makes the case:
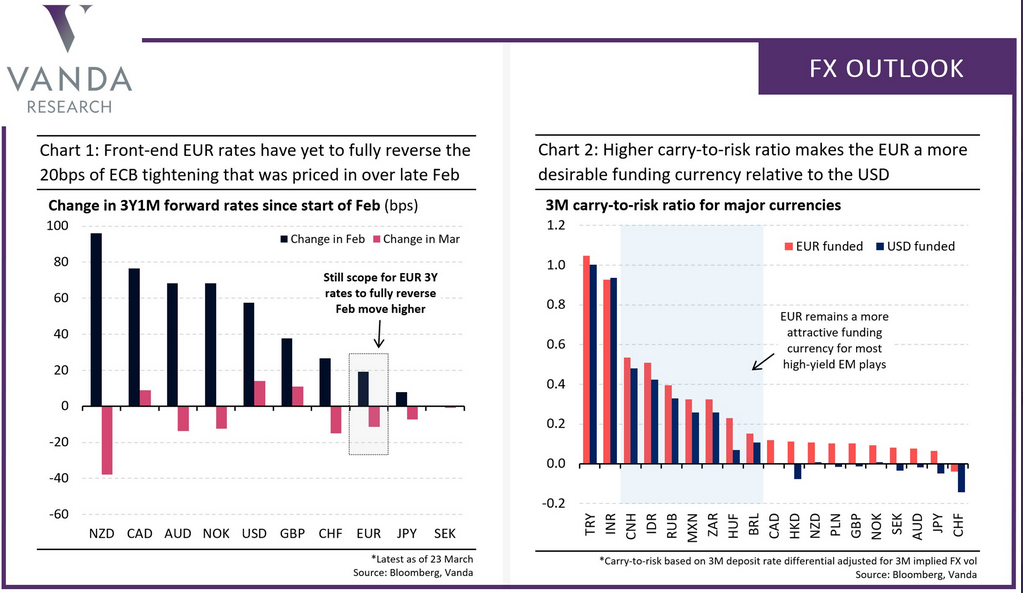
To explain, if you focus your attention on the second chart above (on the right), the orange bars represent the three-month euro-funded carry-to-risk ratio, while the blue bars represent the three-month USD-funded carry-to-risk ratio.
To explain the rationale, the carry-to-risk ratio weighs the impact of two key variables:
- The carry trade’s interest-rate spread: the difference between the interest rate that you pay to borrow in one currency relative to the interest rate that you earn by investing the proceeds in a bond of another currency
- The risk that future exchange-rate movements erode your interest-rate spread
Keep in mind: if you earn a 5% interest-rate spread but the investing currency declines by 5%, you actually lose money.
More importantly though, excluding the INR-USD combination (Indian rupee), every other carry trade prospect above offers a better risk-reward proposition by using the euro as the funding currency. Thus, a continuation of the theme is extremely bearish for the EUR/USD.
Conversely, as the main beneficiary of the euro’s fall from grace, EUR/USD pain is the USD Index’s gain.
Over the last two months, I’ve spent a lot of time discussing the 2017-2018 analogue: as a refresher, 94.5 is likely the first stop along the USD Index’s illustrious journey back above 100. And providing another update of the appetizing visual (hat tip to Julien Bittel of Pictet Asset Management), if you analyze the chart below, you can see that The Resurgence: Part 2 is already going full-steam ahead.
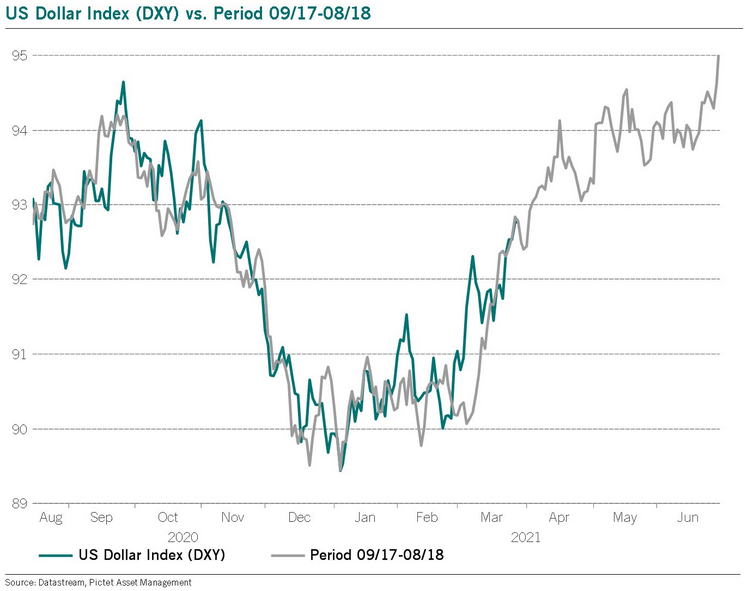
For context, I wrote previously:
The gray line above depicts the USD Index’s performance from September 2017 to August 2018, while the blue line above depicts the USD Index’s current performance. As you can see, the USD Index is following the 2017-2018 analogue to a tee.
And why is the USD Index so important?
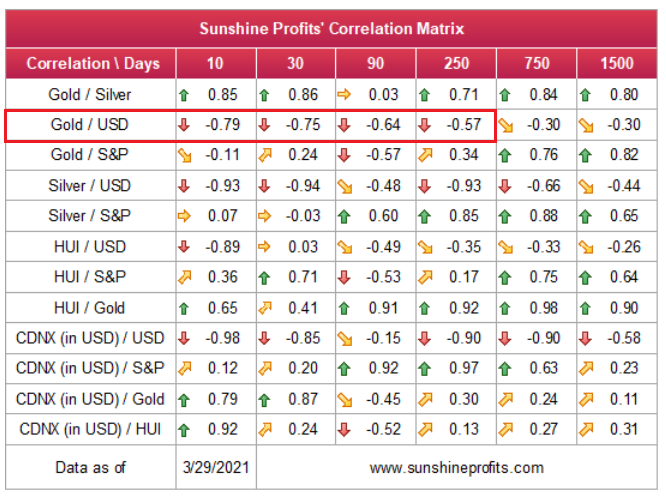
Well, if you analyze the table below, you can see that gold has a strong negative correlation with the U.S. dollar.
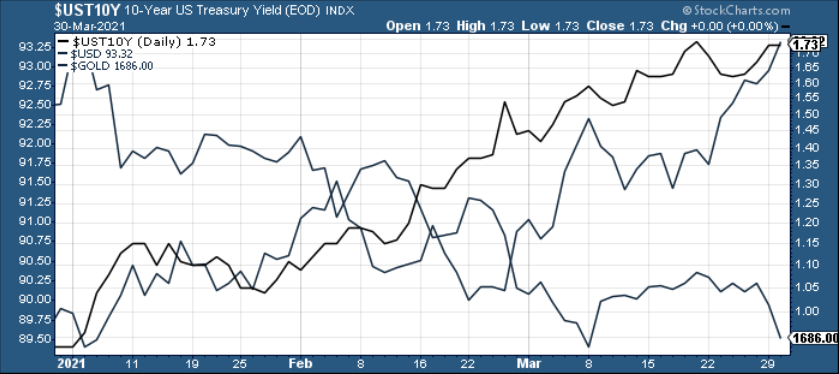
Even more telling, the New Year’s combination of a rising U.S. 10-Year Treasury yield and a stronger USD Index has been, and will likely continue to be, the yellow metal’s kryptonite.
Please see below:
In conclusion, the miners’ relative strength evaporated on Mar. 30, as gold’s 1.67% drawdown also coincided with a 3.13% haircut of the GDX ETF. Moreover, with U.S. Treasury yields often exploding without warning, Joe Biden’s $3 trillion infrastructure speech on Mar. 31 could result in another daily eruption. If that wasn’t enough, the USD Index’s trifecta of technicals, fundamentals and sentiment have all breathed new life into the greenback, with the basket ending the Mar. 30 session at its highest level since Nov. 4. As a result, with the momentum likely to continue, the PMs remain destined for devaluation.
Overview of the Upcoming Part of the Decline
- It seems quite likely to me that we are already after the initial bottom and the initial correction. If not, then it seems likely to me that the corrective upswing will be completed within the next 2 weeks (with PMs topping in early April). It’s more likely that the next big move lower is already underway, though.
- After miners slide once again in a meaningful and volatile way, but silver doesn’t (and it just declines moderately), I plan to switch from short positions in miners to short positions in silver (this could take another 1-2 weeks to materialize). I plan to exit those short positions when gold shows substantial strength relative to the USD Index, while the latter is still rallying. This might take place with gold close to $1,450 - $1,500 and the entire decline (from above $1,700 to about $1,475) would be likely to take place within 1-12 weeks and I would expect silver to fall hardest in the final part of the move. This moment (when gold performs very strongly against the rallying USD and miners are strong relative to gold – after gold has already declined substantially) is likely to be the best entry point for long-term investments in my view. This might happen with gold close to $1,475, but it’s too early to say with certainty at this time. In other words, the entire decline could take between 1 and 12 weeks, while silver declines occuring particularly fast in the final 1-2 weeks.
- If gold declines even below $1,500 (say, to ~$1350 or so), then it could take another 10 weeks or so for it to bottom, but this is not what I view as a very likely outcome.
- As a confirmation for the above, I will use the (upcoming or perhaps we have already seen it?) top in the general stock market as the starting point for the three-month countdown. The reason is that after the 1929 top, gold miners declined for about three months after the general stock market started to slide. We also saw some confirmations of this theory based on the analogy to 2008. All in all, the precious metals sector would be likely to bottom about three months after the general stock market tops . If the mid-February 2020 top was the final medium-term top (based on NASDAQ’s top, then it seems that we might expect the precious metals sector to bottom in mid-May or close to May’s end. If, however, the mid-March 2021 top was the final medium-term top (based on the S&P 500), then we might expect the precious metals sector to bottom in mid-June or close to June’s end.
- The above is based on the information available today and it might change in the following days/weeks.
Summary
To summarize, the PMs’ medium-term decline is well underway, and based on the recent performance of the USD Index, gold and mining stocks, it seems that the corrective upswing is already over (or about to be over). The next big move lower seems to be already underway or about to start.
In addition, because we’re likely entering the “winter” part of the Kondratiev cycle (just like in 1929 and then the 1930s), the outlook for the precious metals’ sector remains particularly bearishduring the very first part of the cycle, when cash is king.
The confirmed breakout in the USD Index is yet another confirmation of the bearish outlook for the precious metals market.
After the sell-off (that takes gold to about $1,450 - $1,500), we expect the precious metals to rally significantly. The final part of the decline might take as little as 1-5 weeks, so it's important to stay alert to any changes.
Most importantly, please stay healthy and safe. We made a lot of money last March and it seems that we’re about to make much more on this March decline, but you have to be healthy to enjoy the results.
As always, we'll keep you - our subscribers - informed.
By the way, we’re currently providing you with a possibility to extend your subscription by a year, two years or even three years with a special 20% discount. This discount can be applied right away, without the need to wait for your next renewal – if you choose to secure your premium access and complete the payment upfront. The boring time in the PMs is definitely over and the time to pay close attention to the market is here. Naturally, it’s your capital, and the choice is up to you, but it seems that it might be a good idea to secure more premium access now, while saving 20% at the same time. Our support team will be happy to assist you in the above-described upgrade at preferential terms – if you’d like to proceed, please contact us.
To summarize:
Trading capital (supplementary part of the portfolio; our opinion): Full speculative short positions (300% of the full position) in mining stocks are justified from the risk to reward point of view with the following binding exit profit-take price levels:
Mining stocks (price levels for the GDXJ ETF): binding profit-take exit price: $24.12; stop-loss: none (the volatility is too big to justify a stop-loss order in case of this particular trade)
Alternatively, if one seeks leverage, we’re providing the binding profit-take levels for the JDST (2x leveraged) and GDXD (3x leveraged – which is not suggested for most traders/investors due to the significant leverage). The binding profit-take level for the JDST: $39.87; stop-loss for the JDST: none (the volatility is too big to justify a SL order in case of this particular trade); binding profit-take level for the GDXD: $94.87; stop-loss for the GDXD: none (the volatility is too big to justify a SL order in case of this particular trade).
For-your-information targets (our opinion; we continue to think that mining stocks are the preferred way of taking advantage of the upcoming price move, but if for whatever reason one wants / has to use silver or gold for this trade, we are providing the details anyway.):
Silver futures upside profit-take exit price: unclear at this time - initially, it might be a good idea to exit, when gold moves to $1,512.
Gold futures upside profit-take exit price: $1,512.
Long-term capital (core part of the portfolio; our opinion): No positions (in other words: cash
Insurance capital (core part of the portfolio; our opinion): Full position
Whether you already subscribed or not, we encourage you to find out how to make the most of our alerts and read our replies to the most common alert-and-gold-trading-related-questions.
Please note that we describe the situation for the day that the alert is posted in the trading section. In other words, if we are writing about a speculative position, it means that it is up-to-date on the day it was posted. We are also featuring the initial target prices to decide whether keeping a position on a given day is in tune with your approach (some moves are too small for medium-term traders, and some might appear too big for day-traders).
Additionally, you might want to read why our stop-loss orders are usually relatively far from the current price.
Please note that a full position doesn't mean using all of the capital for a given trade. You will find details on our thoughts on gold portfolio structuring in the Key Insights section on our website.
As a reminder - "initial target price" means exactly that - an "initial" one. It's not a price level at which we suggest closing positions. If this becomes the case (like it did in the previous trade), we will refer to these levels as levels of exit orders (exactly as we've done previously). Stop-loss levels, however, are naturally not "initial", but something that, in our opinion, might be entered as an order.
Since it is impossible to synchronize target prices and stop-loss levels for all the ETFs and ETNs with the main markets that we provide these levels for (gold, silver and mining stocks - the GDX ETF), the stop-loss levels and target prices for other ETNs and ETF (among other: UGL, GLL, AGQ, ZSL, NUGT, DUST, JNUG, JDST) are provided as supplementary, and not as "final". This means that if a stop-loss or a target level is reached for any of the "additional instruments" (GLL for instance), but not for the "main instrument" (gold in this case), we will view positions in both gold and GLL as still open and the stop-loss for GLL would have to be moved lower. On the other hand, if gold moves to a stop-loss level but GLL doesn't, then we will view both positions (in gold and GLL) as closed. In other words, since it's not possible to be 100% certain that each related instrument moves to a given level when the underlying instrument does, we can't provide levels that would be binding. The levels that we do provide are our best estimate of the levels that will correspond to the levels in the underlying assets, but it will be the underlying assets that one will need to focus on regarding the signs pointing to closing a given position or keeping it open. We might adjust the levels in the "additional instruments" without adjusting the levels in the "main instruments", which will simply mean that we have improved our estimation of these levels, not that we changed our outlook on the markets. We are already working on a tool that would update these levels daily for the most popular ETFs, ETNs and individual mining stocks.
Our preferred ways to invest in and to trade gold along with the reasoning can be found in the how to buy gold section. Furthermore, our preferred ETFs and ETNs can be found in our Gold & Silver ETF Ranking.
As a reminder, Gold & Silver Trading Alerts are posted before or on each trading day (we usually post them before the opening bell, but we don't promise doing that each day). If there's anything urgent, we will send you an additional small alert before posting the main one.
Thank you.
Przemyslaw Radomski, CFAFounder, Editor-in-chief

