

Briefly: in our opinion, full (200% of the regular size of the position) speculative short positions in gold, silver and mining stocks are justified from the risk/reward perspective at the moment of publishing this alert.
If Aerosmith was recording their hit song Crazy today, they might get a lot of inspiration from yesterday’s performance of the precious metals sector. Gold reversed after moving to new intraday high, silver took a dive and miners soared. This doesn’t make sense at the first sight. While soaring silver and underperforming stocks were bearish, the opposite is probably indicating higher prices, right?
Not necessarily. As we had pointed out previously, yesterday was one of this week’s apex-based reversals and weird things often happen right at the tops. Tops are formed when emotions reach zenith, and this is when what should make sense, no longer does. In most cases, we see silver’s daily outperformance, but at times the emotional reaction of market participants could take a different form. This simply might have been the case yesterday.
If it wasn’t for the two apex-based reversals, the interpretation of mining stocks strong daily performance would have been bullish, but in light of the former, it really isn’t.
The other of the two apex-based reversals is today, so the weirdness could continue.
Before moving to the details of yesterday’s session in various parts of the precious metals market, please note that that the above-mentioned turning points have so far worked in the correct order, but both were 1 day early. Silver reversal should have taken place yesterday and we saw it on Tuesday, while gold’s reversal should be seen today and so far the biggest reversal took place yesterday. Consequently, perhaps we made a slight error when reading the chart of the Stockcharts system which was slightly off when showing where the two lines of the triangle cross, and the reversals have already worked just like they should.
Having said that, let’s move to the daily moves.
The USD Index’s Reversal
In short, the USD Index continues to move back and forth between the rising support line and the 38.2% Fibonacci retracement and thus our previous comments remain up-to-date:
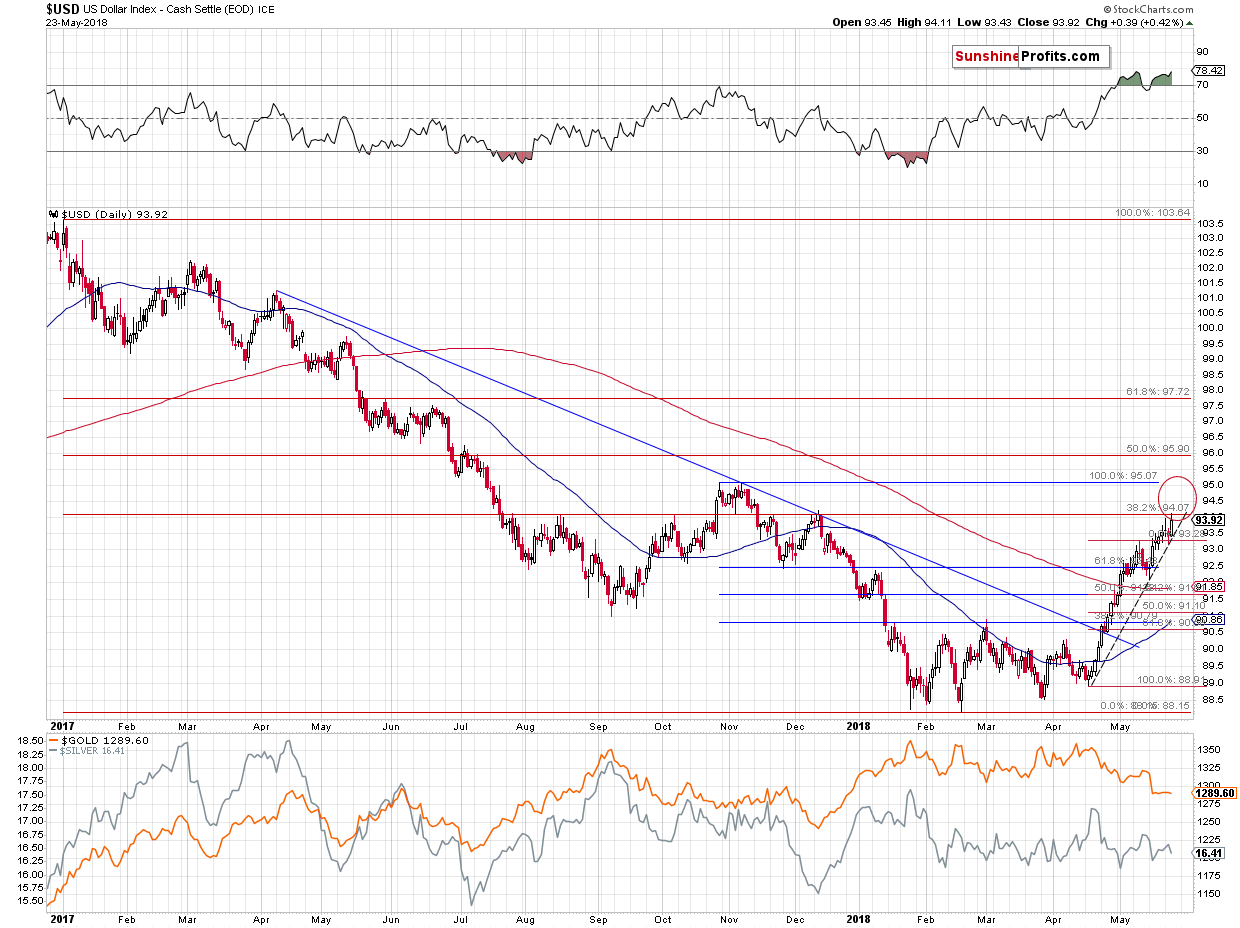
We previously wrote that the next two target prices for the USD Index were at about 94 and 95. The former is provided by December 2017 top and the latter is based on the October / November top. The 94 level seems more important as it is strengthened by the August and early October tops and the 38.2% Fibonacci retracement level.
The USD Index just moved to the lower of the above-mentioned targets and thus in yesterday’s analysis we wrote that we can expect a corrective downswing. And it happened. Some may say that the corrective downswing was way too small to correct anything, but the king doesn’t agree. It is said that the context is king, and this phrase perfectly reflects what one needs to take into account right now.
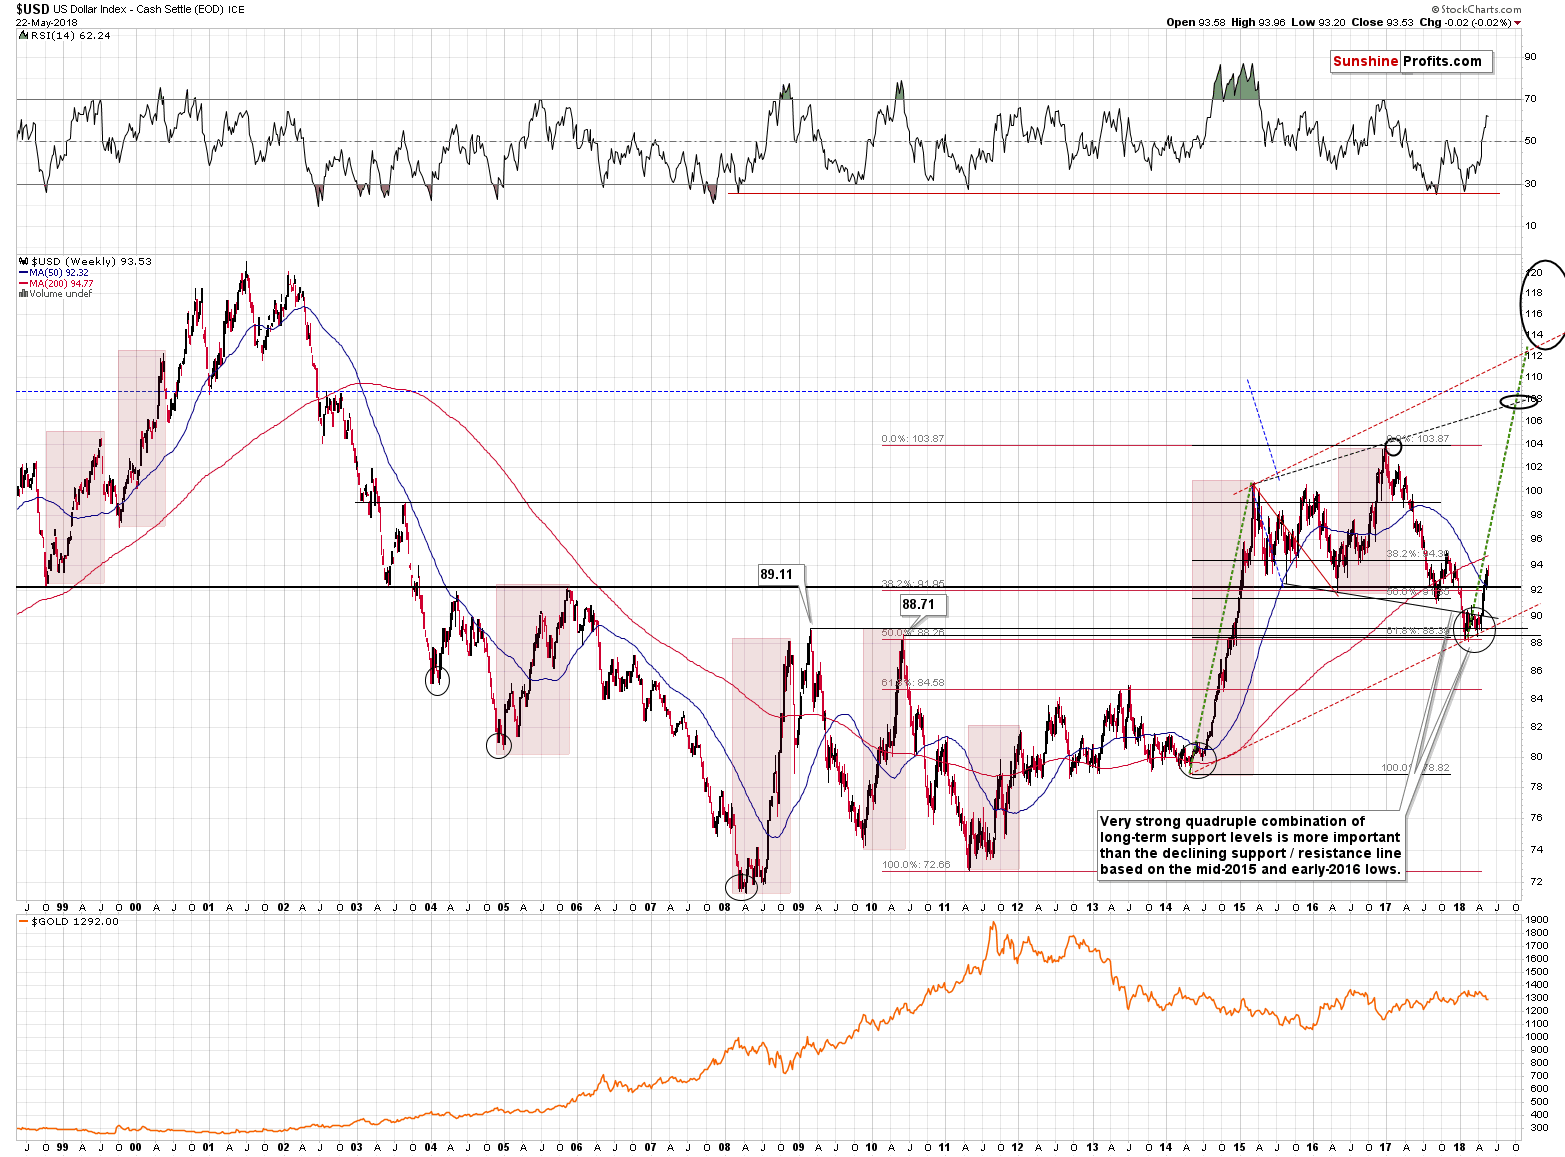
If the current rally in the USDX is to continue to be similar to the 2014 one (and this seems likely in our view), then we shouldn’t expect a major weakness anytime soon.
Surely, there will be some local pullbacks, but most likely nothing that’s particularly visible from the long-term point of view.
Moreover, please note that the RSI is not yet overbought from the long-term point of view and back in 2014 and 2015 the rally didn’t end even when it was extremely overbought.
So, should we really expect a major decline in the USD Index shortly? Not really. The short-term USD chart includes a rising dashed support line that’s based on the most recent local bottoms. It was just reached, so perhaps the decline that was likely to be seen based on the 94 level, has already taken place.
This means that we shouldn’t count on a big upswing in metals and miners just because USD’s rally in the past few weeks has been big and sharp.
Gold’s Upside Target
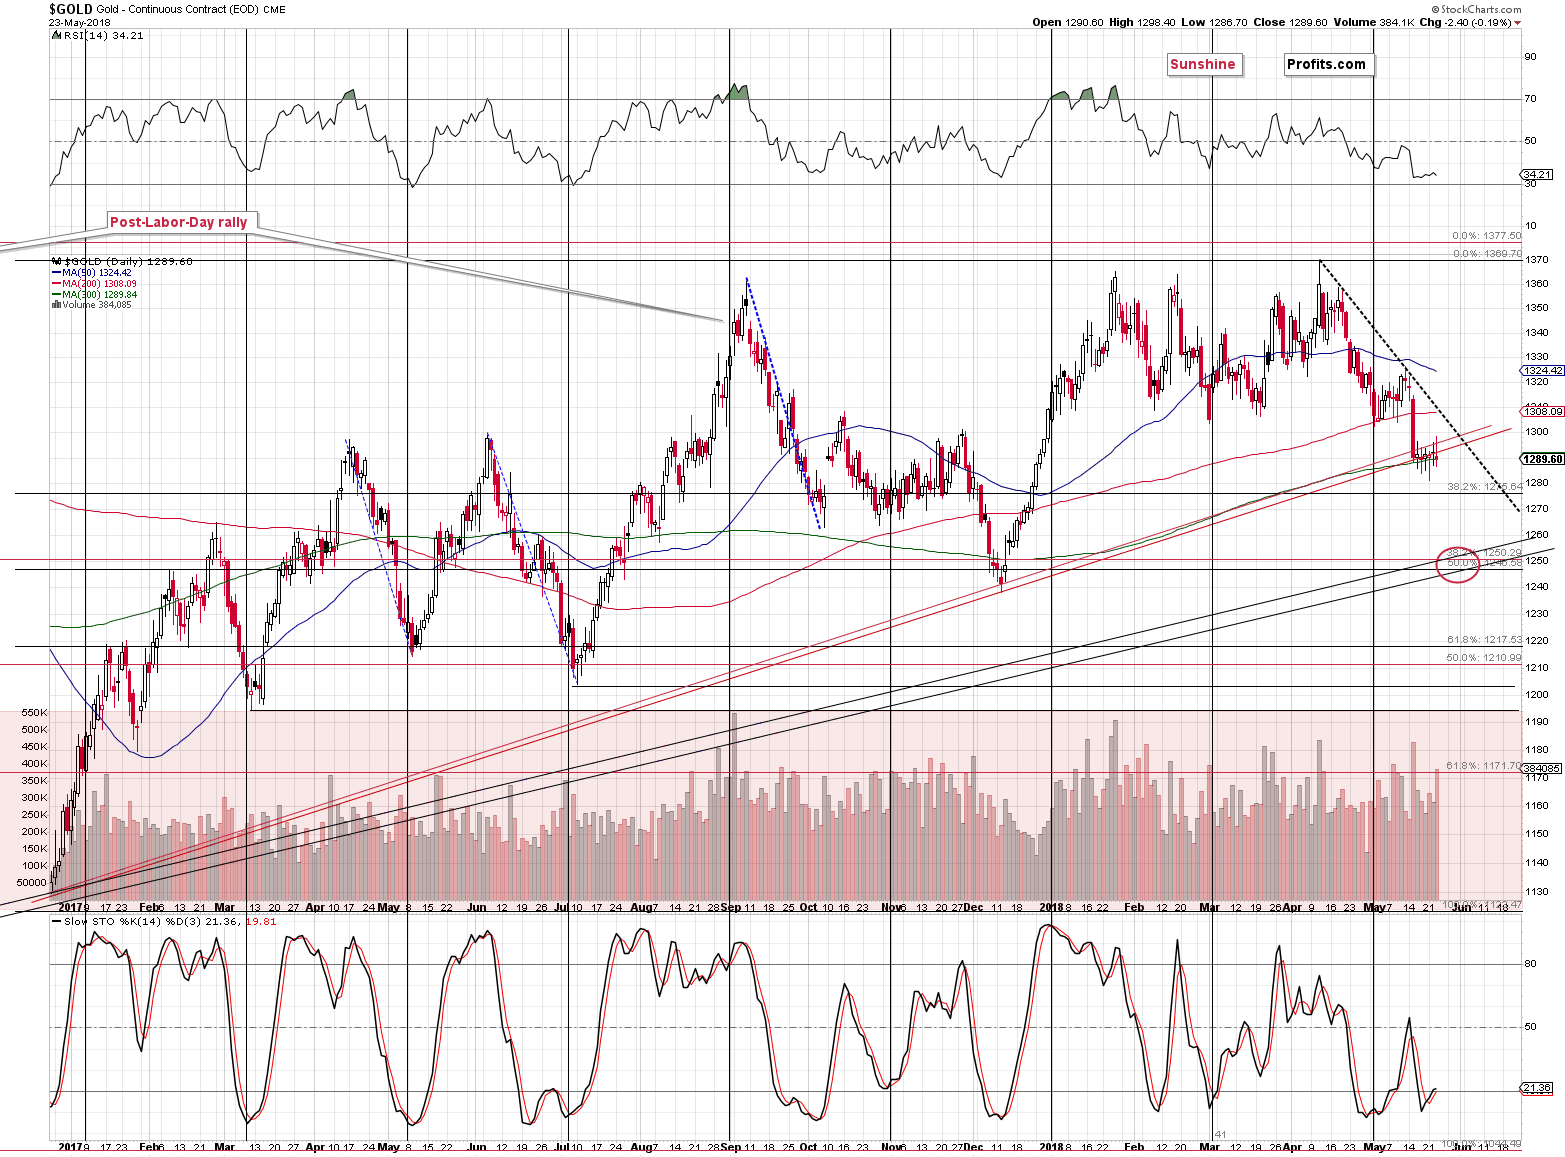
Gold moved higher on an intraday basis and lower in terms of closing prices. In other words, we saw a bearish reversal and it was confirmed by relatively big volume. This may have been the final reversal but let’s keep in mind the possibility that gold still moves higher, to the declining dashed resistance line. At this time the latter points to resistance at about $1,308. The additional resistance is provided by the previous lows between $1,303 and $1,309. Consequently, we may be looking at a rally of maximum $12 - $19.
Just as the possible rally didn’t appear tradable based on the signals that we saw previously, it doesn’t appear tradable today:
This may appear tradable at first sight, but let’s keep in mind that this level could be reached on an intraday or overnight basis only and that the follow-up move could be very sharp (note the early October 2016 decline that happened from more or less the same price levels).
Silver’s Topping Pattern
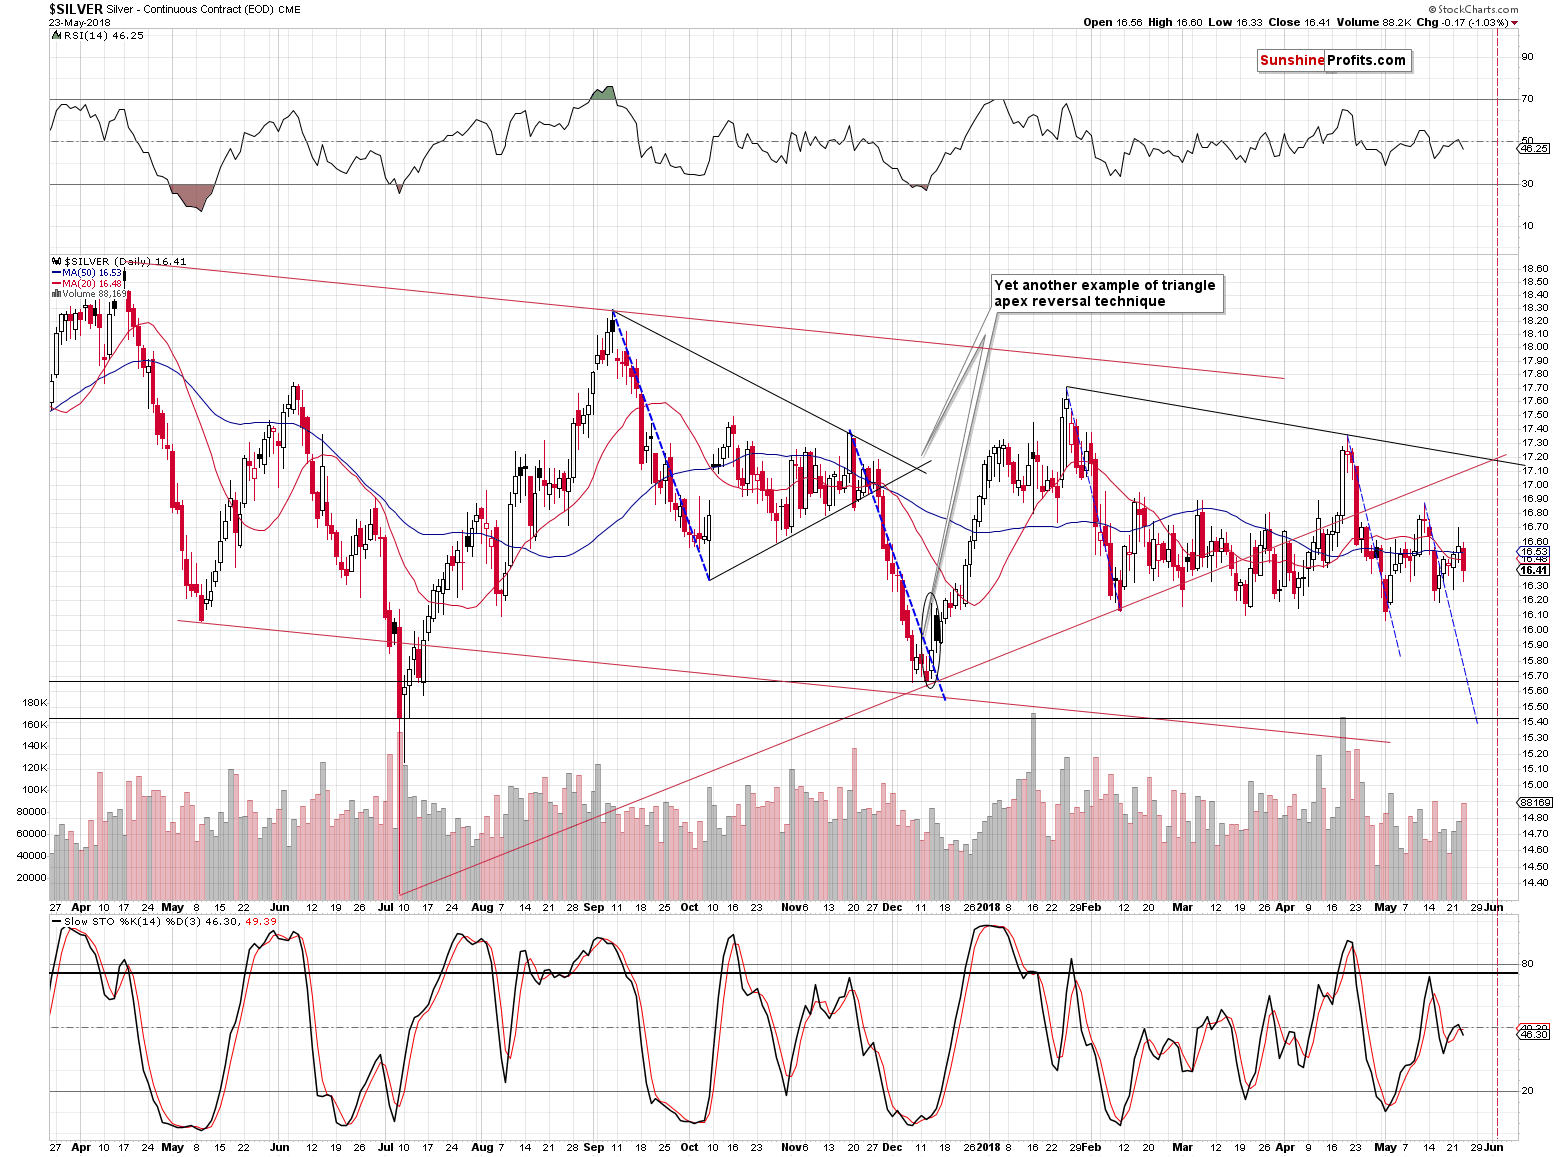
Silver declined after having outperformed gold for a few days, which usually means that the top is already in. The rising volume during the decline confirmed the bearish implications of the recent performance of the white metal. At the same time, our yesterday’s comments on the next bottom remain up-to-date:
Before moving to mining stocks, we would like to point out the fact that there is a medium-term apex-based reversal close to the end of the month, so if the decline starts shortly (today or tomorrow), then we can expect to see another turnaround in a week’s time.
Mining Stocks Bullish Rally
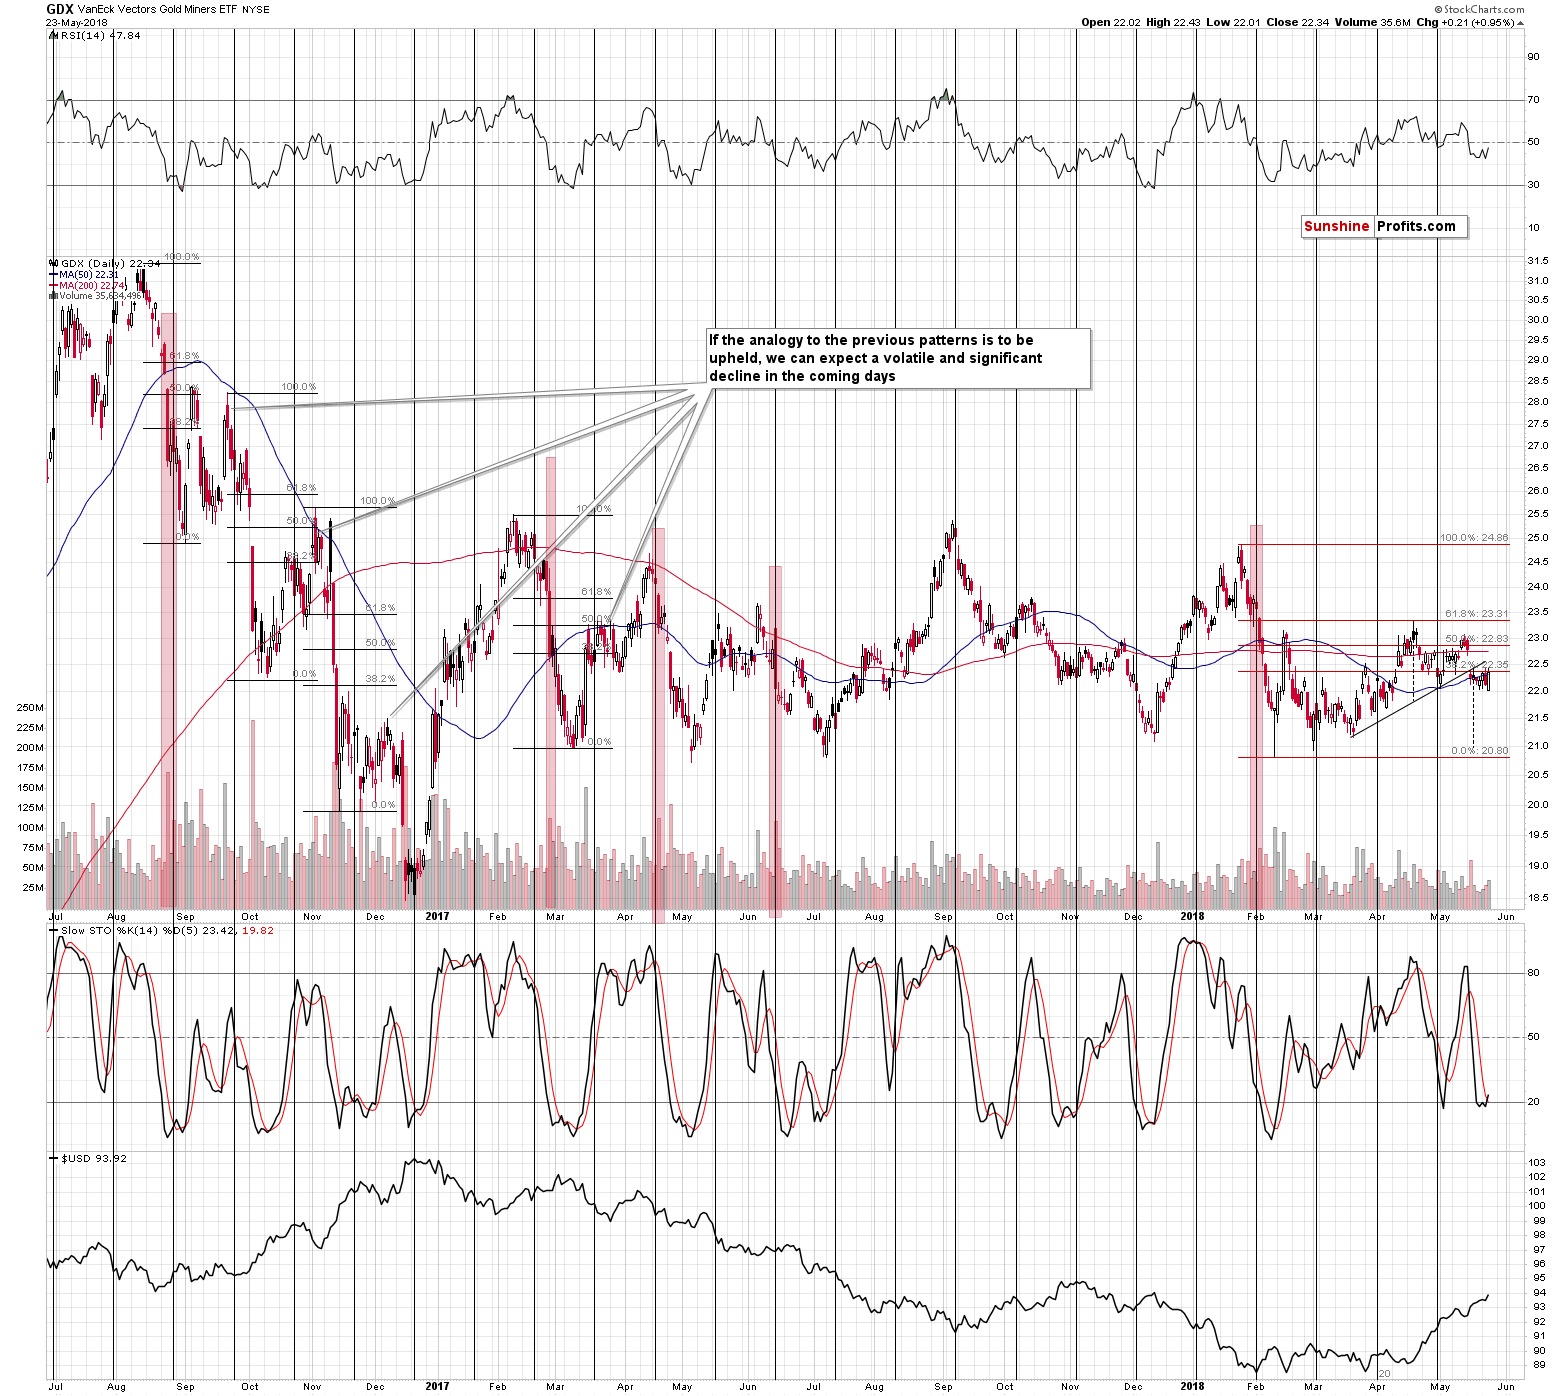
In just one day the very short-term implications of the above chart have turned around from being bearish to bullish. Mining stocks moved higher on big volume despite gold decline in terms of daily closing prices. Normally, this would be a very bullish sign, but since we are in the reversal mode and the turning points are in play, it could simply be a very short-term trick or anomaly. In other words, it doesn’t seem like a good time for one to trust a single-day signal.
Besides, the mining stocks didn’t move back above the 38.2% Fibonacci retracement nor the rising neck level of the bearish head-and-shoulders pattern.
Consequently, just like one swallow does not make a summer, one day of strength in the mining stocks doesn’t necessarily change the outlook for the entire precious metals sector.
Summary
Summing up, based on Monday’s and yesterday’s sessions, as well as gold’s and silver’s apex-based turning points, it seems that we’ll either see a decline in the precious metals market shortly (before the end of this week). Based on the current medium-term trend and the strength of the signals that confirm it, along with the doubtful strength of the possible upswing before the decline, it seems that it’s justified to keep the current speculative short positions intact.
As always, we will keep you – our subscribers – informed.
To summarize:
Trading capital (supplementary part of the portfolio; our opinion): Full short positions (200% of the full position) in gold, silver and mining stocks are justified from the risk/reward perspective with the following stop-loss orders and initial target price levels:
- Gold: initial target price: $1,251; stop-loss: $1,382; initial target price for the DGLD ETN: $48.88; stop-loss for the DGLD ETN $37.48
- Silver: initial target price: $15.73; stop-loss: $18.06; initial target price for the DSLV ETN: $27.58; stop-loss for the DSLV ETN $19.17
- Mining stocks (price levels for the GDX ETF): initial target price: $21.03; stop-loss: $23.54; initial target price for the DUST ETF: $28.88; stop-loss for the DUST ETF $21.16
In case one wants to bet on junior mining stocks' prices (we do not suggest doing so – we think senior mining stocks are more predictable in the case of short-term trades – but if one wants to do it anyway, we provide the details), here are the stop-loss details and initial target prices:
- GDXJ ETF: initial target price: $30.62; stop-loss: $36.14
- JDST ETF: initial target price: $59.68 stop-loss: $40.86
Long-term capital (core part of the portfolio; our opinion): No positions (in other words: cash)
Insurance capital (core part of the portfolio; our opinion): Full position
Important Details for New Subscribers
Whether you already subscribed or not, we encourage you to find out how to make the most of our alerts and read our replies to the most common alert-and-gold-trading-related-questions.
Please note that the in the trading section we describe the situation for the day that the alert is posted. In other words, it we are writing about a speculative position, it means that it is up-to-date on the day it was posted. We are also featuring the initial target prices, so that you can decide whether keeping a position on a given day is something that is in tune with your approach (some moves are too small for medium-term traders and some might appear too big for day-traders).
Plus, you might want to read why our stop-loss orders are usually relatively far from the current price.
Please note that a full position doesn’t mean using all of the capital for a given trade. You will find details on our thoughts on gold portfolio structuring in the Key Insights section on our website.
As a reminder – “initial target price” means exactly that – an “initial” one, it’s not a price level at which we suggest closing positions. If this becomes the case (like it did in the previous trade) we will refer to these levels as levels of exit orders (exactly as we’ve done previously). Stop-loss levels, however, are naturally not “initial”, but something that, in our opinion, might be entered as an order.
Since it is impossible to synchronize target prices and stop-loss levels for all the ETFs and ETNs with the main markets that we provide these levels for (gold, silver and mining stocks – the GDX ETF), the stop-loss levels and target prices for other ETNs and ETF (among other: UGLD, DGLD, USLV, DSLV, NUGT, DUST, JNUG, JDST) are provided as supplementary, and not as “final”. This means that if a stop-loss or a target level is reached for any of the “additional instruments” (DGLD for instance), but not for the “main instrument” (gold in this case), we will view positions in both gold and DGLD as still open and the stop-loss for DGLD would have to be moved lower. On the other hand, if gold moves to a stop-loss level but DGLD doesn’t, then we will view both positions (in gold and DGLD) as closed. In other words, since it’s not possible to be 100% certain that each related instrument moves to a given level when the underlying instrument does, we can’t provide levels that would be binding. The levels that we do provide are our best estimate of the levels that will correspond to the levels in the underlying assets, but it will be the underlying assets that one will need to focus on regarding the signs pointing to closing a given position or keeping it open. We might adjust the levels in the “additional instruments” without adjusting the levels in the “main instruments”, which will simply mean that we have improved our estimation of these levels, not that we changed our outlook on the markets. We are already working on a tool that would update these levels on a daily basis for the most popular ETFs, ETNs and individual mining stocks.
Our preferred ways to invest in and to trade gold along with the reasoning can be found in the how to buy gold section. Additionally, our preferred ETFs and ETNs can be found in our Gold & Silver ETF Ranking.
As a reminder, Gold & Silver Trading Alerts are posted before or on each trading day (we usually post them before the opening bell, but we don't promise doing that each day). If there's anything urgent, we will send you an additional small alert before posting the main one.
=====
Latest Free Trading Alerts:
The message from the recent FOMC minutes is clear: brace yourself for the interest rate hike next month. Should gold bulls be worried? Gold’s reaction shows that not necessarily. You will find more details in our today’s analysis.
June Hike Is Coming. Will Gold Survive?
Stocks were gaining on Wednesday following lower opening of the trading session. Is this an upward reversal or just another move up within two-week-long consolidation? Bulls are happier today, but there are still two possible medium-term scenarios.
Higher Again, but Still No Breakout
=====
Hand-picked precious-metals-related links:
PRECIOUS-Gold prices hold gains in wake of weaker dollar
X-Ray Technology Is Speeding Up the Search for Hidden Gold
When Franklin Roosevelt Dropped a Bombshell on Gold
Freeport’s Grasberg jujitsu move will pay off
=====
In other news:
Fed Sees Next Hike Soon, Signals Modest Inflation Overshoot OK
Fed and Bank of England tell markets to step up shift from Libor
U.S. launches auto import probe, China says will defend interests
Argentines brace for crisis as nation again seeks IMF help
U.S. Launches Criminal Probe into Bitcoin Price Manipulation
'Biggest' change in oil market history: Crude prices set to soar ahead of shipping revolution
=====
Thank you.
Sincerely,
Przemyslaw Radomski, CFA
Founder, Editor-in-chief, Gold & Silver Fund Manager
Gold & Silver Trading Alerts
Forex Trading Alerts
Oil Investment Updates
Oil Trading Alerts

