

Briefly: in our opinion, full (300% of the regular position size) speculative short positions in mining stocks are justified from the risk/reward point of view at the moment of publishing this Alert.
The USD Index just moved below its most recent lows and is only starting to move back up at the moment of writing these words. Gold rallied, but didn't move to - let alone above - it's mid-August high. This underperformance suggests that the gold market is really waiting for the negative trigger to decline profoundly. It just got another bullish trigger and it reacted in a limited way.
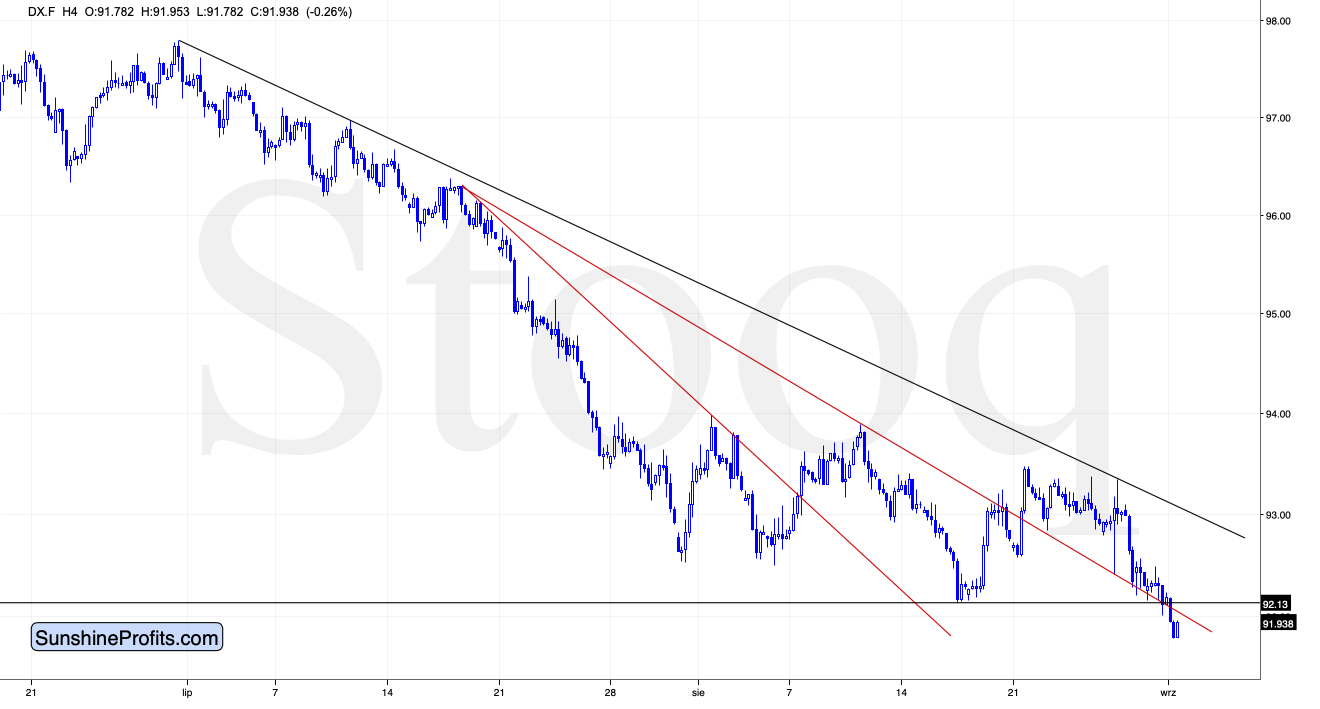
The move below the mid-August low in the USD Index is a very recent and likely a very temporary development. Let's keep in mind that long-term USD Index chart. Combining the above with the - more important - long-term picture, it seems likely that the USDX will invalidate the breakdown shortly.
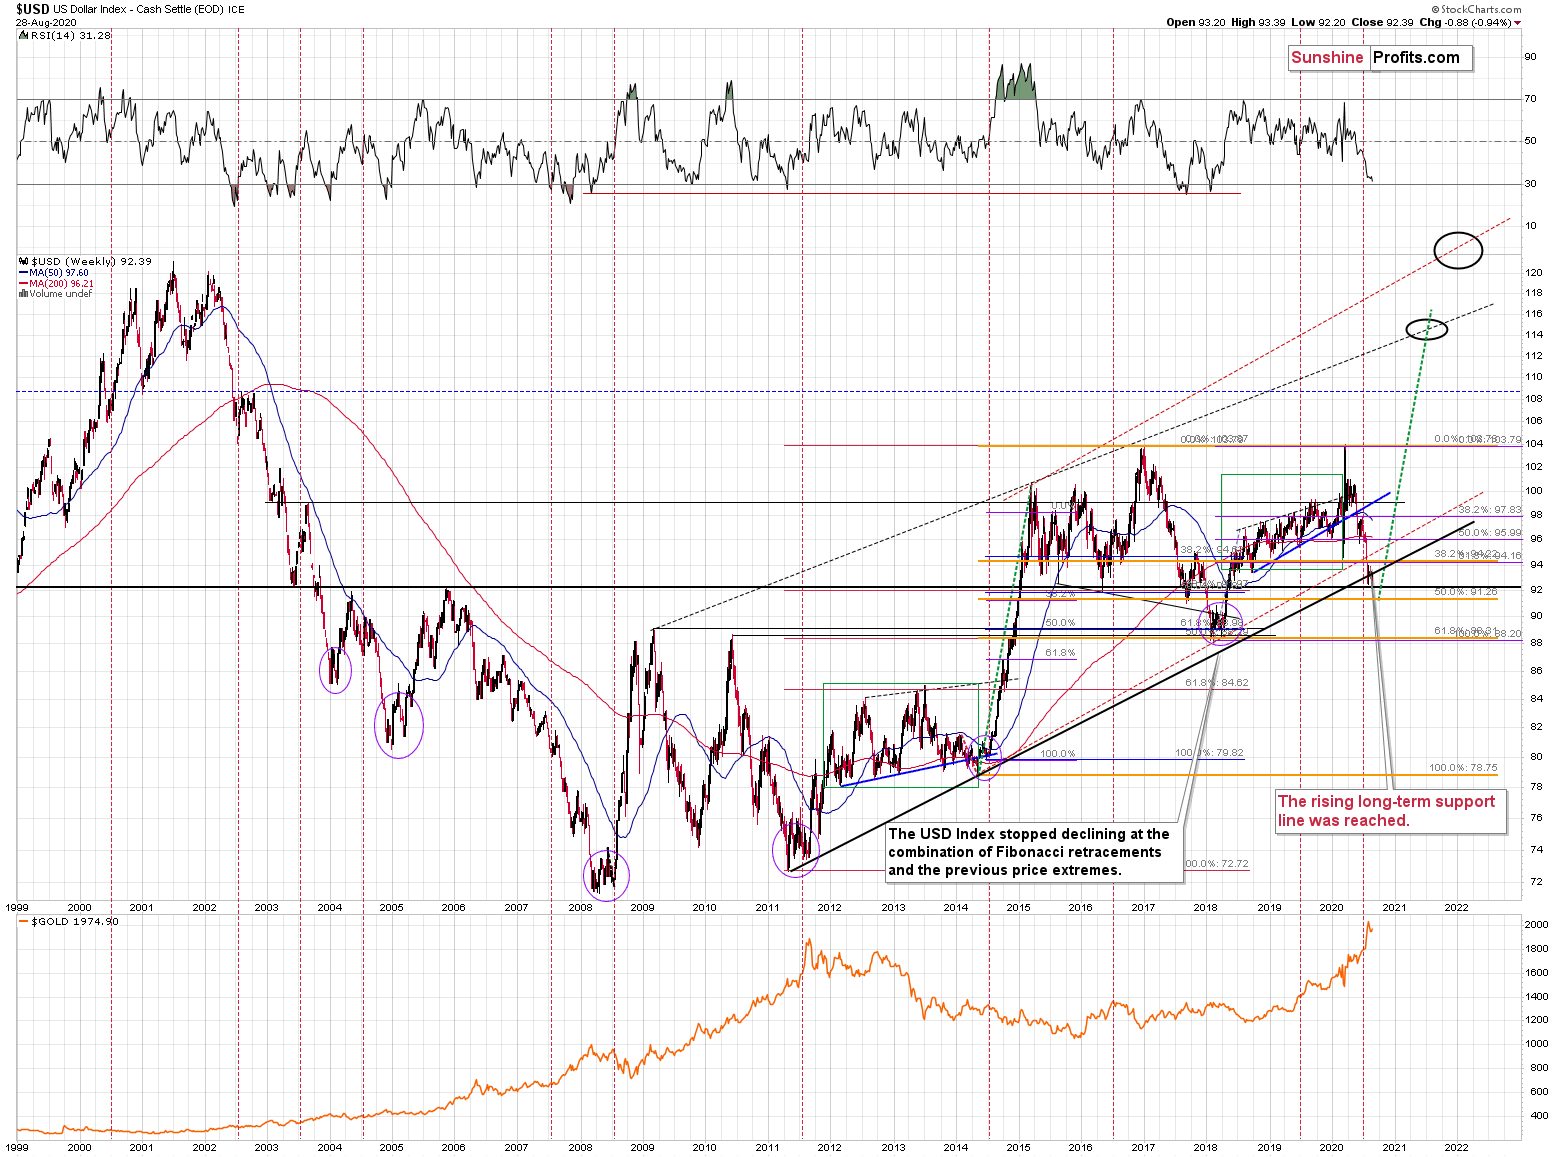
Remember when in early 2018 we wrote that the USD Index was bottoming due to a very powerful combination of support levels? Practically nobody wanted to read that as everyone "knew" that the USD Index is going to fall below 80. We were notified that people were hating on us in some blog comments for disclosing our opinion - that the USD Index was bottoming, and gold was topping. People were very unhappy with us writing that day after day, even though the USD Index refused to soar, and gold was not declining.
Well, it's the same right now.
The USD Index is at a powerful combination of support levels. One of them is the rising, long-term, black support line that's based on the 2011 and 2014 bottoms.
The other major, long-term factor is the proximity to the 92 level - that's when gold topped in 2004, 2005, and where it - approximately - bottomed in 2015, and 2016.
The USDX just moved to these profound support levels, and it's very oversold on a short-term basis. It all happened in the middle of the year, which is when the USDX formed major bottoms on many occasions. This makes a short-term rally here very likely.
While it might not be visible at the first sight (you can click on the chart to enlarge it), the USD Index moved briefly below the long-term, black support line and then it invalidated this breakdown before the end of the week. This is a very bullish indication for the next few weeks.
Based on the most recent price moves, the USDX is once again below the above-mentioned strong rising support line, but we doubt that this breakdown would hold. We expect to see an invalidation thereof that is followed by a rally.
Please note that the major bottoms in the USD Index that formed in the middle of previous years often took form of broad bottoms. Consequently, the current back and forth trading is not that surprising. This includes the 2008, 2011, and 2018 bottoms.
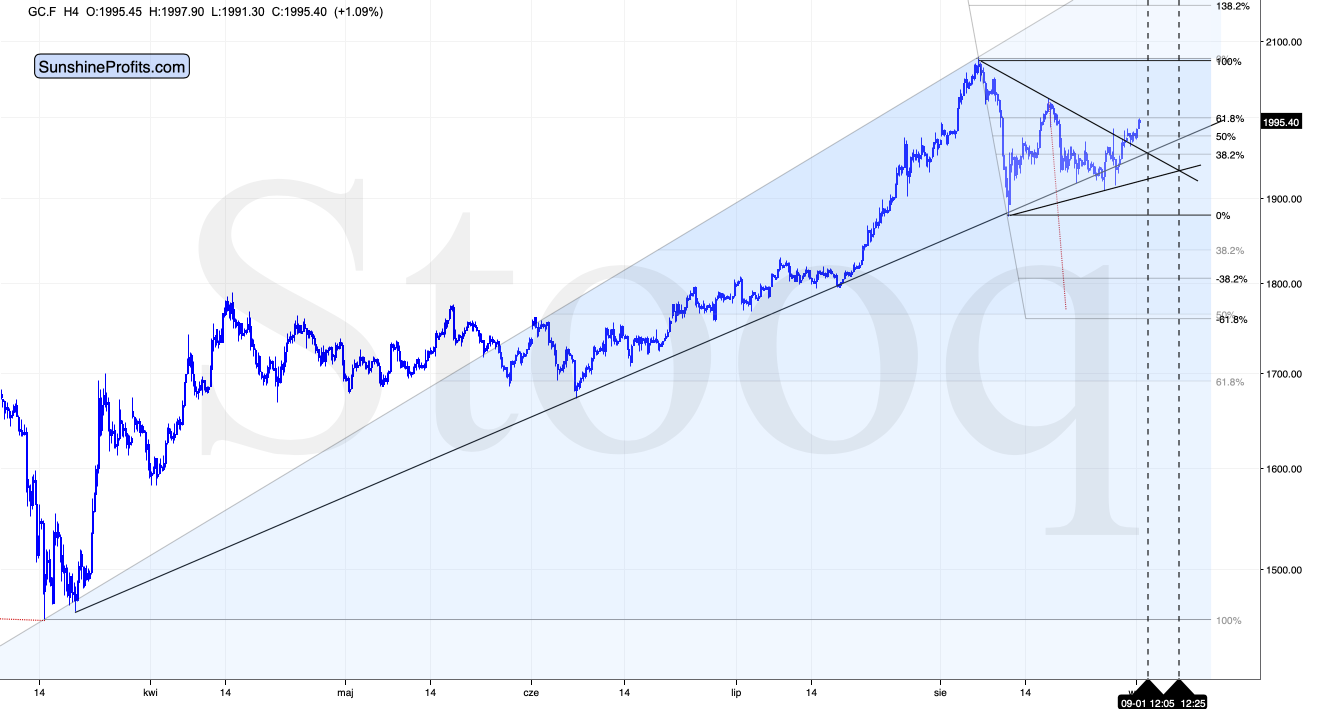
Yesterday, we wrote that gold corrected about 61.8% of the preceding (mid-August - late-August) downswing, which was still similar to how it performed in March. Gold moved a bit higher in the overnight trading, meaning that it moved above the above-mentioned 61.8% retracement.
Still, the more important (based on a more profound move - the early-August decline) 61.8% Fibonacci retracement was just reached, without being broken. Consequently, the overnight rally was not as bullish as it may seem at first sight. Moreover, let's keep in mind that gold is just before the first of the triangle-vertex based turning points, which means that it's likely to reverse shortly. Since the preceding move was to the upside, gold is likely just before a top.
In yesterday's analysis, we wrote the following:
Also, as you can see on the chart above, there's a vertex-based reversal "scheduled" for the next several days. In fact, there are two such reversals. This means that if gold's recent upswing is likely to be reversed rather sooner than later. A tiny move below the previous lows in the USD Index and then its profound invalidation would serve as a perfect trigger for gold's decline.
It seems that we might see exactly what we wrote above.
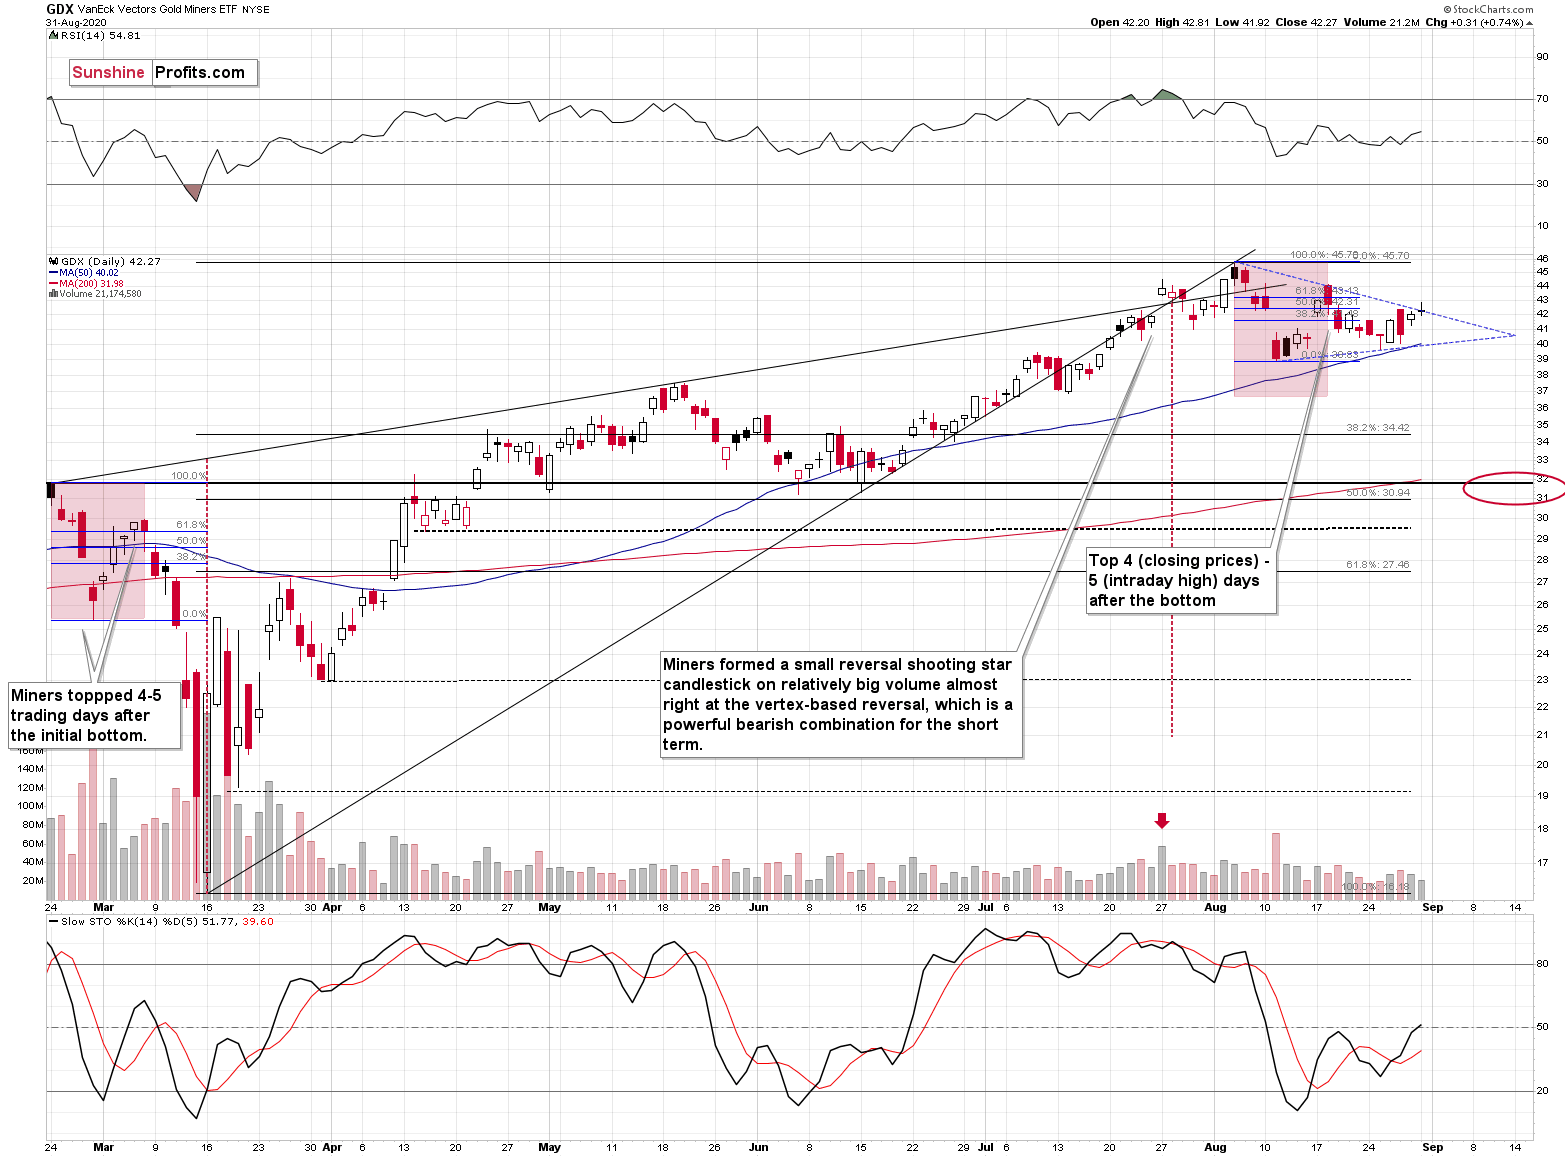
While gold moved above its declining resistance line based on the previous highs, miners didn't. This means that nothing really changed in case of miners' technical picture and our previous comments remain up-to-date:
Now, since the general stock market moved above the previous highs and continues to rally, we might or might not see a sizable decline early this week. Back in March, the slide in miners corresponded to the decline in the general stock market, and this could be repeated, or we could see some sideways trading after the slide resumes, once stocks finally decline.
That's exactly what happened. The general stock market continued to move higher, and mining stocks have been trading sideways instead of declining - or rallying. Before miners' pause (and S&P's breakout) miners were repeating their late-February and early-March performance. The implications of the self-similar pattern were bearish and they continue to be bearish, only the timing changed.
Overview of the Upcoming Decline
As far as the current overview of the upcoming decline is concerned, I think that it has already begun, at least in case of the mining stocks. It's still relatively unclear if gold makes another attempt to move to new highs before plunging below $1,800, but it now appears more likely that it won't.
During the final part of the slide, we expect silver to decline more than miners. That would be in tune with how the markets initially reacted to the Covid-19 threat.
The impact of all the new rounds of money printing in the U.S. and Europe on the precious metals prices is very positive in the long run, but it doesn't make the short-term decline unlikely. In the very near term, markets can and do get ahead of themselves and then need to decline - sometimes very profoundly - before continuing their upward march.
Summary
Summing up, it seems that after reversing $4 above our upside target, gold has finally topped, and that it formed the second top from the double-top pattern in mid-August. The USD Index appears to be forming a broad bottom, just like it did in 2008, 2011, and 2018. It's worth keeping in mind that while the USDX just moved slightly below its recent lows, gold didn't move to its recent highs. This relative underperformance, along with the specific juncture at which the USD Index currently is, creates a very bearish environment for the precious metals market, especially for the mining stocks. The decline in the latter is likely to accelerate once the general stock market finally declines.
Naturally, everyone's trading is their responsibility, but in our opinion, if there ever was a time to either enter a short position in the miners or to increase its size if it wasn't already sizable, it's now. We made money on the March decline and on the March rebound, and it seems that another massive slide is about to start. When everyone is on one side of the boat, it's a good idea to be on the other side, and the Gold Miners Bullish Percent Index literally indicates that this is the case with mining stocks.
After the sell-off (that takes gold to about $1,700 or lower), we expect the precious metals to rally significantly. The final decline might take as little as 1-6 weeks, so it's important to stay alert to any changes.
Most importantly - stay healthy and safe. We made a lot of money on the March decline and the subsequent rebound (its initial part) price moves (and we'll likely make much more in the following weeks and months), but you have to be healthy to really enjoy the results.
As always, we'll keep you - our subscribers - informed.
To summarize:
Trading capital (supplementary part of the portfolio; our opinion): Full speculative short positions (300% of the full position) in mining stocks is justified from the risk to reward point of view with the following binding exit profit-take price levels:
Senior mining stocks (price levels for the GDX ETF): binding profit-take exit price: $32.02; stop-loss: none (the volatility is too big to justify a SL order in case of this particular trade); binding profit-take level for the DUST ETF: $28.73; stop-loss for the DUST ETF: none (the volatility is too big to justify a SL order in case of this particular trade)
Junior mining stocks (price levels for the GDXJ ETF): binding profit-take exit price: $42.72; stop-loss: none (the volatility is too big to justify a SL order in case of this particular trade); binding profit-take level for the JDST ETF: $21.22; stop-loss for the JDST ETF: none (the volatility is too big to justify a SL order in case of this particular trade)
For-your-information targets (our opinion; we continue to think that mining stocks are the preferred way of taking advantage of the upcoming price move, but if for whatever reason one wants / has to use silver or gold for this trade, we are providing the details anyway. In our view, silver has greater potential than gold does):
Silver futures downside profit-take exit price: unclear at this time - initially, it might be a good idea to exit, when gold moves to $1,703.
Gold futures downside profit-take exit price: $1,703
Long-term capital (core part of the portfolio; our opinion): No positions (in other words: cash
Insurance capital (core part of the portfolio; our opinion): Full position
Whether you already subscribed or not, we encourage you to find out how to make the most of our alerts and read our replies to the most common alert-and-gold-trading-related-questions.
Please note that the in the trading section we describe the situation for the day that the alert is posted. In other words, it we are writing about a speculative position, it means that it is up-to-date on the day it was posted. We are also featuring the initial target prices, so that you can decide whether keeping a position on a given day is something that is in tune with your approach (some moves are too small for medium-term traders and some might appear too big for day-traders).
Plus, you might want to read why our stop-loss orders are usually relatively far from the current price.
Please note that a full position doesn't mean using all of the capital for a given trade. You will find details on our thoughts on gold portfolio structuring in the Key Insights section on our website.
As a reminder - "initial target price" means exactly that - an "initial" one, it's not a price level at which we suggest closing positions. If this becomes the case (like it did in the previous trade) we will refer to these levels as levels of exit orders (exactly as we've done previously). Stop-loss levels, however, are naturally not "initial", but something that, in our opinion, might be entered as an order.
Since it is impossible to synchronize target prices and stop-loss levels for all the ETFs and ETNs with the main markets that we provide these levels for (gold, silver and mining stocks - the GDX ETF), the stop-loss levels and target prices for other ETNs and ETF (among other: UGLD, DGLD, USLV, DSLV, NUGT, DUST, JNUG, JDST) are provided as supplementary, and not as "final". This means that if a stop-loss or a target level is reached for any of the "additional instruments" (DGLD for instance), but not for the "main instrument" (gold in this case), we will view positions in both gold and DGLD as still open and the stop-loss for DGLD would have to be moved lower. On the other hand, if gold moves to a stop-loss level but DGLD doesn't, then we will view both positions (in gold and DGLD) as closed. In other words, since it's not possible to be 100% certain that each related instrument moves to a given level when the underlying instrument does, we can't provide levels that would be binding. The levels that we do provide are our best estimate of the levels that will correspond to the levels in the underlying assets, but it will be the underlying assets that one will need to focus on regarding the signs pointing to closing a given position or keeping it open. We might adjust the levels in the "additional instruments" without adjusting the levels in the "main instruments", which will simply mean that we have improved our estimation of these levels, not that we changed our outlook on the markets. We are already working on a tool that would update these levels on a daily basis for the most popular ETFs, ETNs and individual mining stocks.
Our preferred ways to invest in and to trade gold along with the reasoning can be found in the how to buy gold section. Additionally, our preferred ETFs and ETNs can be found in our Gold & Silver ETF Ranking.
As a reminder, Gold & Silver Trading Alerts are posted before or on each trading day (we usually post them before the opening bell, but we don't promise doing that each day). If there's anything urgent, we will send you an additional small alert before posting the main one.
Thank you.
Sincerely,
Przemyslaw Radomski, CFA
Editor-in-chief, Gold & Silver Fund Manager

