

Briefly: In our opinion, full (100% of the regular size of the position) speculative short positions in gold, silver and mining stocks are justified from the risk/reward perspective at the moment of publishing this alert.
Tuesday’s session was accompanied by volume that was the lowest this year, at least in gold. Yesterday’s volume was definitely not in line with that. We saw one of the biggest daily volumes of 2018 in gold, silver and mining stocks as the entire sector soared. It’s a clear buy signal in the eyes of many. But should something that appeals to almost everyone be automatically viewed as appealing?
In the final part of his 7th letter to Lucilius, Seneca writes the following:
Lay these up in your heart, my dear Lucilius, that you may scorn the pleasure that comes from the majority’s approval. The many speak highly of you, but have you really any grounds for satisfaction with yourself if you are the kind of person the many understand? Your merits should not be outward facing.
Answering our previous question: no – in the case of investments, the fact that something is popular or commonly viewed as something is definitely not enough to blindly accept it. We’ll analyze the situation thoroughly without telling the market what it should be doing in light of either popular beliefs, or our own trading positions. This way, we’ll get to the best conclusions.
Let’s get to work, starting with the gold chart (chart courtesy of http://stockcharts.com).
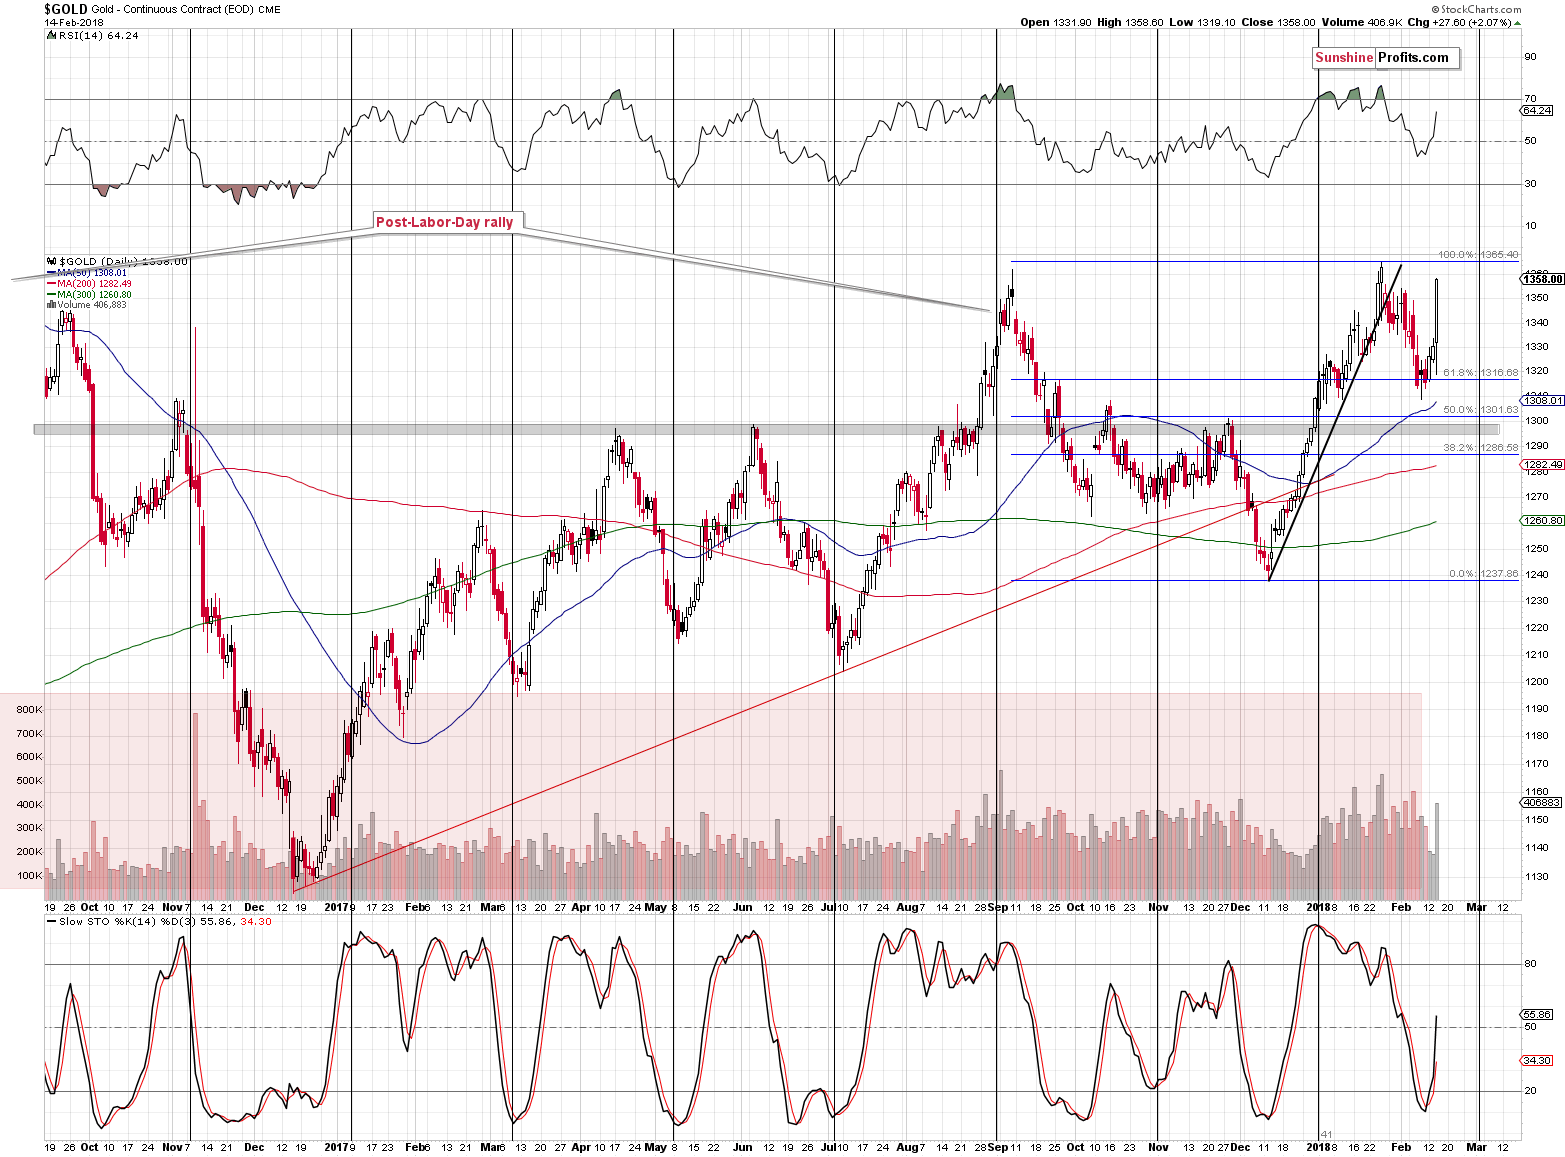
Gold moved to our upper target, and then moved even higher, ending the session between the September 2017 and January 2018 tops. The volume was not as high as it was in February, but it was definitely significant, and the session was very emotional overall. But, does it make the outlook bullish?
We have seen only a very small move above September high in terms of the closing prices and we’re still below the January high in terms of the closing prices. Gold is below both highs in terms of intraday highs. Gold approached the tops, but didn’t break above them. Gold didn’t break above other nearby tops either: the early 2016 high, and the 2014 high.
Is the above bullish or is it bearish as the resistance that is being reached is very significant? Looking at yesterday’s session alone, the situation appears very bullish, but taking off the emotional glasses allows us to see that this price level was approached many times and in each previous case in the last 4 years, such an attempt was followed by a sizable decline.
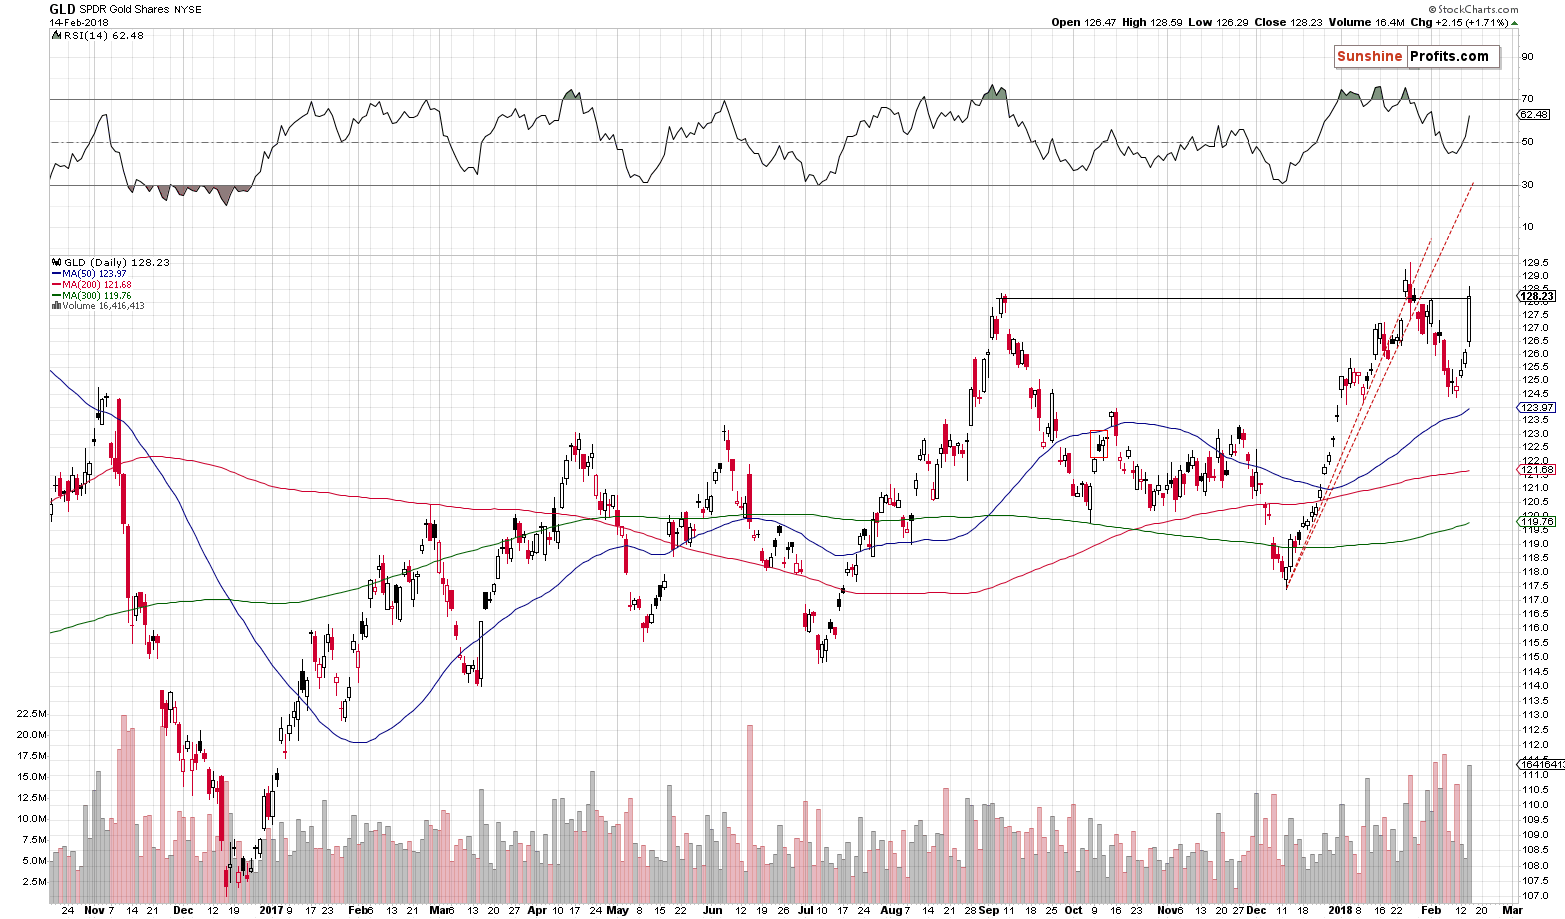
The GLD ETF chart shows the same thing. On the above chart it’s clear that we saw a tiny breakout above the September 2017 high in terms of the closing prices. Since it was tiny, it would need to be confirmed by additional closes above this level before it becomes meaningful.
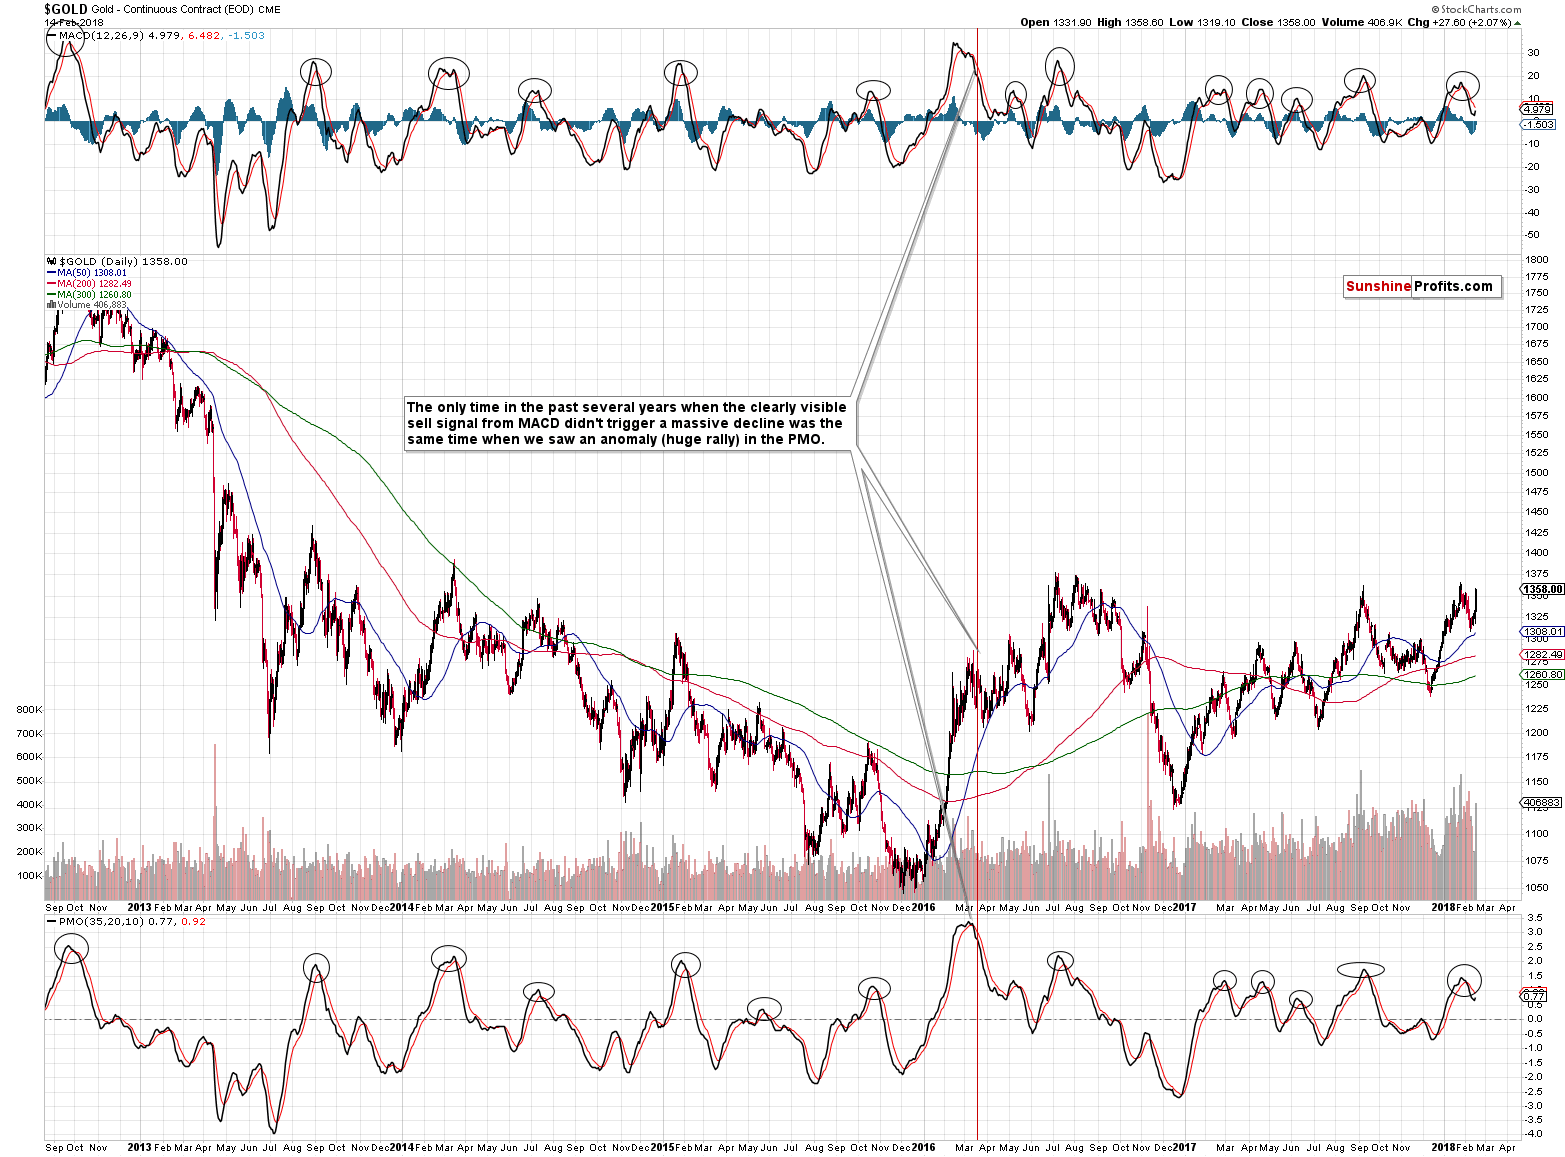
The medium-term sell signal from the MACD and PMO remain in play and looking at their efficiency in detecting major tops in the past should be enough to cool the emotions triggered by yesterday’s volatility.
Both indicators moved a bit higher based on yesterday’s rally, but they are still far from reaching their moving averages, let alone breaking above them. There was one case just like that in the past – in the middle of 2016. The second top in gold was formed just below the previous one and that was the moment that started the biggest decline of the year that took gold to almost $1,100. Does yesterday’s rally still appear very bullish? No.
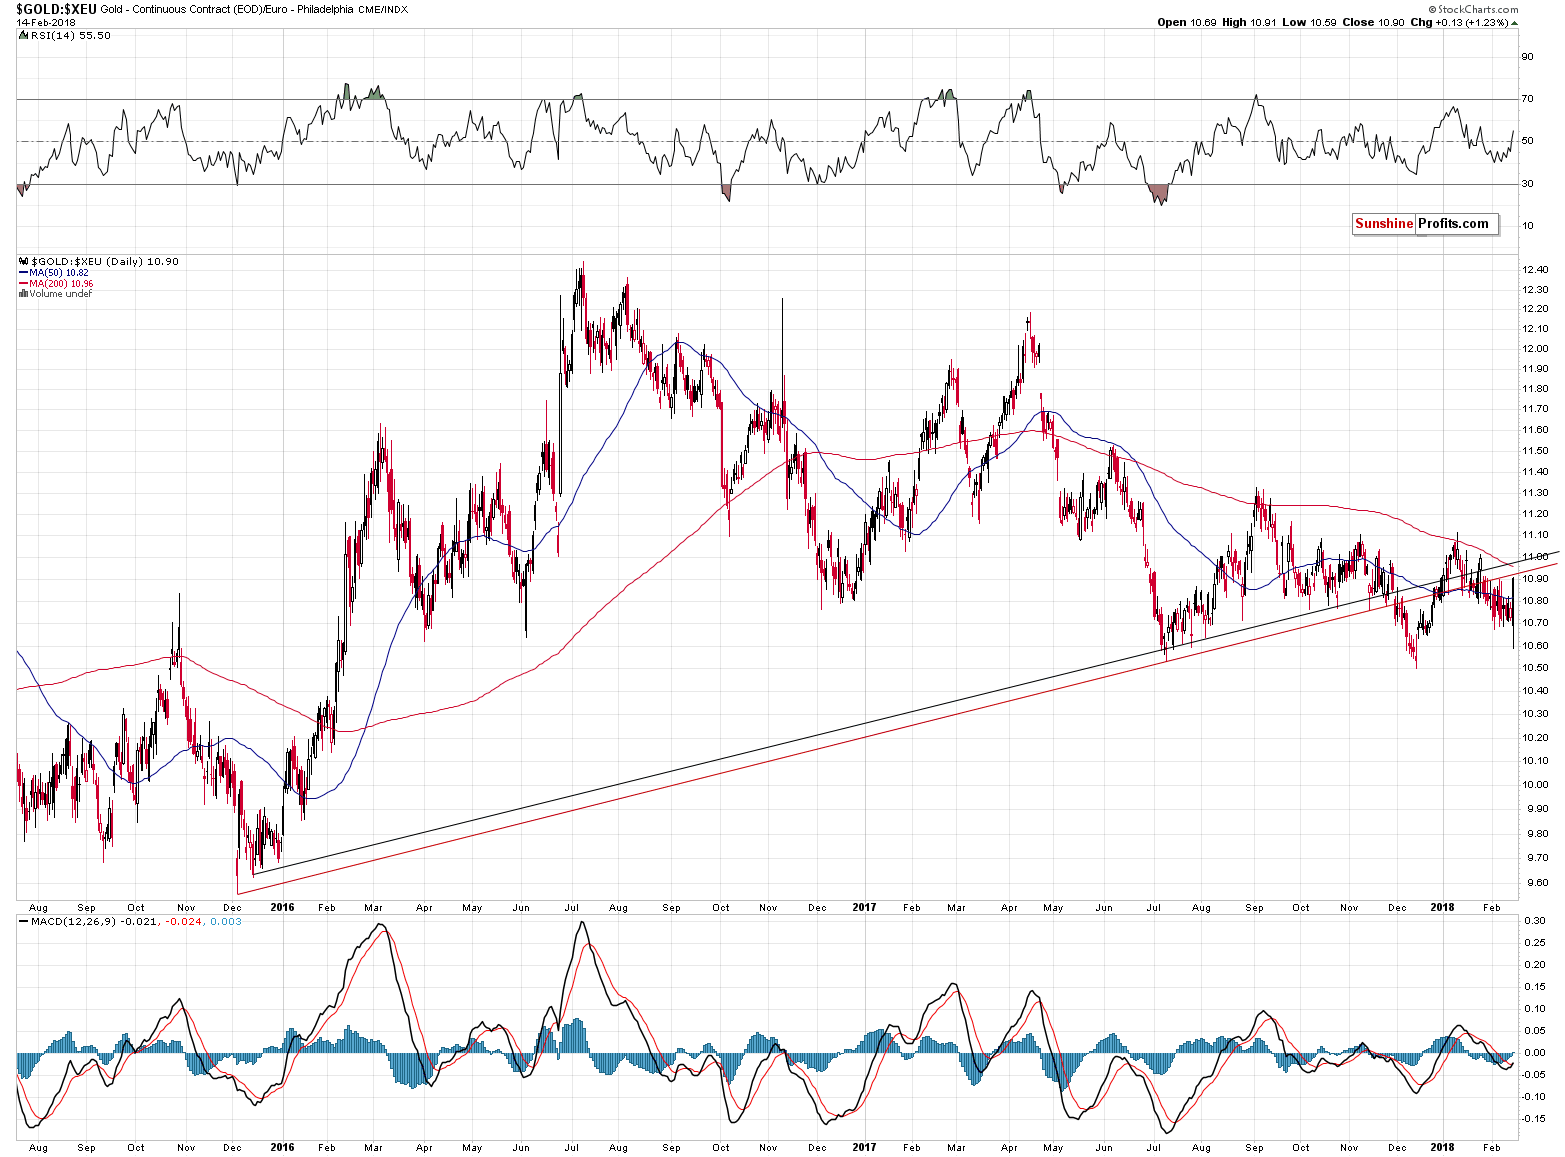
Gold finally showed strength against the USD Index yesterday. It moved higher more than it was likely to based on the decline in the USD Index. But, the upswing is well within the recent historical norms. The gold priced in the Euro moved higher yesterday, but the same was the case on January 24th and 25th. So, it’s not a game-changer.
Not only is that not a game-changer, but it can be viewed as a top-is-at-hand sign, because the mentioned January 24th and 25th sessions were topping sessions. These were also the only two daily closes above the September 2017 top. Interesting isn’t it? Gold moved to major resistance in a way that is very similar to its previous failed attempt of breaking higher. And yet, at the first sight this move appears to be bullish…
Back in January, there were 2 daily closes above the September top and the second one was the final top. Perhaps that’s what we’ll see today – the final top of this local rally.
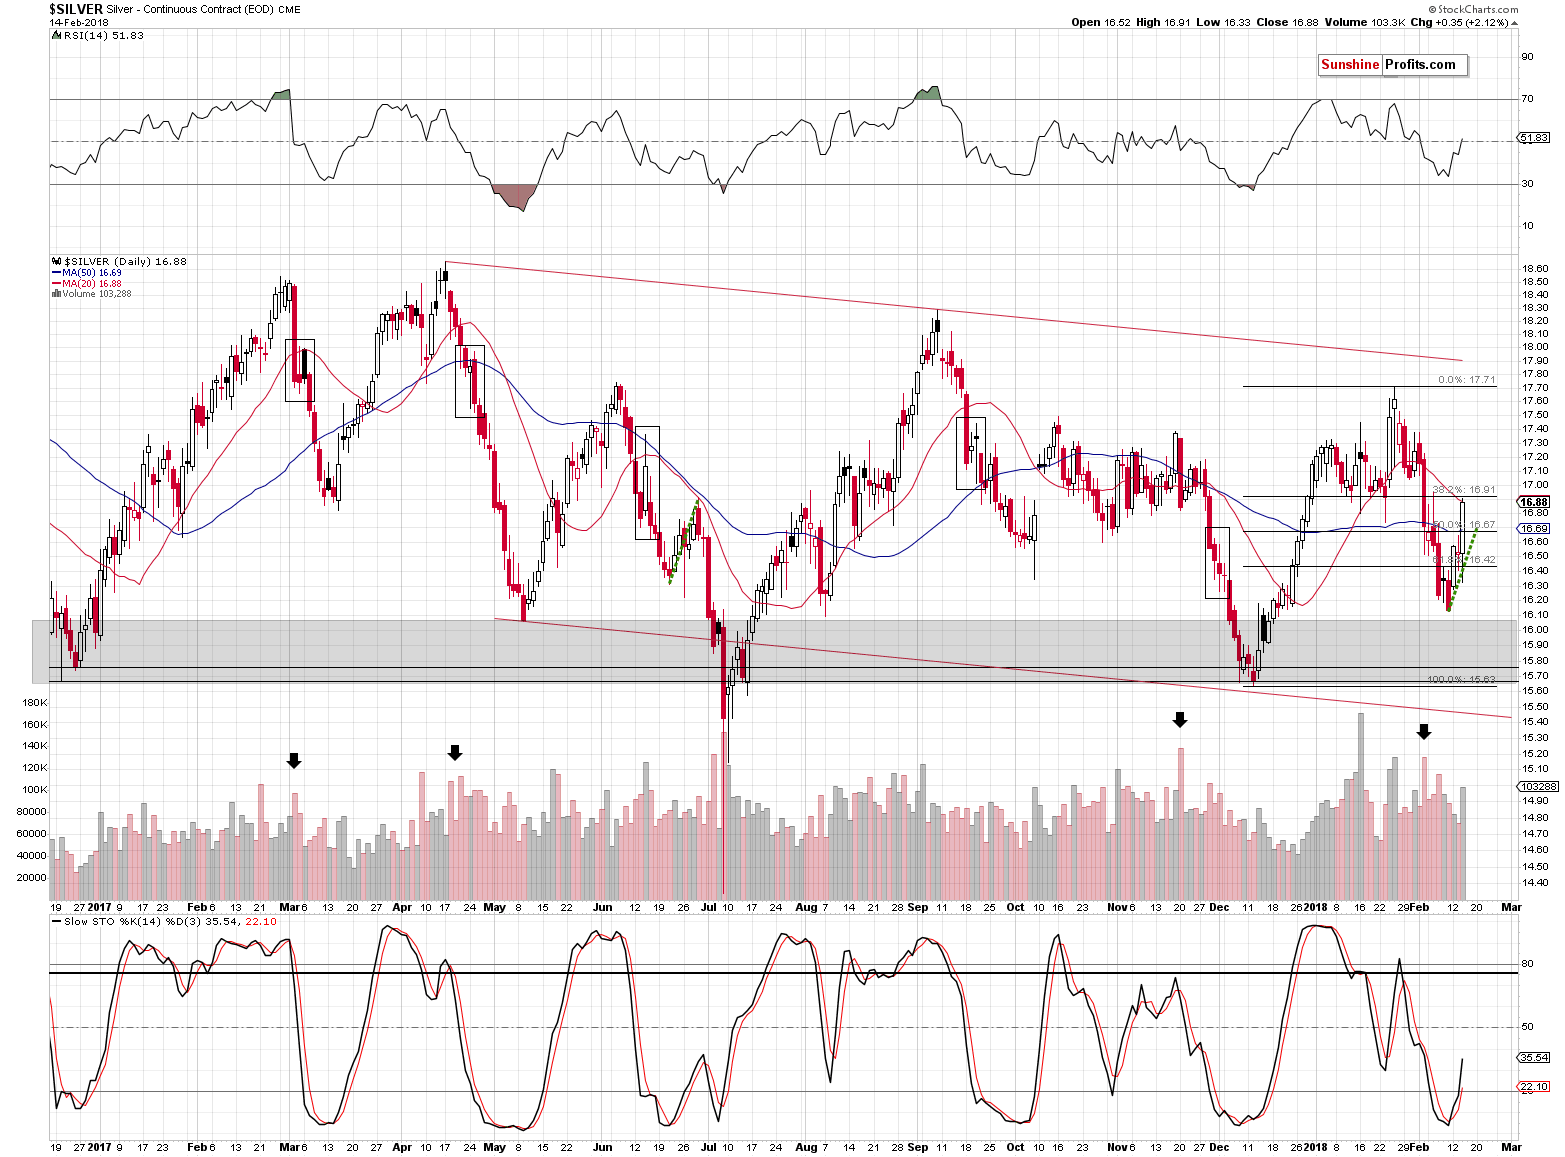
Just like gold, silver moved higher, and the volume was quite significant. Unlike gold, however, the white metal didn’t move close to its previous 2018 high – only to the 61.8% Fibonacci retracement and its 20-day moving average. The first is universally important (in all markets and, in this case, silver is not an exception), while the latter is a silver-specific thing. That’s a moving average that is not necessarily important for all markets, but silver tends to bounce off it during both rallies and declines.
Did silver reach its top for this rally? It’s possible, but it could very well be the case that we’ll see another upswing before the decline resumes. This could take the form of a daily upswing, as the one that we discussed when describing gold.
The latter scenario seems quite possible especially that we haven’t seen silver’s significant short-term outperformance which would serve as a strong bearish confirmation.
To be clear – the relationship between silver’s outperformance and tops is a one-way one. Tops can form without silver’s outperformance, so the lack of silver’s outperformance is not enough to make the outlook bullish – it’s neutral and other factors should be considered. But, if we see silver’s short-term outperformance and other factors are bearish as well, then their strength is multiplied.
That’s why we are not inclined to increase the size of the current short position, even though the outlook is bearish and the resistance level in gold is at hand.
In yesterday’s third alert, we wrote the following:
Today’s rally in the mining stocks may seem like the end of the world or at least like a tremendous change in the situation on the precious metals world. In reality, however, it’s something that we’ve seen multiple times - only not very recently.
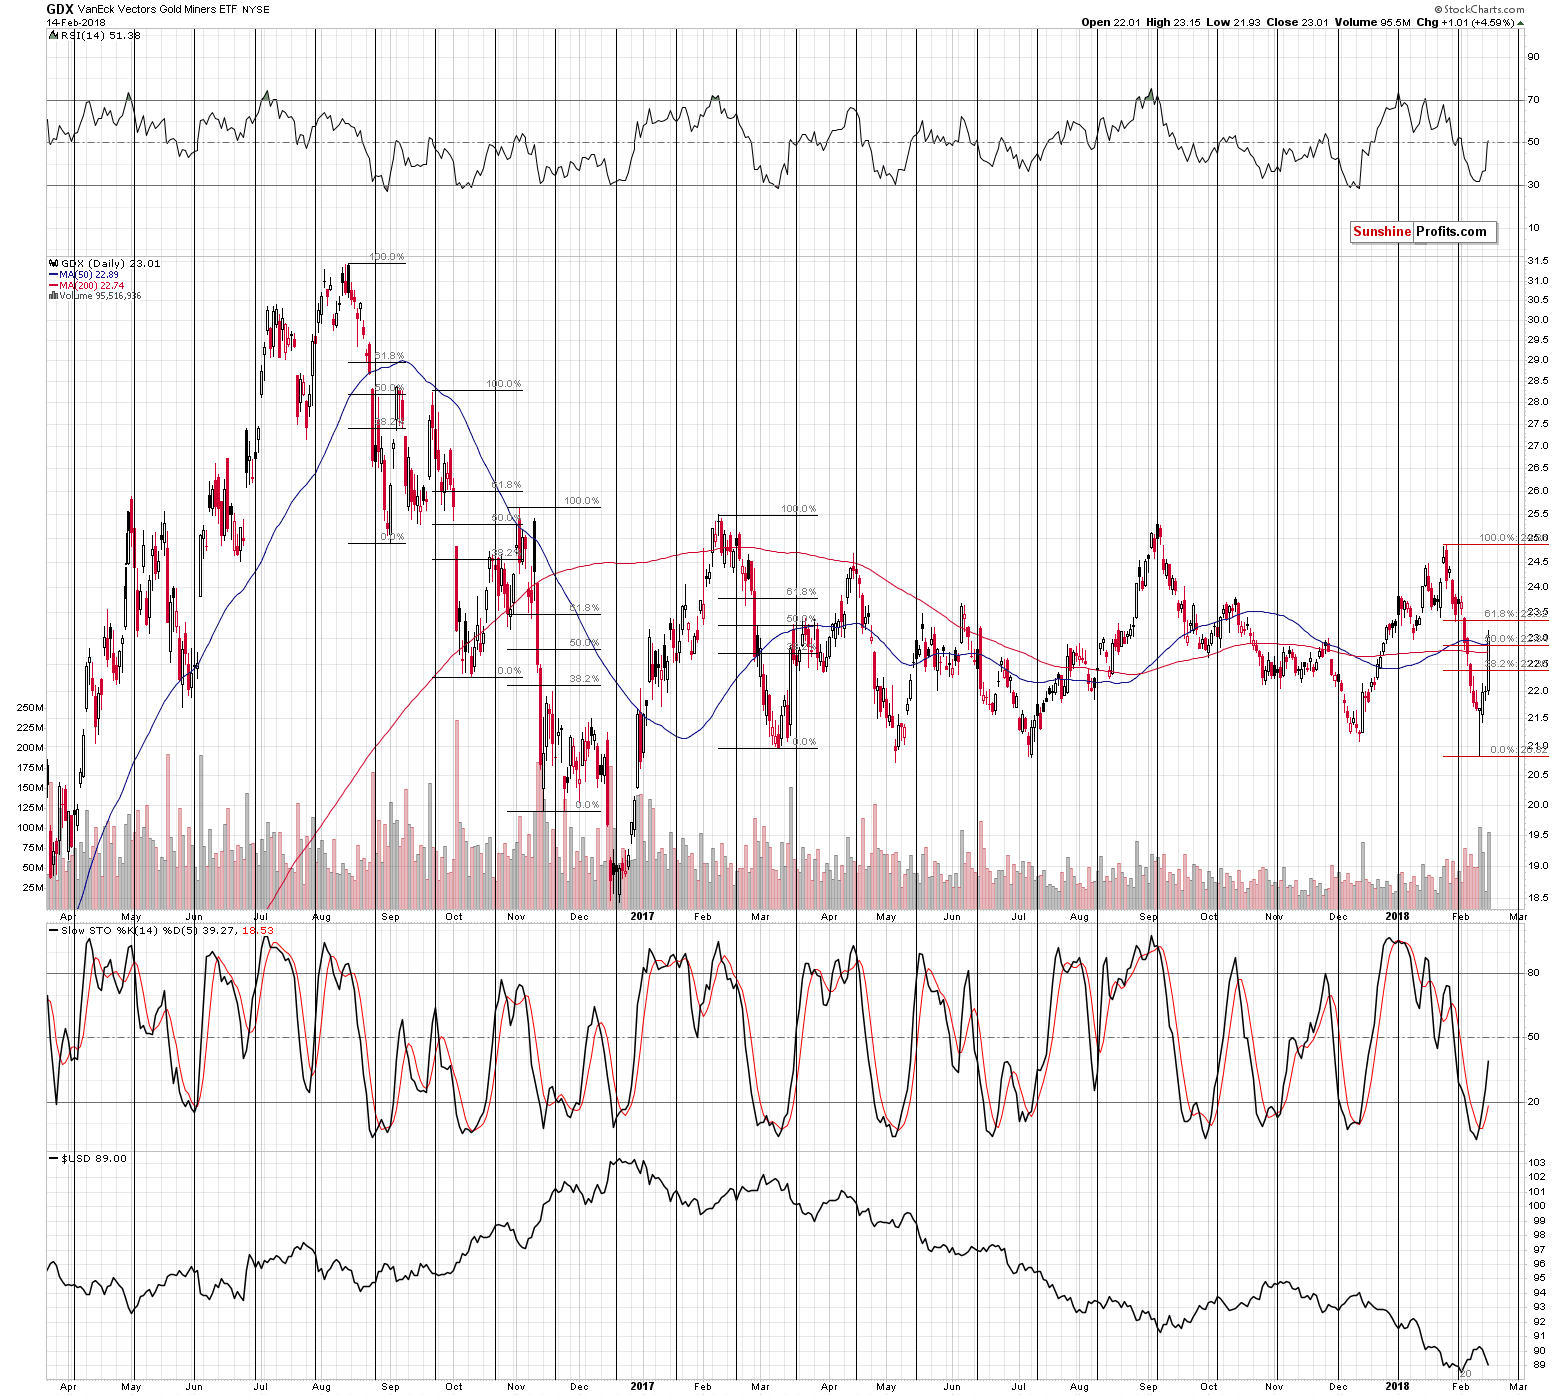
The last big and volatile downswing that was followed by a sharp upswing in GDX was seen in February and March 2017. The upswing took miners to about 50% Fibonacci retracement, before stopping. The preceding similar situations took place in the second half of 2016. When GDX declined sharply in August, it rallied back up just a little above the 50% Fibonacci retracement. The decline that started in September corrected initially to the 38.2% retracement, but ended only after miners moved a bit above the 50% retracement. The November decline was corrected to the 38.2% retracement.
At this time, GDX corrected a bit more than 50% of the recent sharp decline, which is well in line with the historical norms for a volatile corrective upswing WITHIN a bigger decline. In other words, even though the mining stocks are up by about 5% today, it’s not necessarily a bullish sign.
The above remains up-to-date. We would like to add that even though gold moved close to its 2018 high and even above its September 2017 high, mining stocks are visibly below analogous highs.
Is the rally over? In order to reply to this question, it will be best to provide an update on what we wrote in Monday’s alert:
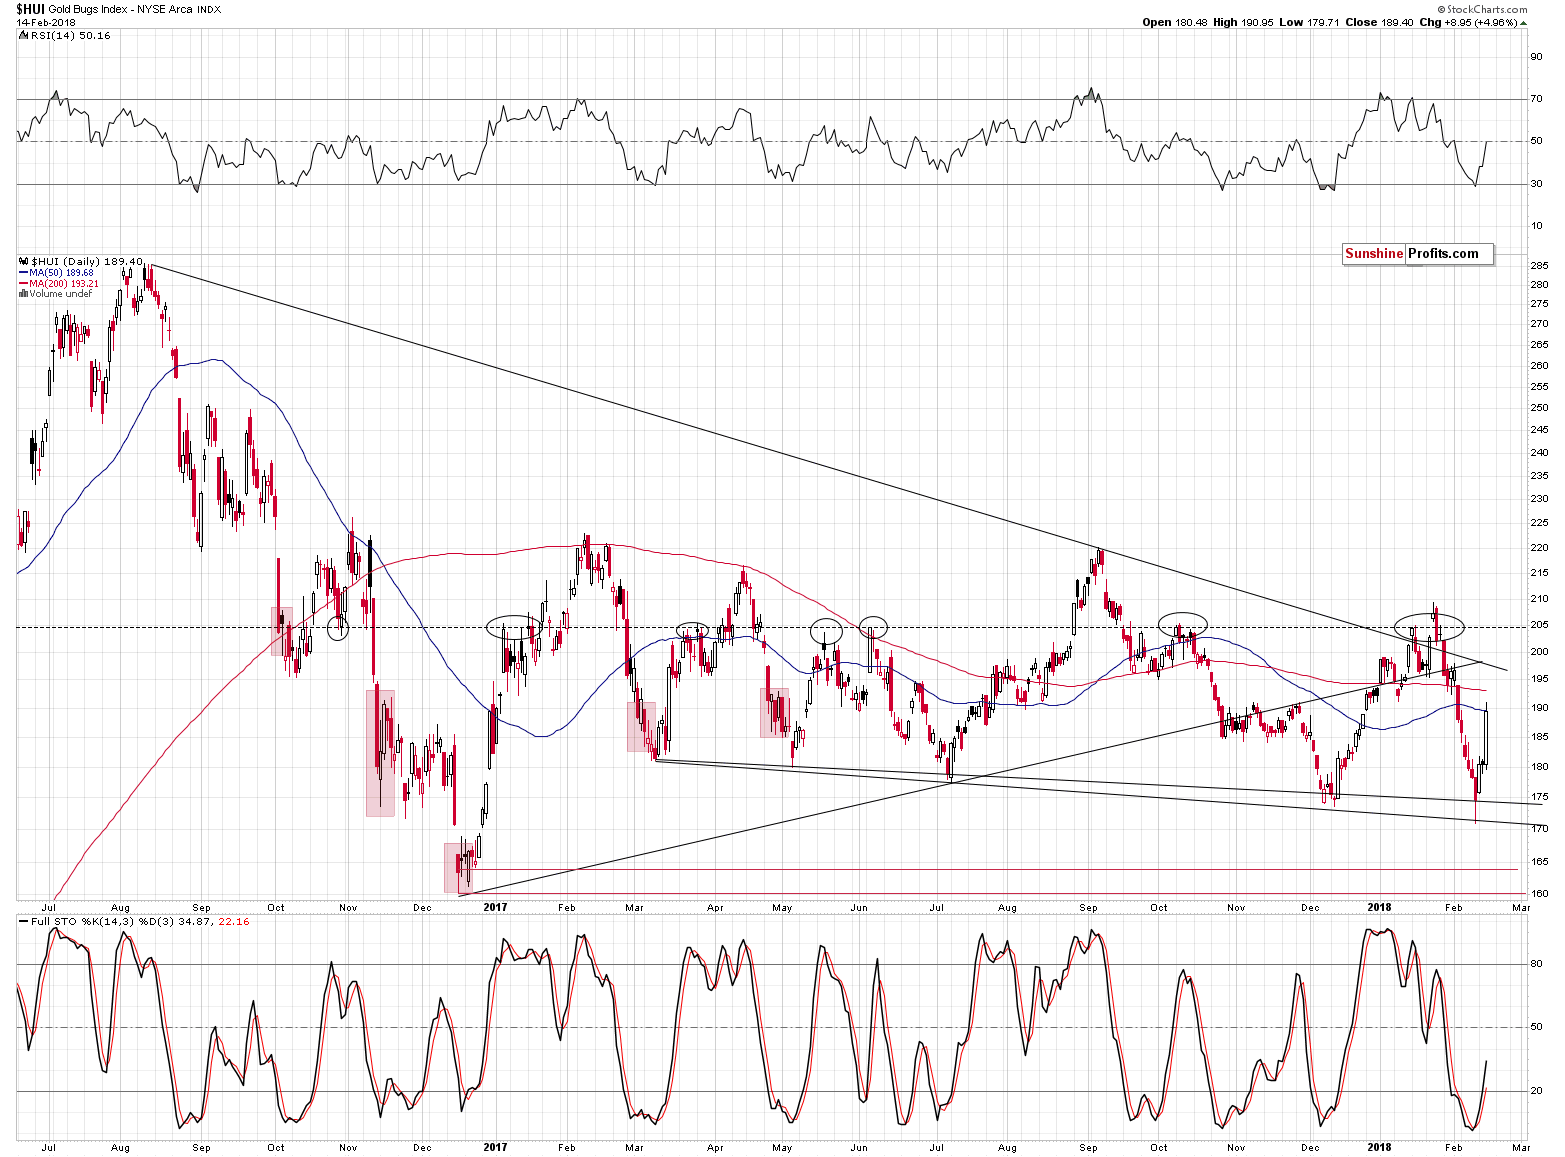
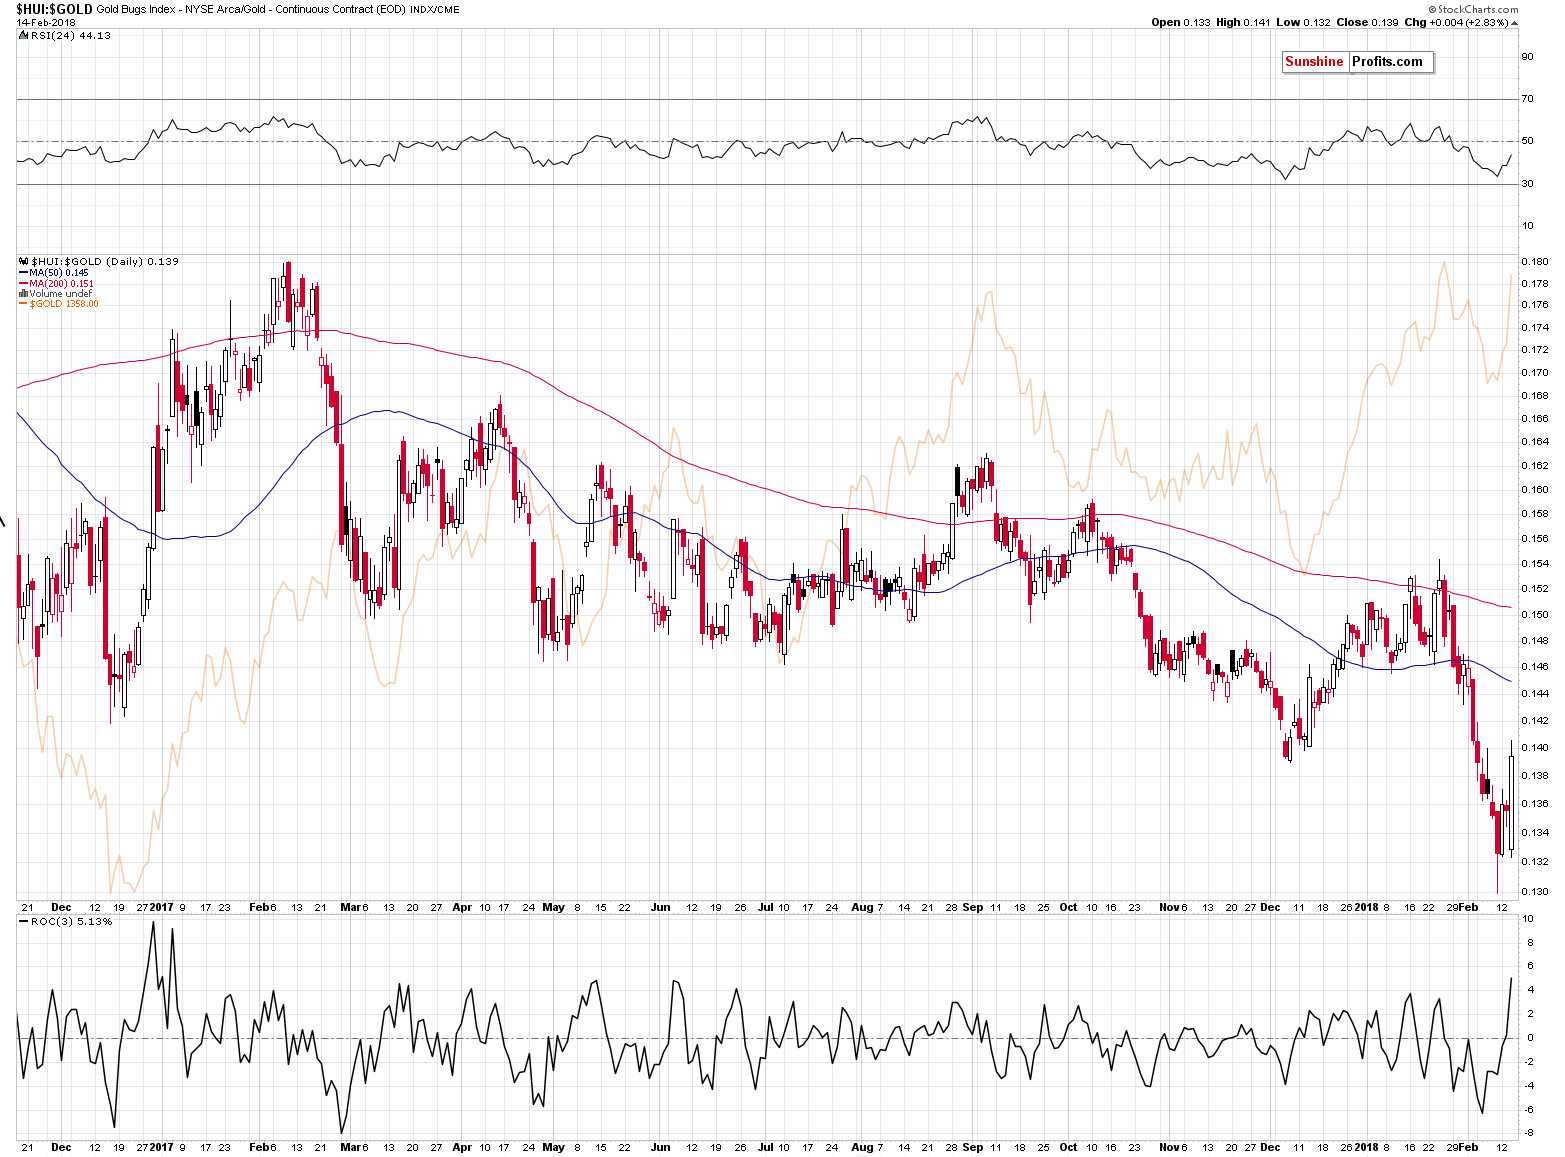
The HUI Index (the same can be seen on the XAU Index chart) also features a reversal, but it’s not as profound as the one in the case of the GDX ETF. Interestingly, the HUI Index reached the declining support lines base on the March 2017 and July 2017 lows in a quite specific way. The line based on the intraday lows was reached on an intraday basis and the line based on the closing prices was reached in terms of the closing prices. That’s a classic way in which the support lines (based on different prices) work.
As far as the current implications are concerned, since the support lines were reached, but not broken, then they are bullish factors. The same goes for the small (but still) buy signal from the Stochastic Indicator and the RSI below the 30 level.
Moreover, all of the above took place at the triangle’s apex, which makes a reversal very likely.
We started using the triangle apex reversal technique relatively recently (and it seems that we are the only ones using it for the precious metals market), so we were skeptical about it in light of other bearish signs. Based on what happened (it proved extremely useful once again), we’ll put greater weight on these reversal signs in the future.
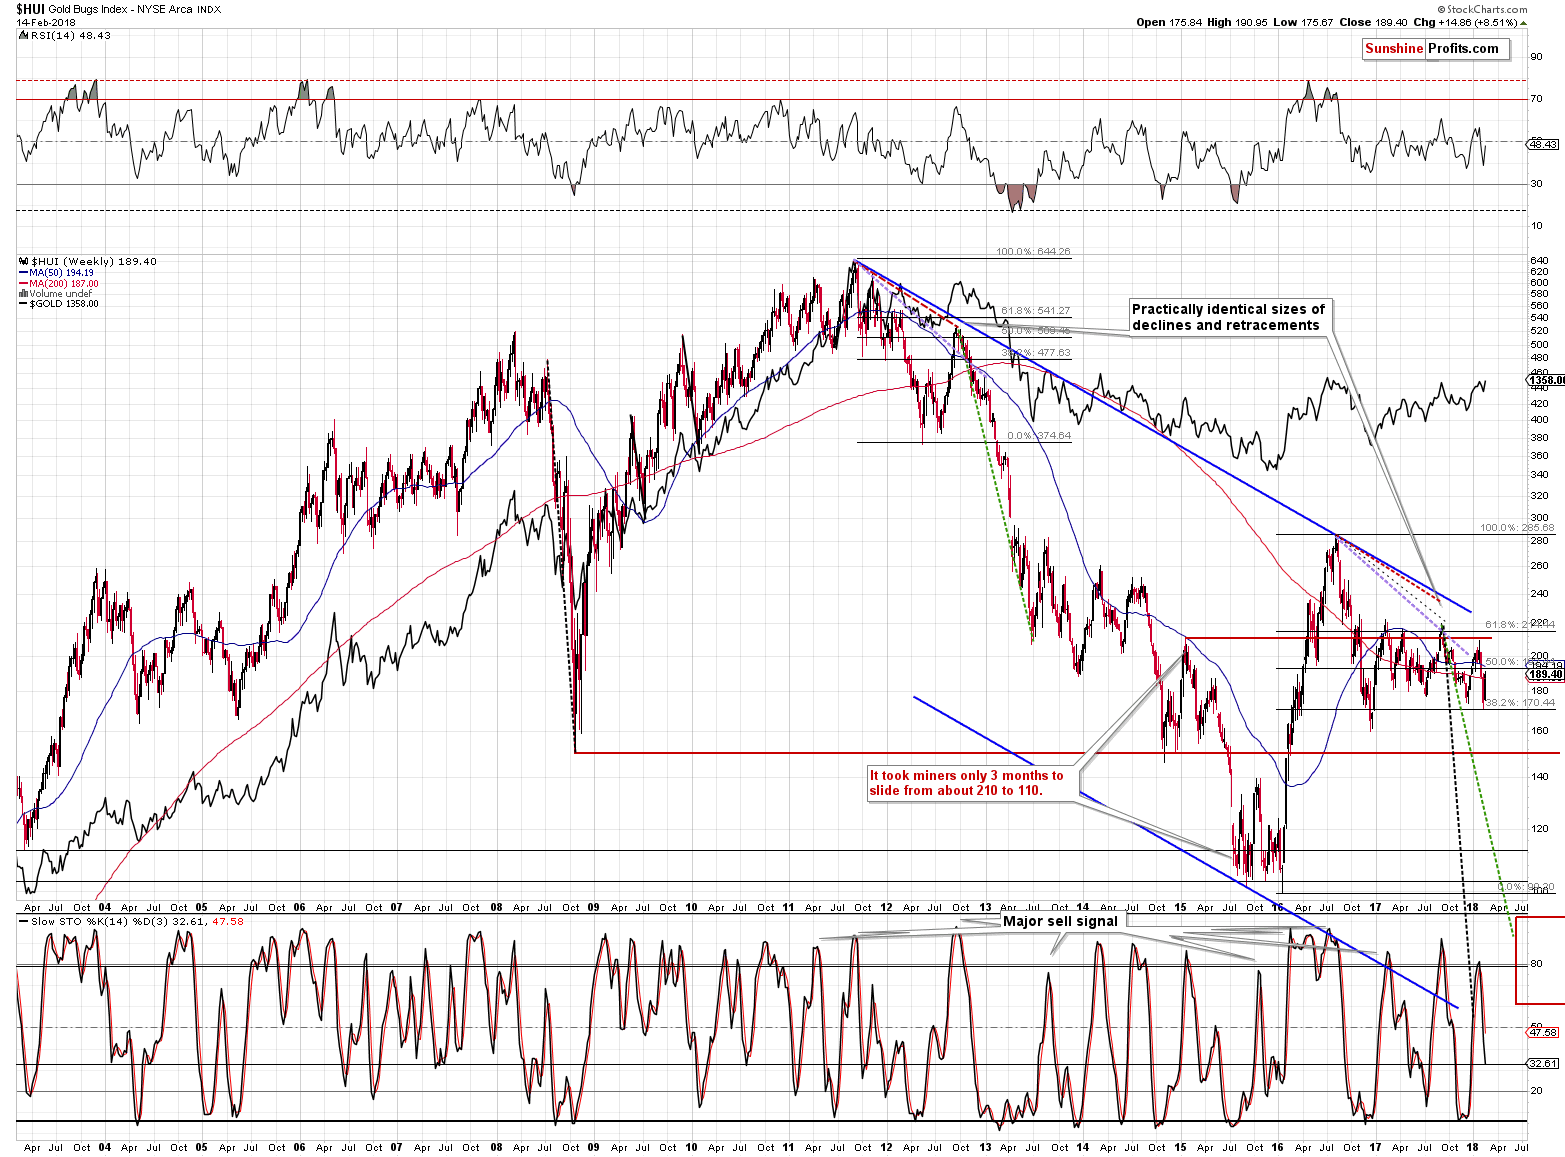
Naturally, from the long-term point of view, the outlook remains bearish and the sell signal from the weekly Stochastic indicator confirms it. Still, please note that the decline appears almost vertical, which is a good sign that the pace of the decline may be unsustainable, and a corrective upswing is likely.
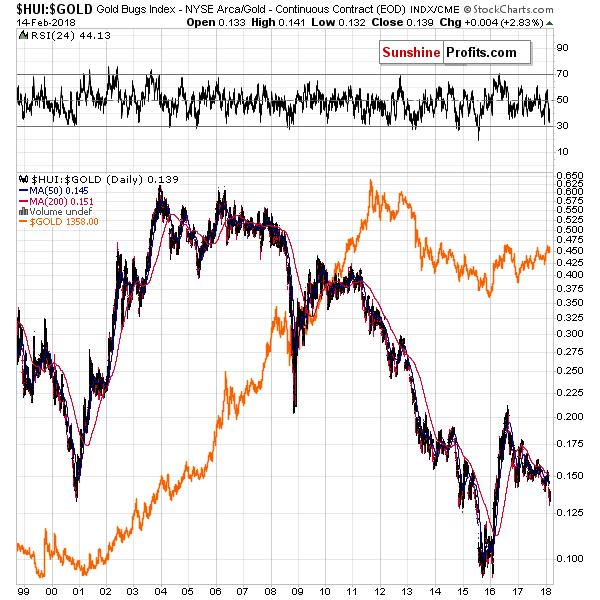
Comparing the performance of gold stocks with the one of gold provides us with bearish implications for the following weeks and (in particular) months as we saw a major breakdown below the late-2016 low in the HUI to gold ratio.
From the short-term point of view, however, we also saw a reversal and it would not be uncommon for the breakdown below the 2016 and 2017 lows to be verified by a move back to them. In the above case, and assuming gold at $1,327, we can look for GDX at about $22.50 before the decline is resumed. With gold at $1,345, GDX could be at about $22.85.
Both levels are visibly higher than Friday’s close, but nonetheless they are below the last closing price of 2017, so even if the mentioned rally did indeed materialize, 2018 would still be a down year for the GDX.
The 2018 is still a down year for the GDX and it seems that the breakdown below the 2017 and 2016 lows was just verified, just as we had indicated on Monday. That’s a rather normal course of action after a breakdown – not anything bullish.
GDX moved a bit higher than the mentioned targets, but not as significant as gold moved above its target. The reason for both of the above is the decline in the USD Index and – likely to a decreasing extent – the move higher in the general stock market.
Let’s take a look at the latter.
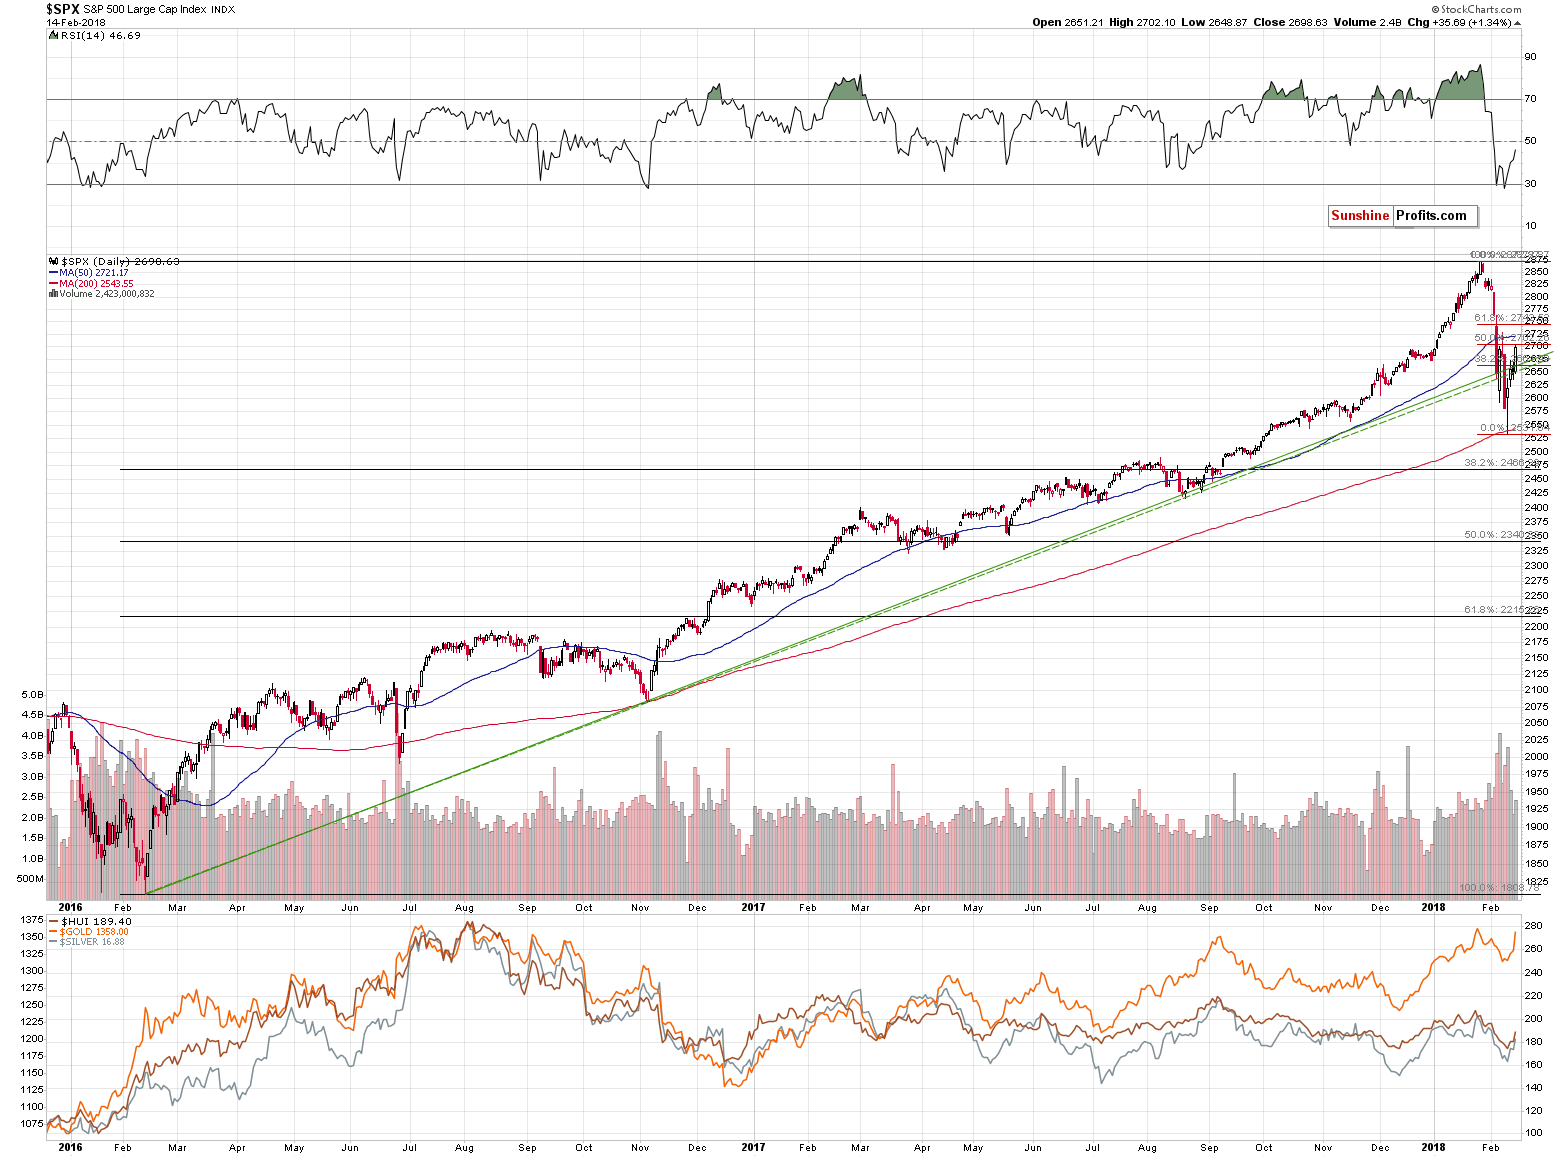
In the previous alerts, we discussed that the S&P 500 Index was either on the verge of invalidating its recent breakdown below the rising support / resistance line, or verifying it. The implications for these 2 scenarios were contradictory, so the situation was tense.
During yesterday’s session, the general stock market decided to move higher and rallied to the 50% Fibonacci retracement. While we would prefer to see a rally above the 61.8% retracement before saying that the outlook is once again bullish, we can already say that it improved.
Still, if we consider how high gold rallied and how high the mining stocks’ price increased, it seems that the effect that the general stock market has on mining stocks is wearing off. Miners increased their prices, following gold’s lead – they don’t seem to have received an additional boost from main stock indices. Gold moved to previous highs, while miners are barely in the middle of the previous decline. Either the general stock market failed to help mining stocks, or miners are underperforming. In both cases, the importance of main stock indices for us – precious metals investors and traders – is now lower.
Moving on to the currency sector, let’s start with the USD Index’s short-term chart.
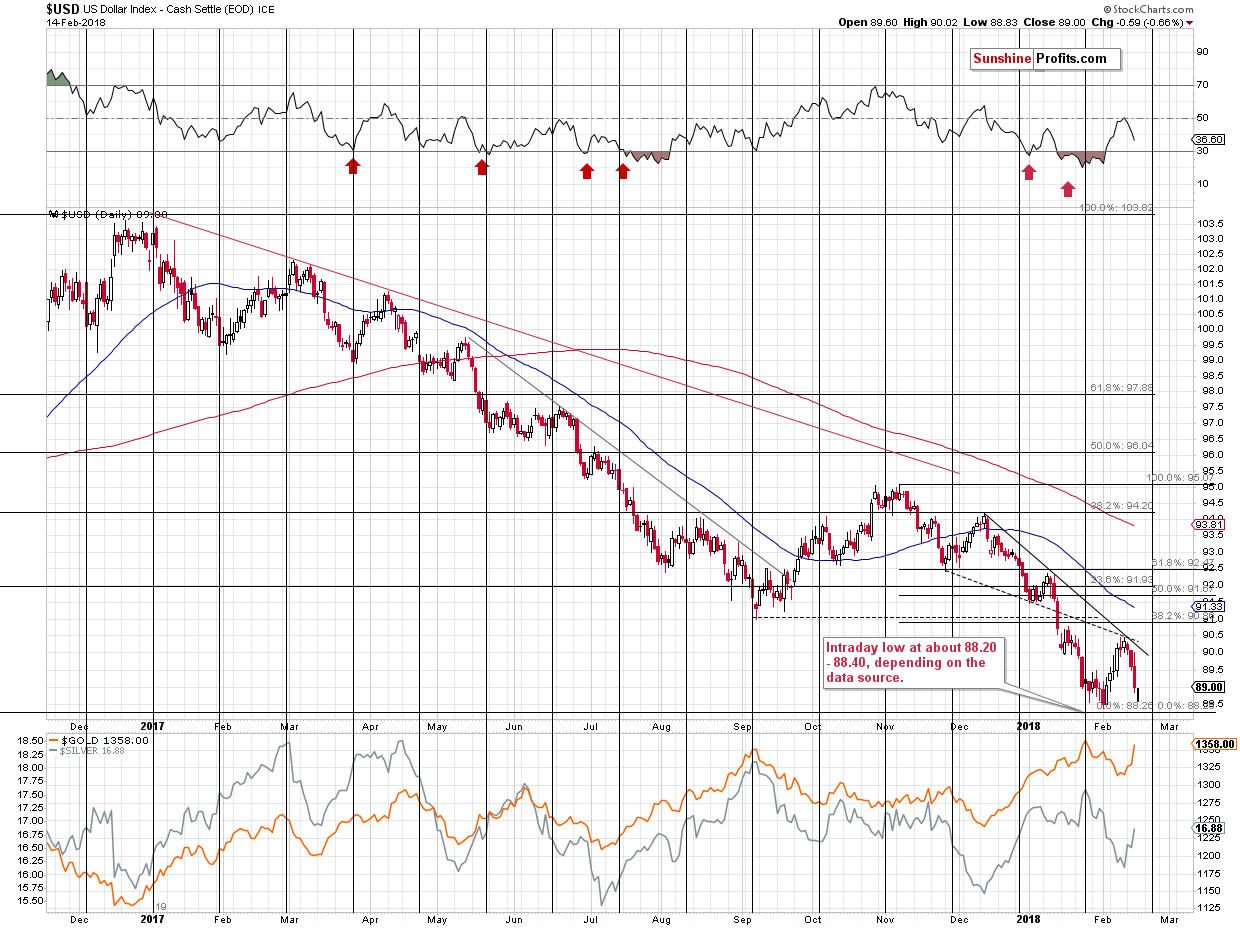
Today’s pre-market low for the USD Index is 88.585 (Bloomberg). We plotted this move on the above chart as a small black line.
The USD Index moved below the highest of the long-term support levels and it actually moved to this year’s low. Interestingly, gold is only $4 higher in light of the above, which is a rather weak type of reaction.
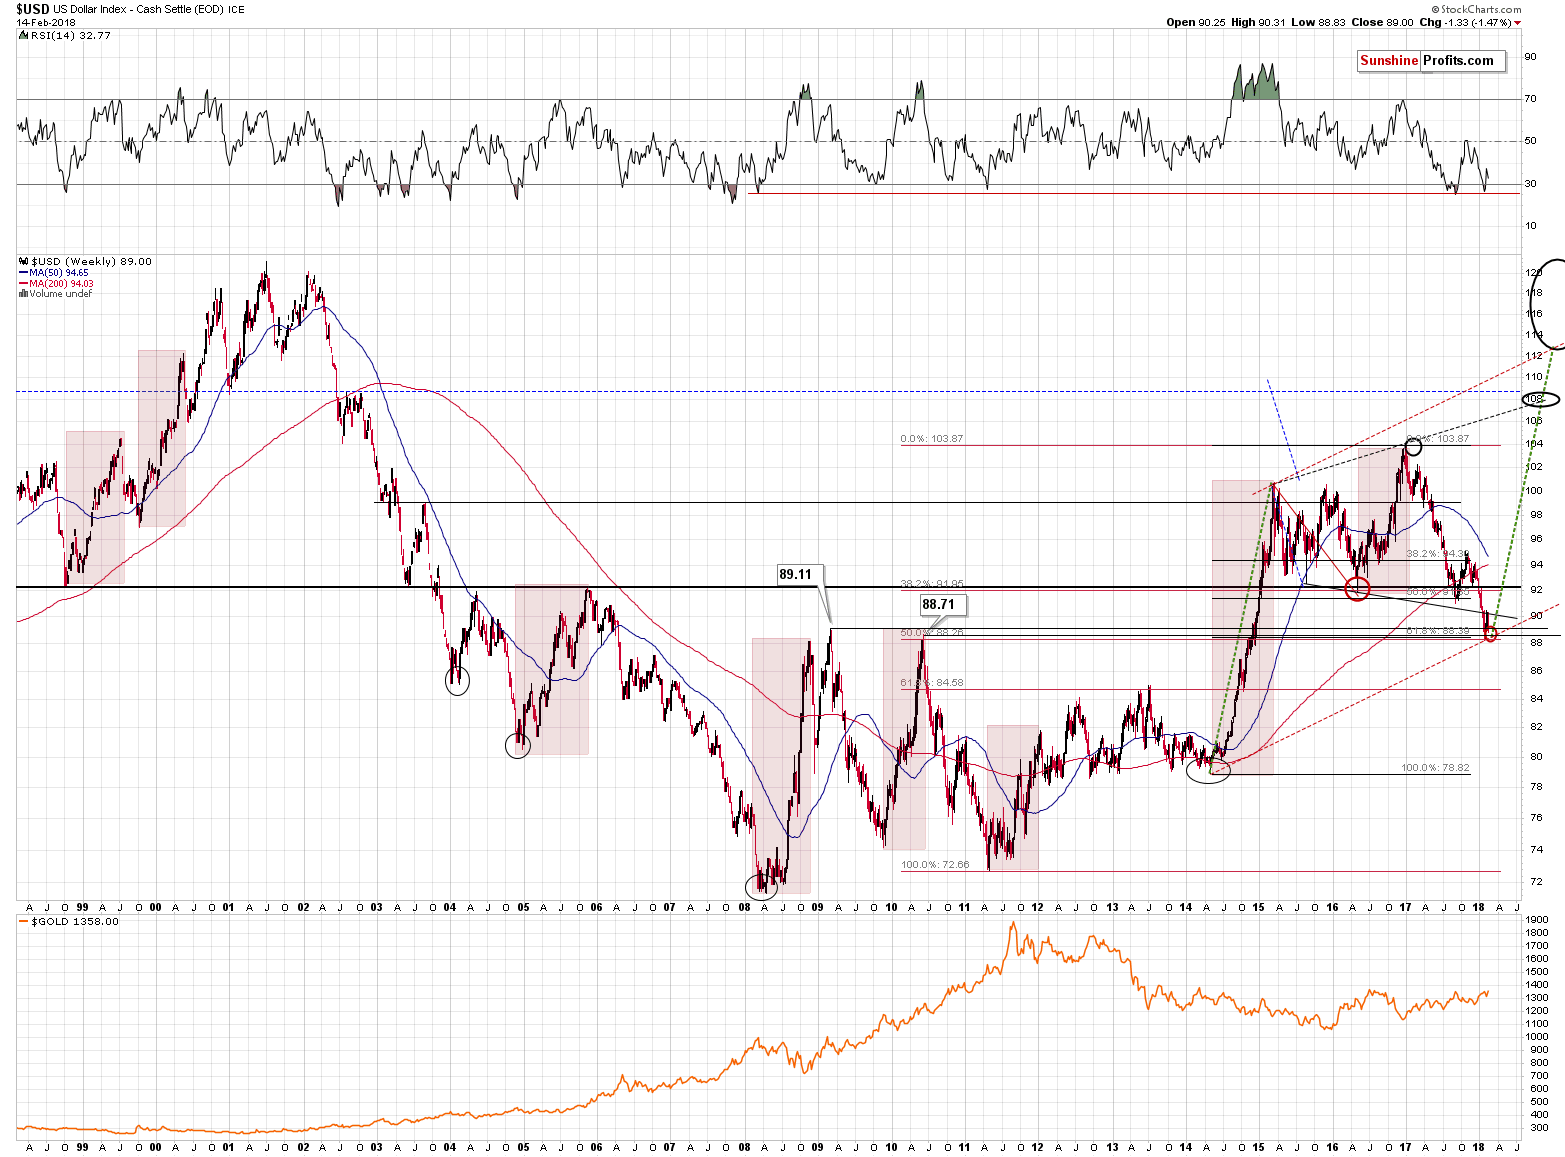
The other key, long-term support levels are: 88.71 (the 2010 high) and the two Fibonacci retracements - the 50% retracement based on the 2011-2017 rally (88.26) and the 61.8% retracement based on the 2014-2017 rally (88.39). The USD Index was just in the middle of these levels.
Another rally here will serve as an invalidation of the breakdown and another buy signal. Another decline here will likely be reversed at the lowest of the support levels (88.26) or we’ll see a breakdown. The breakdown would likely be invalidated rather quickly, just like the January 25 tiny breakdown was.
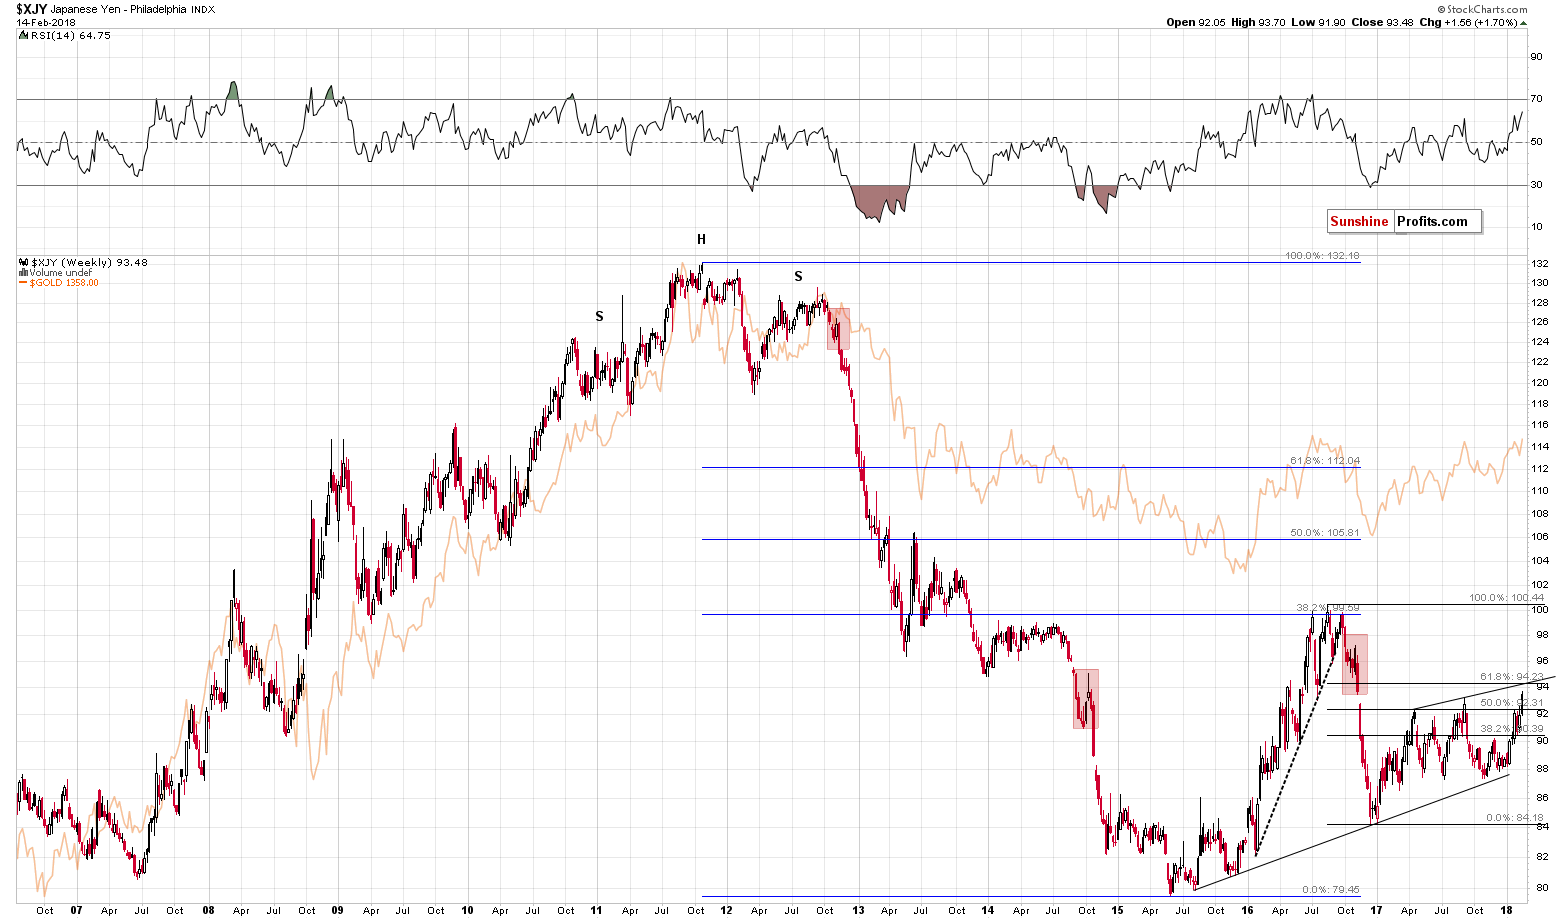
Finally, let’s look at the Japanese yen. It moved above its 2018 and 2017 highs, so it’s now likely to either invalidate the breakdown or to move to the rising resistance line. The latter seems more likely as this resistance is strengthened by the 61.8% Fibonacci retracement and this is exactly the retracement that worked so perfectly from the bigger perspective in the case of the 2016 top.
The scenario in which the yen reverses right away is also possible if you factor in the price gap in late 2016. Both borders of the gap can serve as resistance and the upper part was just reached.
The implications are rather unclear for the very short term, but with a slight bullish bias.
Summing up, the precious metals sector moved higher yesterday, but that is not – by itself – a bullish sign. PMs simply reacted to the very weak performance of the USD Index and since the strength of the reaction is much smaller in today’s pre-market trading, it could be the case that the rally in metals and miners is over or about to end today. The latter scenario is supported by the analogy to the previous 2018 high in light of gold’s performance in terms of the USD and in terms of the euro. Moreover, the USD Index is also in a similar position. The Japanese yen is about to reach a combination of 2 resistance levels, which could also cause the precious metals sector to decline. This is a combination of factors that favors short positions, not long ones.
If we’re lucky, we’ll see another move lower in the USD, just a little below the previous lows, which is shortly invalidated and another small upswing in gold which is accompanied by a bigger daily rally in silver and disappointing performance in mining stocks. This would serve as a perfect bearish confirmation for the short term that would likely make us double the size of the current short position. At this time, however, the above is just a possibility, not a certainty, so we’ll need to keep monitoring the market and act accordingly.
As always, we will keep you – our subscribers – informed.
To summarize:
Trading capital (supplementary part of the portfolio; our opinion): Full short positions (100% of the full position) in gold, silver and mining stocks are justified from the risk/reward perspective with the following stop-loss orders and initial target price levels:
- Gold: initial target price: $1,218; stop-loss: $1,382; initial target price for the DGLD ETN: $53.98; stop-loss for the DGLD ETN $37.68
- Silver: initial target price: $14.63; stop-loss: $17.82; initial target price for the DSLV ETN: $33.88; stop-loss for the DSLV ETN $20.88
- Mining stocks (price levels for the GDX ETF): initial target price: $19.22; stop-loss: $26.14; initial target price for the DUST ETF: $39.88; stop-loss for the DUST ETF $15.78
In case one wants to bet on junior mining stocks' prices (we do not suggest doing so – we think senior mining stocks are more predictable in the case of short-term trades – if one wants to do it anyway, we provide the details), here are the stop-loss details and initial target prices:
- GDXJ ETF: initial target price: $27.82; stop-loss: $38.22
- JDST ETF: initial target price: $94.88 stop-loss: $37.78
Long-term capital (core part of the portfolio; our opinion): No positions (in other words: cash)
Insurance capital (core part of the portfolio; our opinion): Full position
Important Details for New Subscribers
Whether you already subscribed or not, we encourage you to find out how to make the most of our alerts and read our replies to the most common alert-and-gold-trading-related-questions.
Please note that the in the trading section we describe the situation for the day that the alert is posted. In other words, it we are writing about a speculative position, it means that it is up-to-date on the day it was posted. We are also featuring the initial target prices, so that you can decide whether keeping a position on a given day is something that is in tune with your approach (some moves are too small for medium-term traders and some might appear too big for day-traders).
Plus, you might want to read why our stop-loss orders are usually relatively far from the current price.
Please note that a full position doesn’t mean using all of the capital for a given trade. You will find details on our thoughts on gold portfolio structuring in the Key Insights section on our website.
As a reminder – “initial target price” means exactly that – an “initial” one, it’s not a price level at which we suggest closing positions. If this becomes the case (like it did in the previous trade) we will refer to these levels as levels of exit orders (exactly as we’ve done previously). Stop-loss levels, however, are naturally not “initial”, but something that, in our opinion, might be entered as an order.
Since it is impossible to synchronize target prices and stop-loss levels for all the ETFs and ETNs with the main markets that we provide these levels for (gold, silver and mining stocks – the GDX ETF), the stop-loss levels and target prices for other ETNs and ETF (among other: UGLD, DGLD, USLV, DSLV, NUGT, DUST, JNUG, JDST) are provided as supplementary, and not as “final”. This means that if a stop-loss or a target level is reached for any of the “additional instruments” (DGLD for instance), but not for the “main instrument” (gold in this case), we will view positions in both gold and DGLD as still open and the stop-loss for DGLD would have to be moved lower. On the other hand, if gold moves to a stop-loss level but DGLD doesn’t, then we will view both positions (in gold and DGLD) as closed. In other words, since it’s not possible to be 100% certain that each related instrument moves to a given level when the underlying instrument does, we can’t provide levels that would be binding. The levels that we do provide are our best estimate of the levels that will correspond to the levels in the underlying assets, but it will be the underlying assets that one will need to focus on regarding the signs pointing to closing a given position or keeping it open. We might adjust the levels in the “additional instruments” without adjusting the levels in the “main instruments”, which will simply mean that we have improved our estimation of these levels, not that we changed our outlook on the markets. We are already working on a tool that would update these levels on a daily basis for the most popular ETFs, ETNs and individual mining stocks.
Our preferred ways to invest in and to trade gold along with the reasoning can be found in the how to buy gold section. Additionally, our preferred ETFs and ETNs can be found in our Gold & Silver ETF Ranking.
As a reminder, Gold & Silver Trading Alerts are posted before or on each trading day (we usually post them before the opening bell, but we don't promise doing that each day). If there's anything urgent, we will send you an additional small alert before posting the main one.
=====
Latest Free Trading Alerts:
It was a strange day. Inflation surged yesterday. But gold dropped initially, only to quickly reverse the fall and fly into the air. What happened? And – importantly – will gold soar on the inflation fuel?
Strange Link between Inflation and Gold
S&P 500 index gained 1.3% on Wednesday, following lower opening of the trading session. The market has extended its rally from Friday's low. But will it continue higher today? We can see some short-term overbought conditions. Was this two-week-long sell-off the beginning of a new medium-term downtrend or just downward correction before another leg up? It's hard to say, but this move down set the negative tone for weeks or months to come.
Stocks Extend Rally Off Friday's Low, But Short-Term Exhaustion Near
=====
Hand-picked precious-metals-related links:
PRECIOUS-Gold inches higher as dollar hits two-week low
Platinum market set for another surplus in 2018 — Johnson Matthey
=====
In other news:
World stocks steam higher as inflation fears suddenly fizzle
Fannie Mae needs infusion of taxpayer cash for first time in six years
Number of crypto hedge funds doubles in four months: Autonomous NEXT data
=====
Thank you.
Sincerely,
Przemyslaw Radomski, CFA
Founder, Editor-in-chief, Gold & Silver Fund Manager
Gold & Silver Trading Alerts
Forex Trading Alerts
Oil Investment Updates
Oil Trading Alerts

