

Briefly: In our opinion, full (150% of the regular full position) speculative short positions in gold, silver and mining stocks are justified from the risk/reward perspective at the moment of publishing this alert.
Gold, silver and mining stocks finally moved lower after several days of higher prices and one can say the opposite about the USD Index. Was this just a pause or a beginning of a bigger downtrend?
The latter is quite likely and the reasons come from the precious metals charts as well as from the one of the USD Index. In short, the points that we made in the previous alerts this week remain up-to-date, especially those that we discussed yesterday regarding the “when” factor.
Let’s start today’s discussion with gold’s short-term chart (charts courtesy of http://stockcharts.com).
Gold
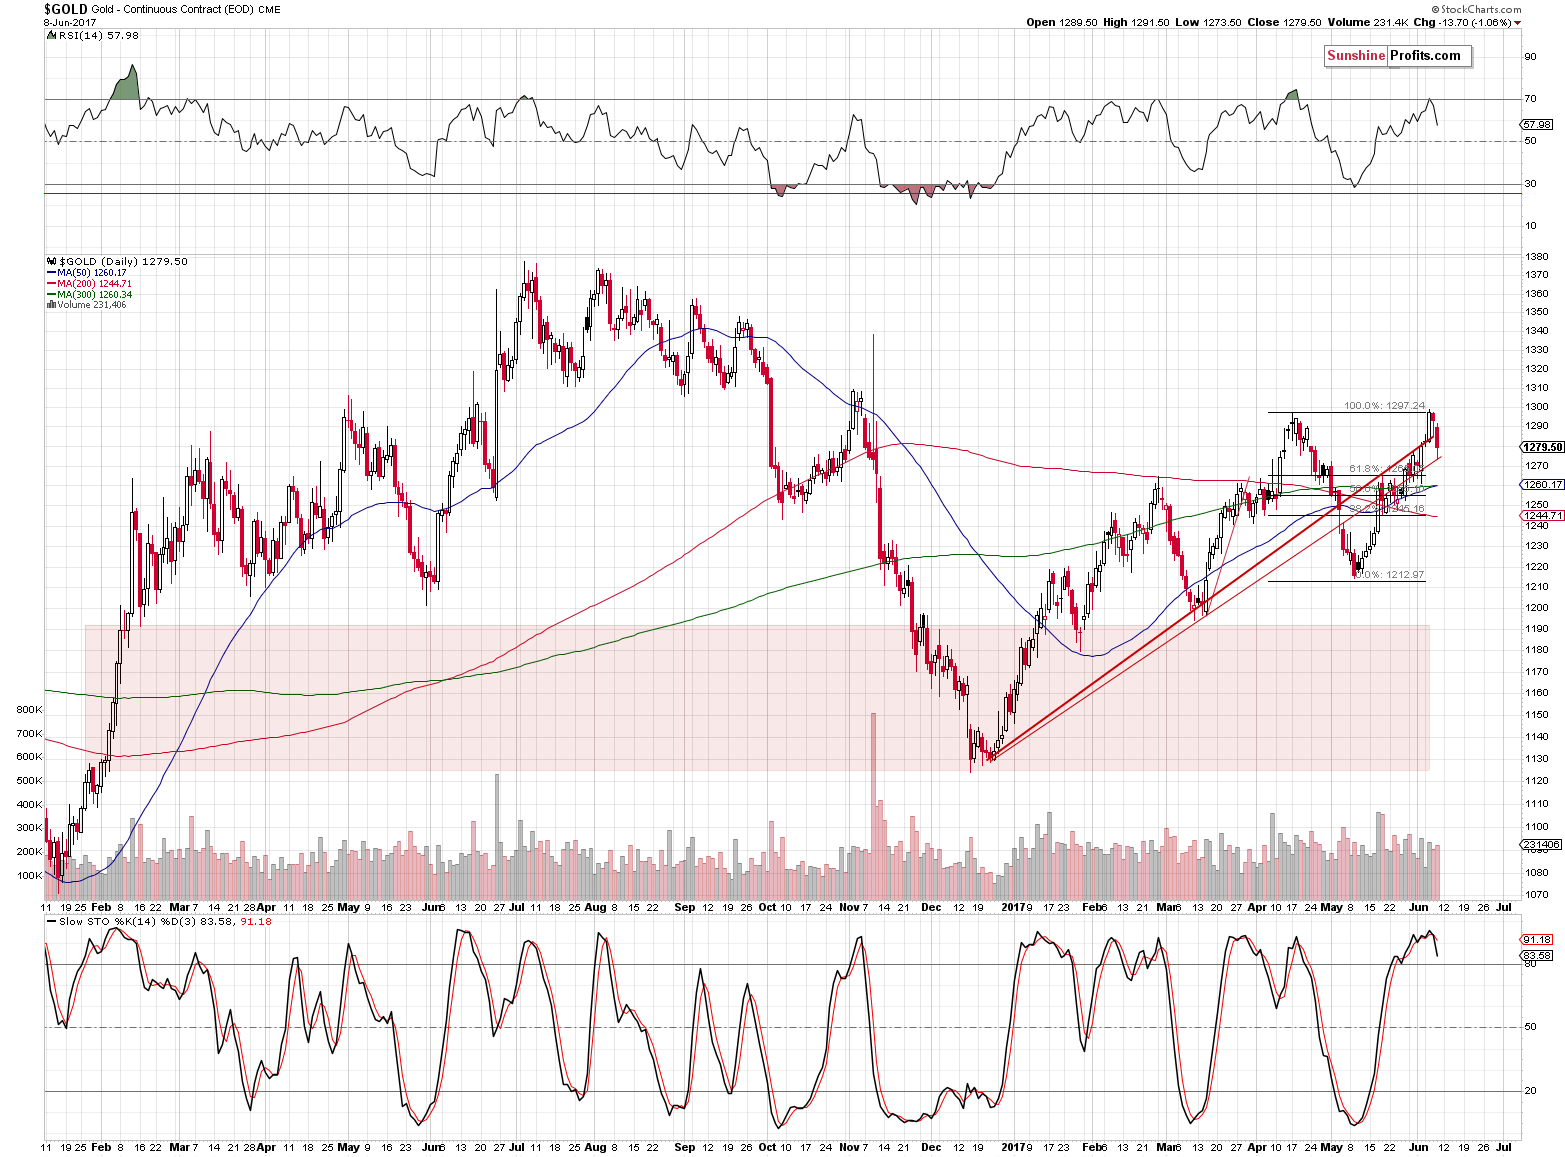
Gold moved visibly below the April highs and also below the rising red support/resistance line based on the daily closing prices. The breakout above it was therefore invalidated.
The RSI moved lower after reaching 70 and the Stochastic indicator flashed a sell signal by moving below its moving average.
In other words, the technical picture for the short term deteriorated based on yesterday’s session. The long-term picture has been bearish and it remains bearish today – yesterday’s session doesn’t seem to have changed much in that regard.
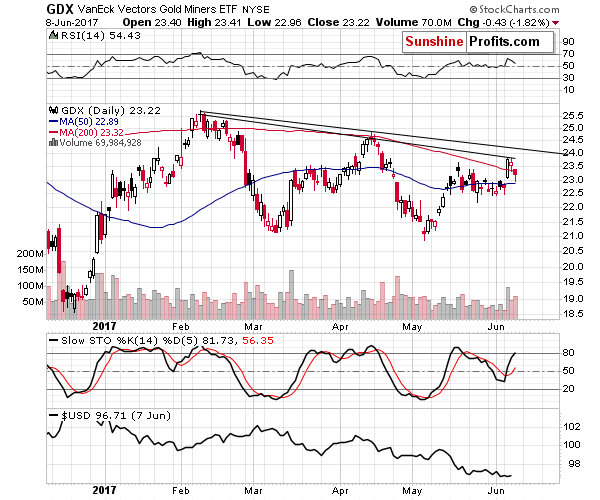
Mining stocks also moved lower on increasing volume, which is a bearish sign on its own. Another sign comes from the closing price – the GDX closed back below the May high (in terms of the daily closing price). That’s important, because that was the only breakout that we’ve seen in miners. They didn’t move above any long-term resistance and they didn’t even move above their declining resistance line that we marked in black on the above chart. With the only breakout being invalidated, the outlook is clearly bearish.
As far as the “Why is the time running out?” question is concerned, the reply is once again provided on the USD Index chart.
USD Index and Its Implications
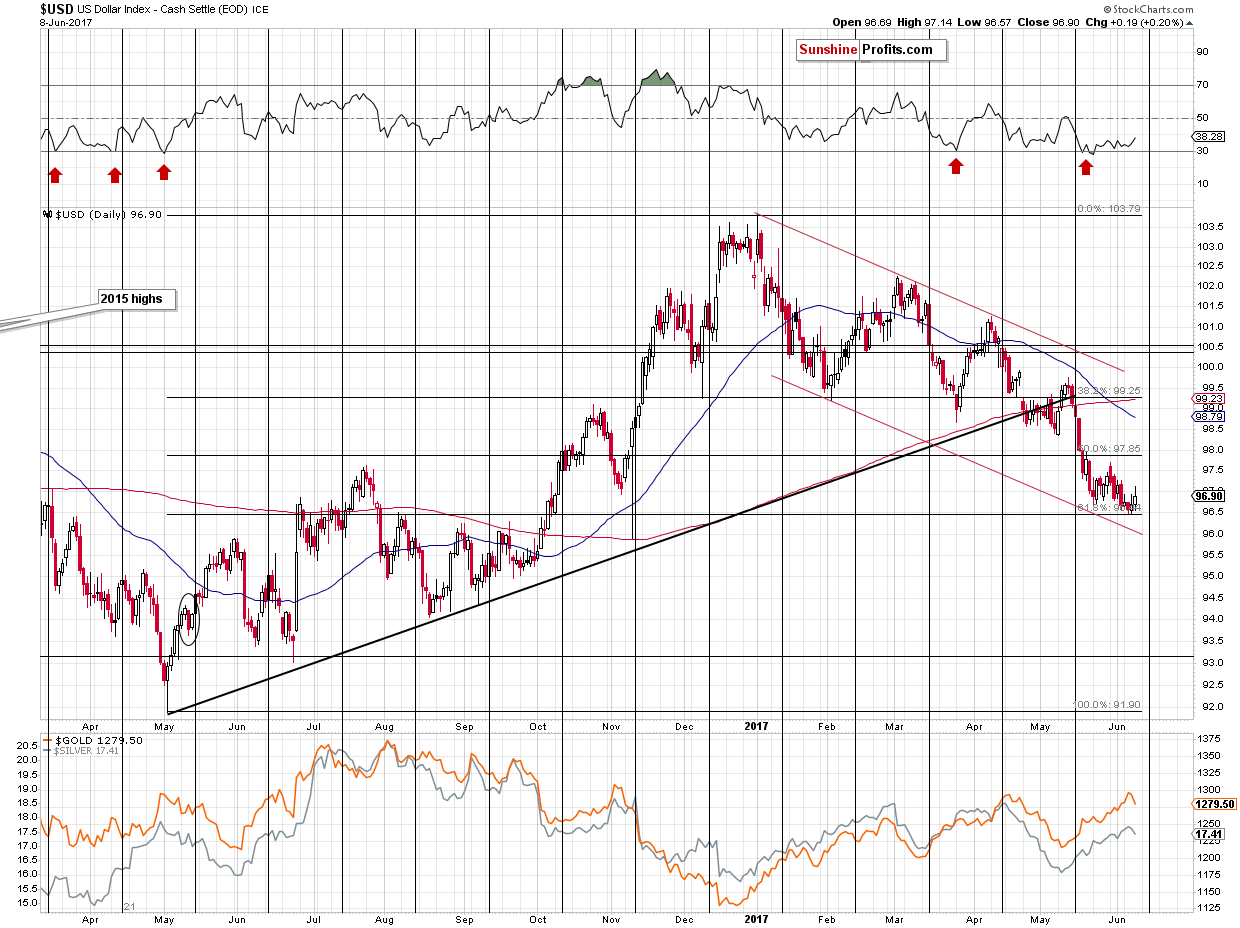
In yesterday’s alert we wrote the following:
The cyclical turning point is just around the corner and since all recent major turnarounds took place right before the turning points, it’s likely that the turnaround will be seen shortly. Perhaps, the bottom is already in – the USD Index tested the Fibonacci retracement once again yesterday and there was no breakdown (let alone a confirmed one).
The RSI indicator remains close to the 30 level – the oversold territory, thus suggesting that the next short-term price move should be to the upside.
The USD Index finally moved a bit higher and even though this daily rally is nothing compared to the likely long-term upswing, it is a good start. The important thing is that metals and miners reacted to even a small sign of strength in the USD – this suggests that when the USD rallies further, metals and miners will further deteriorate instead of showing relative strength.
Summing up, even though this week’s price moves may have appeared significant, they actually changed very little. Important resistance levels were reached in gold and gold stocks and an important support was reached in the case of the USD Index. The proximity of the turning point in the USD Index suggests that the time is running out for the market to decide in which way the next move will take place. The precious metals market remains to be in the pennies to the upside and dollars to the downside territory (literally in the case of silver and the GDX) and thus the overall outlook remains bearish.
As always, we will keep you – our subscribers – informed.
To summarize:
Trading capital (supplementary part of the portfolio; our opinion): Short positions (150% of the full position) in gold, silver and mining stocks are justified from the risk/reward perspective with the following stop-loss orders and initial target price levels / profit-take orders:
- Gold: exit-profit-take level: $1,063; stop-loss: $1,317; initial target price for the DGLD ETN: $81.88; stop-loss for the DGLD ETN $44.57
- Silver: initial target price: $13.12; stop-loss: $19.22; initial target price for the DSLV ETN: $46.18; stop-loss for the DSLV ETN $17.93
- Mining stocks (price levels for the GDX ETF): initial target price: $9.34; stop-loss: $26.34; initial target price for the DUST ETF: $143.56; stop-loss for the DUST ETF $21.37
In case one wants to bet on junior mining stocks' prices (we do not suggest doing so – we think senior mining stocks are more predictable in the case of short-term trades – if one wants to do it anyway, we provide the details), here are the stop-loss details and initial target prices:
- GDXJ ETF: initial target price: $14.13; stop-loss: $45.31
- JDST ETF: initial target price: $417.04; stop-loss: $43.12
Long-term capital (core part of the portfolio; our opinion): No positions (in other words: cash)
Insurance capital (core part of the portfolio; our opinion): Full position
Please note that the in the trading section we describe the situation for the day that the alert is posted. In other words, it we are writing about a speculative position, it means that it is up-to-date on the day it was posted. We are also featuring the initial target prices, so that you can decide whether keeping a position on a given day is something that is in tune with your approach (some moves are too small for medium-term traders and some might appear too big for day-traders).
Plus, you might want to read why our stop-loss orders are usually relatively far from the current price.
Please note that a full position doesn’t mean using all of the capital for a given trade. You will find details on our thoughts on gold portfolio structuring in the Key Insights section on our website.
As a reminder – “initial target price” means exactly that – an “initial” one, it’s not a price level at which we suggest closing positions. If this becomes the case (like it did in the previous trade) we will refer to these levels as levels of exit orders (exactly as we’ve done previously). Stop-loss levels, however, are naturally not “initial”, but something that, in our opinion, might be entered as an order.
Since it is impossible to synchronize target prices and stop-loss levels for all the ETFs and ETNs with the main markets that we provide these levels for (gold, silver and mining stocks – the GDX ETF), the stop-loss levels and target prices for other ETNs and ETF (among other: UGLD, DGLD, USLV, DSLV, NUGT, DUST, JNUG, JDST) are provided as supplementary, and not as “final”. This means that if a stop-loss or a target level is reached for any of the “additional instruments” (DGLD for instance), but not for the “main instrument” (gold in this case), we will view positions in both gold and DGLD as still open and the stop-loss for DGLD would have to be moved lower. On the other hand, if gold moves to a stop-loss level but DGLD doesn’t, then we will view both positions (in gold and DGLD) as closed. In other words, since it’s not possible to be 100% certain that each related instrument moves to a given level when the underlying instrument does, we can’t provide levels that would be binding. The levels that we do provide are our best estimate of the levels that will correspond to the levels in the underlying assets, but it will be the underlying assets that one will need to focus on regarding the signs pointing to closing a given position or keeping it open. We might adjust the levels in the “additional instruments” without adjusting the levels in the “main instruments”, which will simply mean that we have improved our estimation of these levels, not that we changed our outlook on the markets. We are already working on a tool that would update these levels on a daily basis for the most popular ETFs, ETNs and individual mining stocks.
Our preferred ways to invest in and to trade gold along with the reasoning can be found in the how to buy gold section. Additionally, our preferred ETFs and ETNs can be found in our Gold & Silver ETF Ranking.
As always, we'll keep you - our subscribers - updated should our views on the market change. We will continue to send out Gold & Silver Trading Alerts on each trading day and we will send additional Alerts whenever appropriate.
The trading position presented above is the netted version of positions based on subjective signals (opinion) from your Editor, and the Tools and Indicators.
As a reminder, Gold & Silver Trading Alerts are posted before or on each trading day (we usually post them before the opening bell, but we don't promise doing that each day). If there's anything urgent, we will send you an additional small alert before posting the main one.
=====
Latest Free Trading Alerts:
On Wednesday, Trump gave a speech in Cincinnati. What does it imply for the gold market?
Trump’s Speech in Cincinnati, Super Thursday and Gold
=====
Hand-picked precious-metals-related links:
Gold slips; early UK poll results point to hung parliament
Gold in Pounds Rises to Seven-Week High on Hung U.K. Parliament
=====
In other news:
Election 2017: Theresa May has 'no intention of resigning' despite hung parliament - live
Hard Brexit in Doubt as U.K. Voters Reject May's Strategy
Oil prices resume slide as supply glut prevails
Turkey's Erdogan approves troop deployment to Qatar
Japan's insurance lobby calls for early debate on BOJ stimulus exit plan
Dollar cleans up as UK election shock stuns sterling
=====
Thank you.
Sincerely,
Przemyslaw Radomski, CFA
Founder, Editor-in-chief, Gold & Silver Fund Manager
Gold & Silver Trading Alerts
Forex Trading Alerts
Oil Investment Updates
Oil Trading Alerts

