

Briefly: In our opinion, full (150% of the regular full position) speculative short positions in gold, silver and mining stocks are justified from the risk/reward perspective at the moment of publishing this alert.
Precious metals moved sharply higher as gold moved closer to the $1,300 barrier and even mining stocks showed strength. Did yesterday’s session mark the beginning of another upleg in mining stocks?
Most likely not. Gold and gold stocks moved to their respective resistance lines, whereas the USD Index moved (almost, but it seems close enough to view the support as touched) to its important support level. These levels were generally touched, but not broken (more details below), so generally what we wrote previously remains up-to-date.
Let’s take a look at what gold did yesterday (charts courtesy of http://stockcharts.com).
The Big Picture
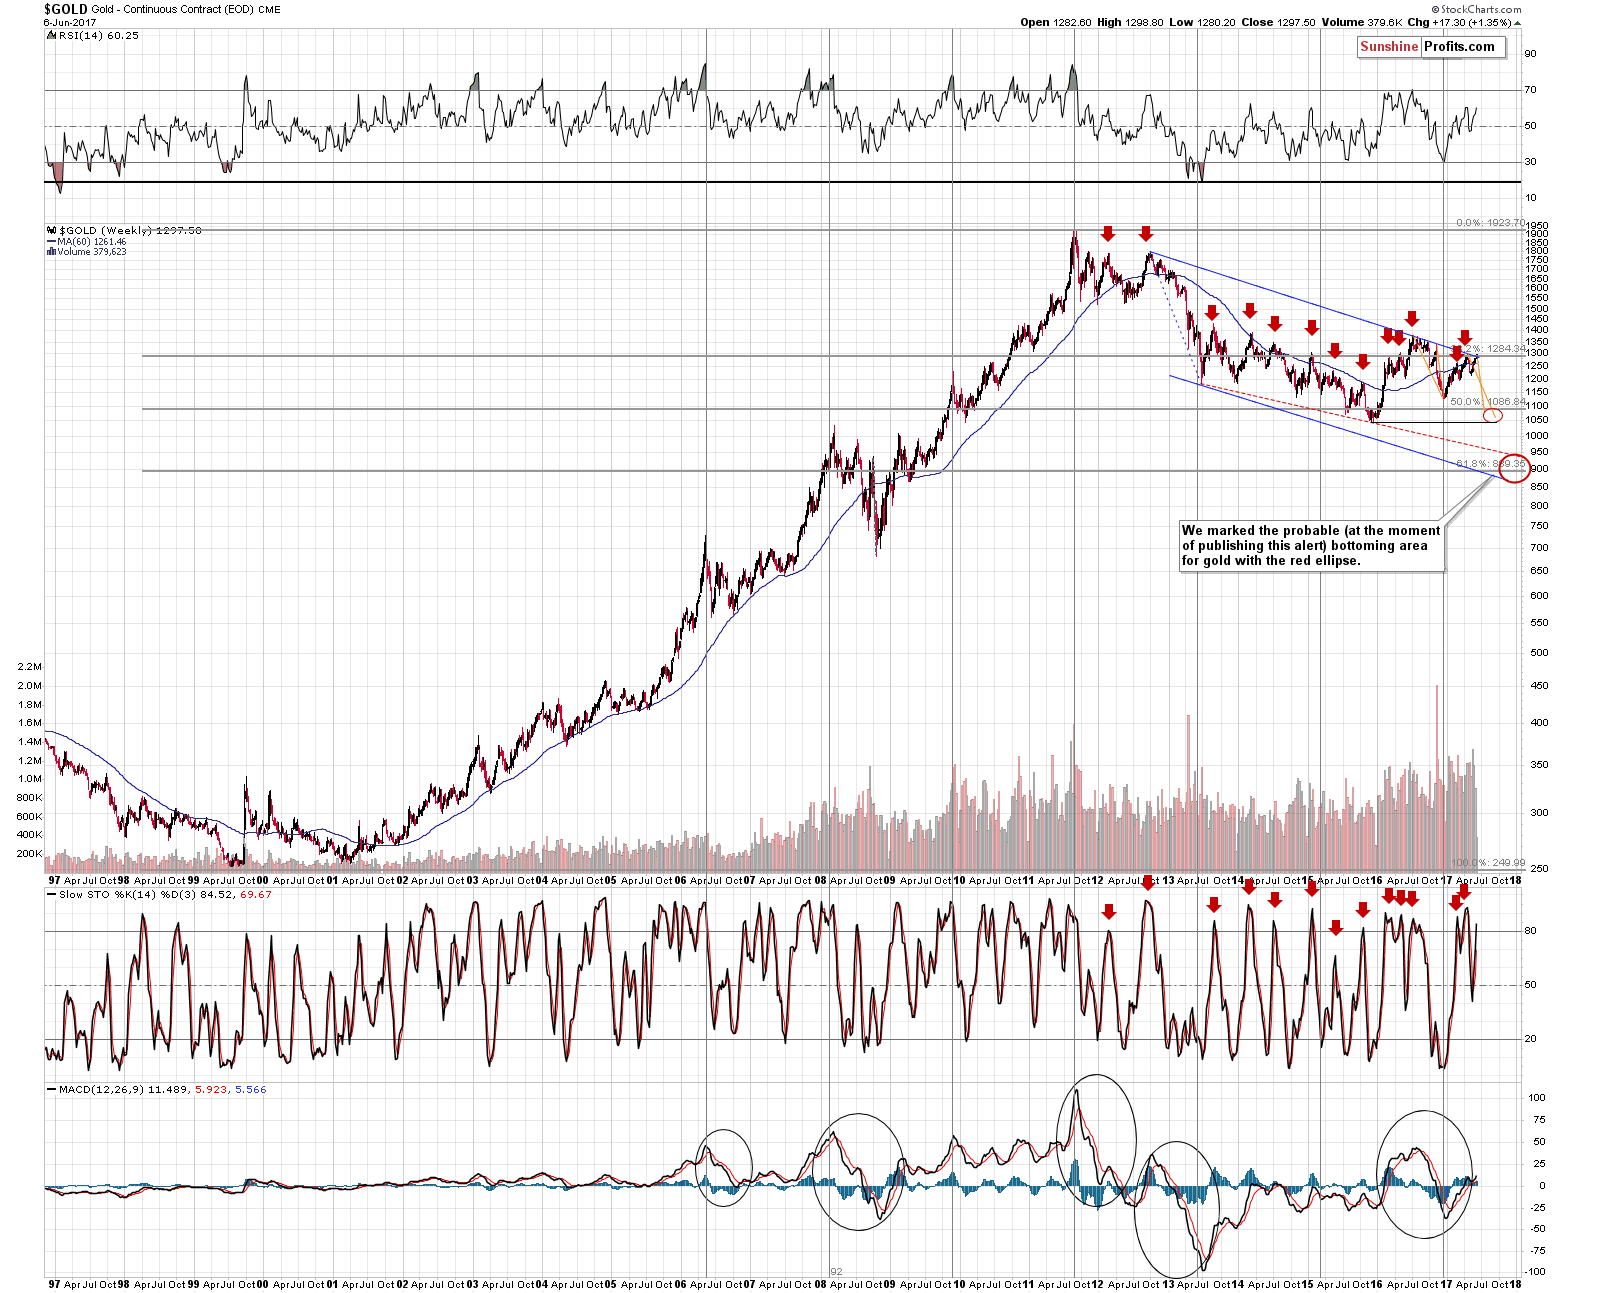
Gold moved to its declining resistance line and even moved temporarily above it, but since it’s already back below $1,290, the tiny breakout was already invalidated.
This line stopped the rally previously, many times in the second half of 2016, so it’s already a proven resistance and it’s unlikely that it will be significantly broken.
Gold moved a little above a long-term, declining resistance line on the linear scale, but let’s keep in mind that the logarithmic scale is much more reliable in the case of long-term moves.
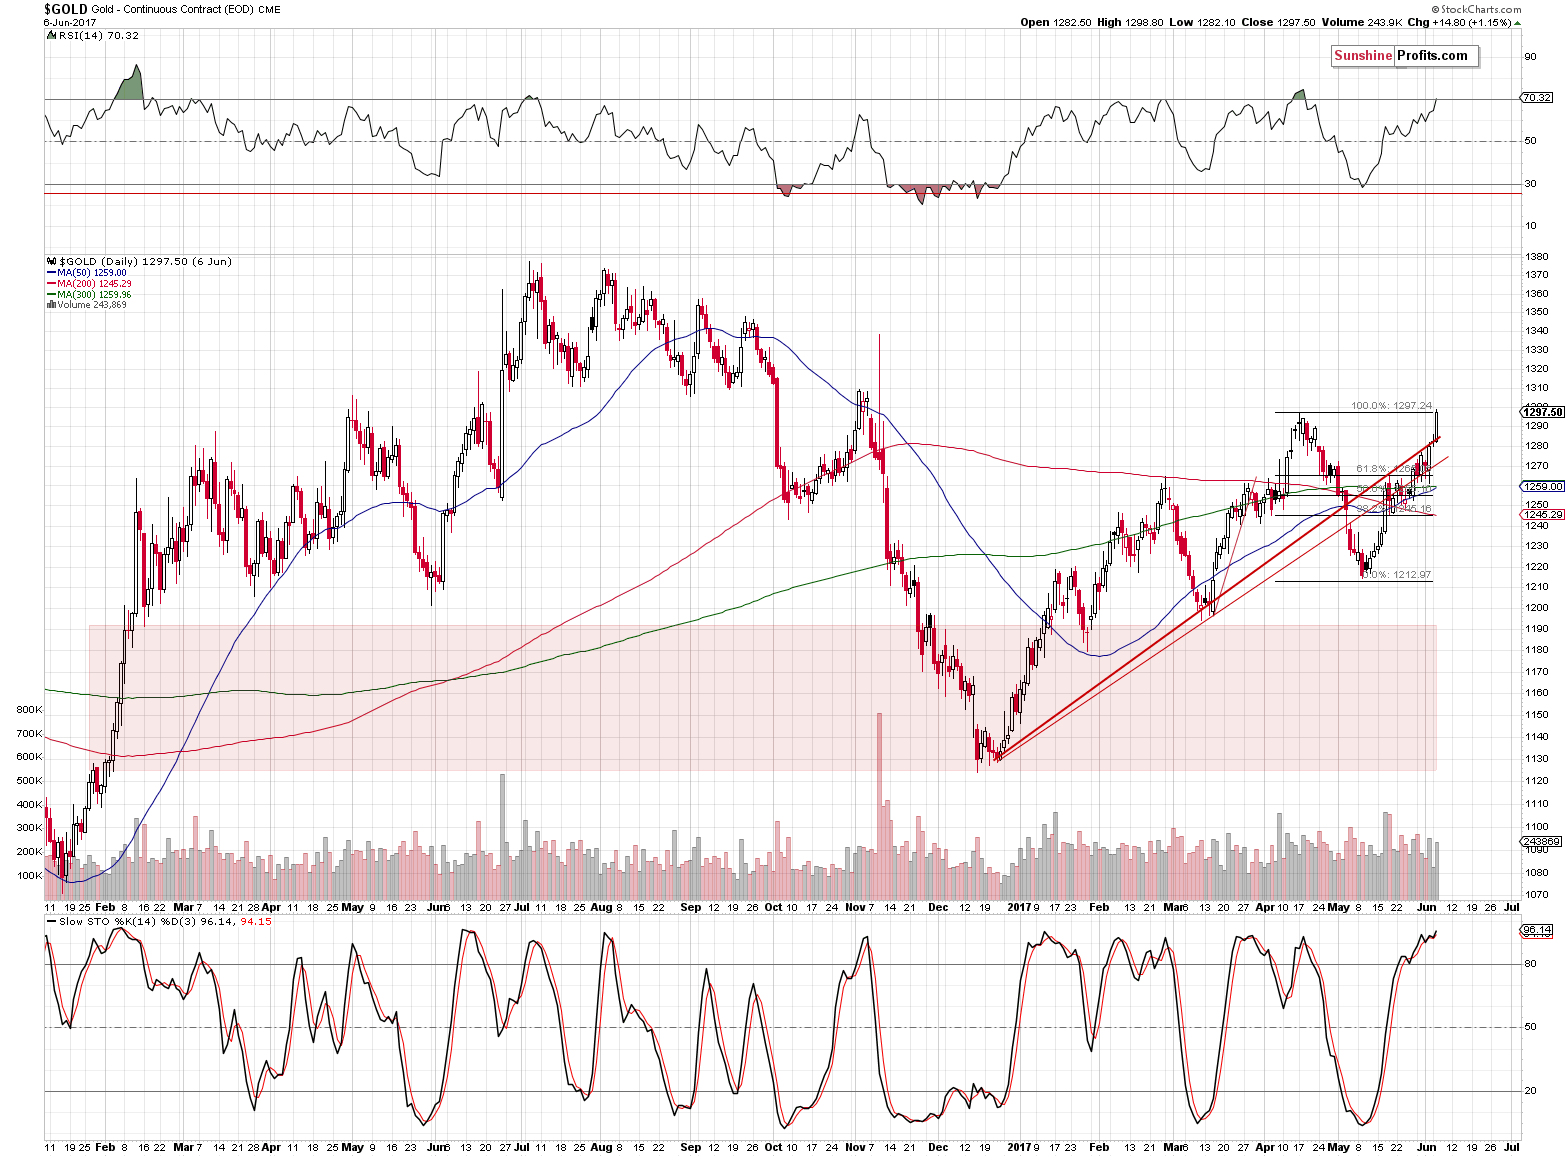
On gold’s short-term chart we see that the yellow metal moved to its previous highs and that the RSI moved to the 70 level. Both are likely to trigger a downswing.
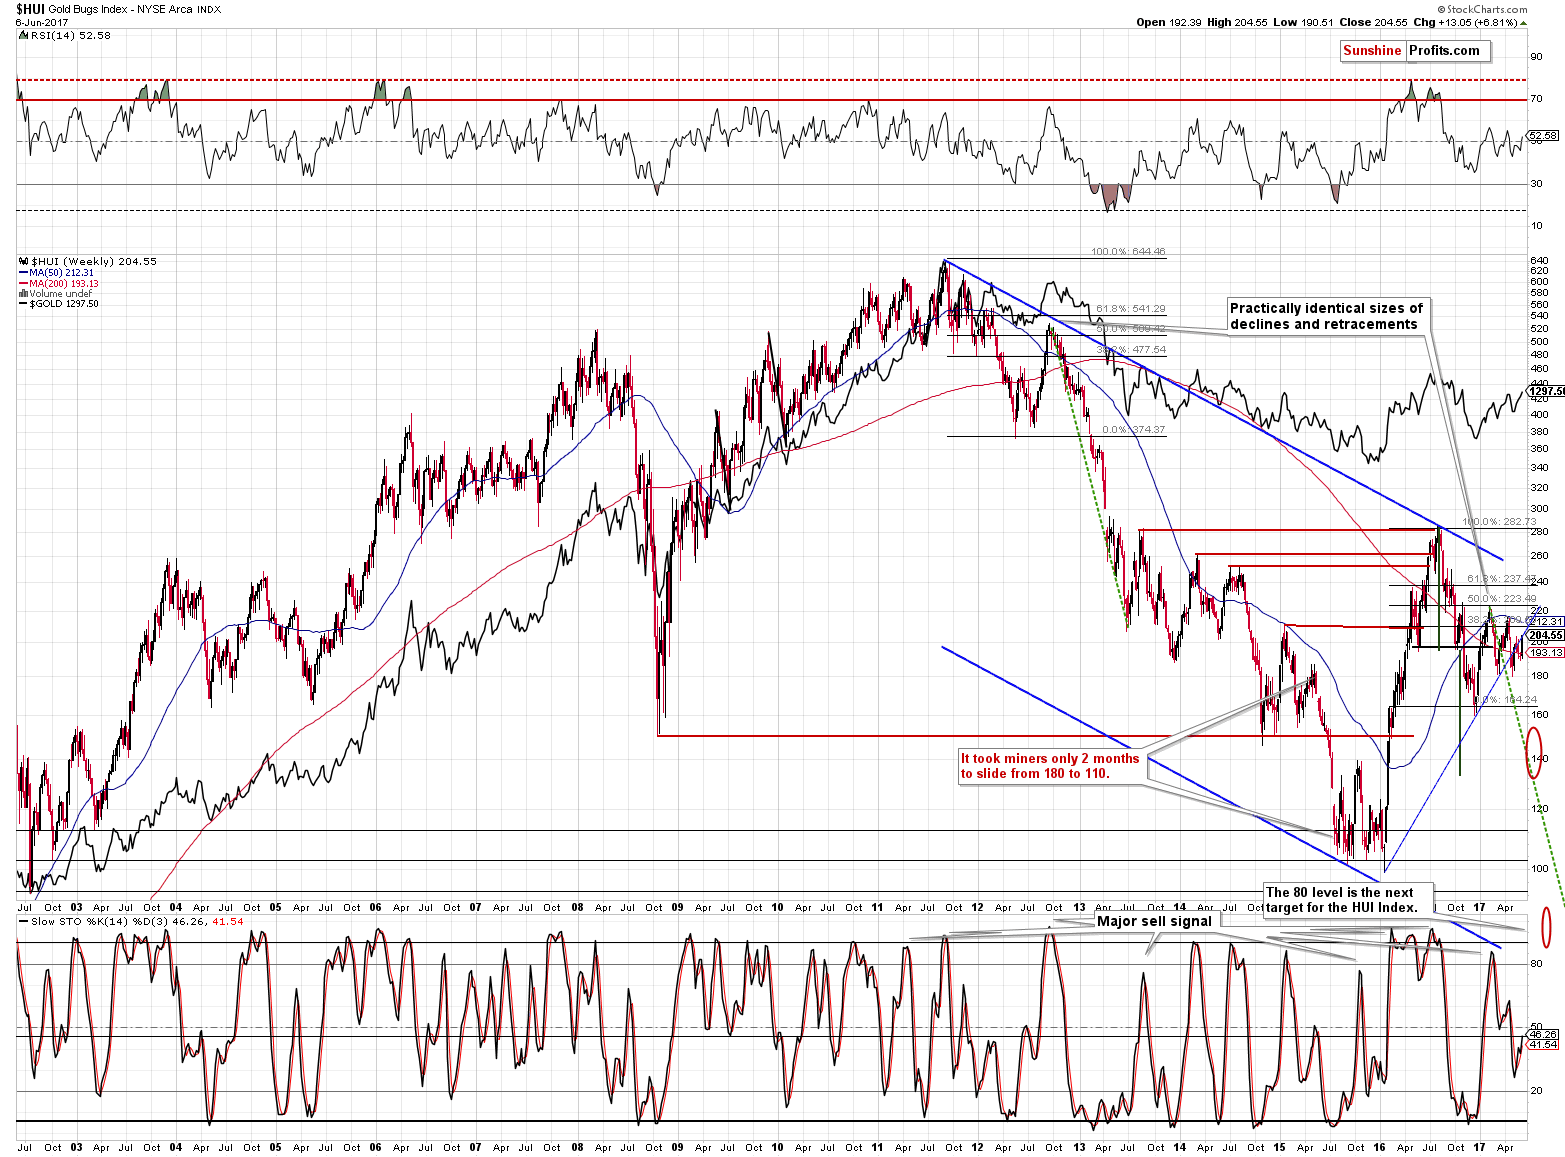
Gold stocks indeed moved higher yesterday, but the move was not as significant as it may seem at first sight. In fact, all miners did was verify the previous big breakdown – they moved back to the rising resistance line without breaking it. Consequently, nothing really changed and the outlook remains bearish.
USD Index and Its Implications
We previously commented on the above chart in the following way:
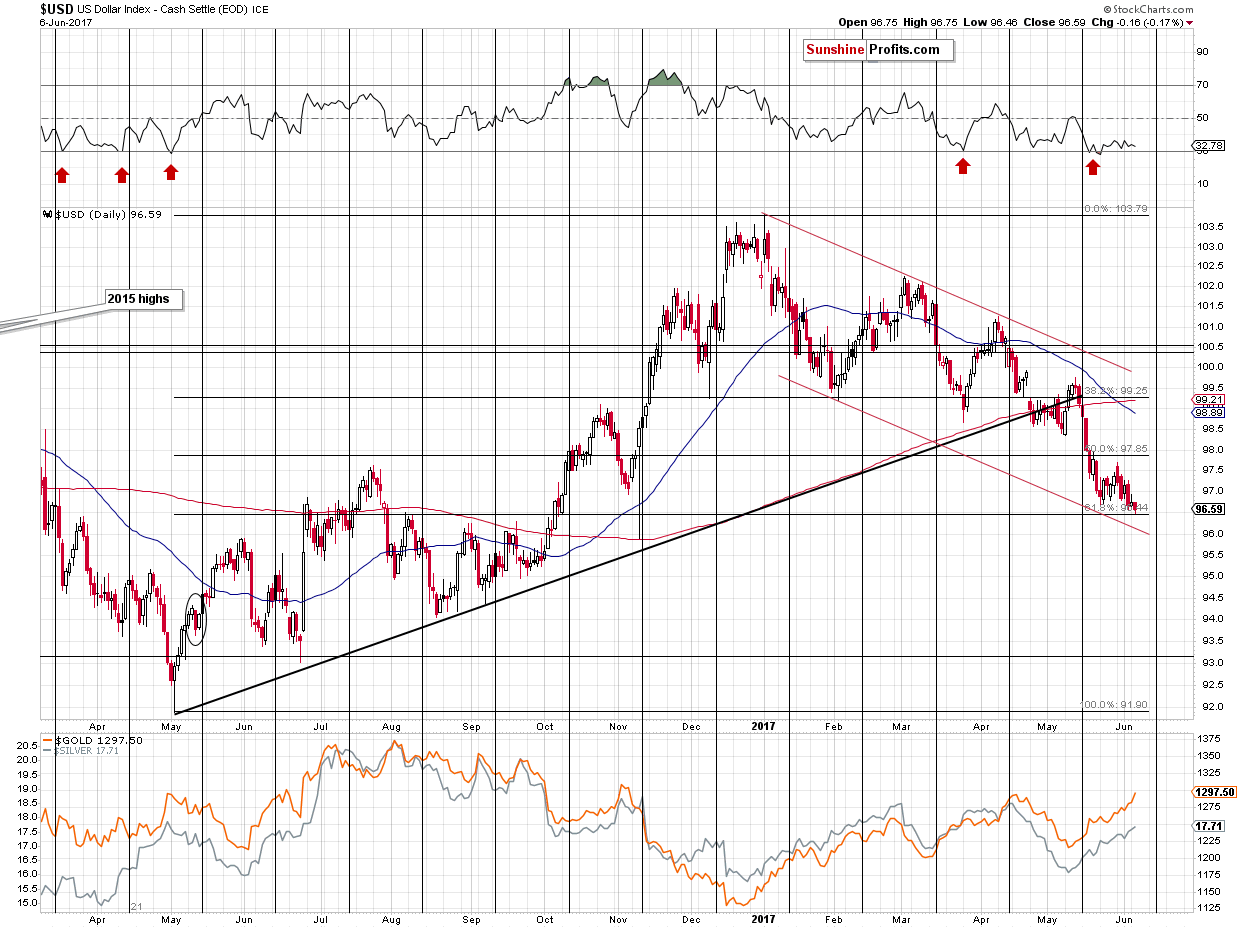
The USD Index moved lower, but not to the target 61.8% Fibonacci retracement level at about 96.40. Therefore, it could move a little lower this week only to come back up with a vengeance. Any additional decline here would likely result in a move lower in the RSI indicator – possibly below 30 – and another buy signal from the latter. In other words, it looks like the bottom is in or – more likely – just around the corner.
As you can see on the above chart, the USD Index finally touched its 61.8% Fibonacci retracement, which suggests that a turnaround is likely. In fact, the USD Index is already moving higher today. The implications for the precious metals market are bearish.
Finally, gold was making headlines yesterday on most major financial websites, which indicates that the optimism is reaching extreme level – that’s something that usually accompanies local tops, not buying opportunities. Still, mentions of gold in the headlines likely attracted the general investment public, which is likely to exit the market at lower prices, thus contributing to the decline’s volatility, but in the meantime, the above can result in gold trading close to the current price levels for a few additional days.
Summing up, even though yesterday’s price moves may have appeared significant, they actually changed very little. Important resistance levels were reached in gold and gold stocks and an important support was reached in the case of the USD Index. The precious metals market remains to be in the pennies to the upside and dollars to the downside territory (literally in the case of silver and the GDX) and thus the overall outlook remains bearish.
As always, we will keep you – our subscribers – informed.
To summarize:
Trading capital (supplementary part of the portfolio; our opinion): Short positions (150% of the full position) in gold, silver and mining stocks are justified from the risk/reward perspective with the following stop-loss orders and initial target price levels / profit-take orders:
- Gold: exit-profit-take level: $1,063; stop-loss: $1,317; initial target price for the DGLD ETN: $81.88; stop-loss for the DGLD ETN $44.57
- Silver: initial target price: $13.12; stop-loss: $19.22; initial target price for the DSLV ETN: $46.18; stop-loss for the DSLV ETN $17.93
- Mining stocks (price levels for the GDX ETF): initial target price: $9.34; stop-loss: $26.34; initial target price for the DUST ETF: $143.56; stop-loss for the DUST ETF $21.37
In case one wants to bet on junior mining stocks' prices (we do not suggest doing so – we think senior mining stocks are more predictable in the case of short-term trades – if one wants to do it anyway, we provide the details), here are the stop-loss details and initial target prices:
- GDXJ ETF: initial target price: $14.13; stop-loss: $45.31
- JDST ETF: initial target price: $417.04; stop-loss: $43.12
Long-term capital (core part of the portfolio; our opinion): No positions (in other words: cash)
Insurance capital (core part of the portfolio; our opinion): Full position
Please note that the in the trading section we describe the situation for the day that the alert is posted. In other words, it we are writing about a speculative position, it means that it is up-to-date on the day it was posted. We are also featuring the initial target prices, so that you can decide whether keeping a position on a given day is something that is in tune with your approach (some moves are too small for medium-term traders and some might appear too big for day-traders).
Plus, you might want to read why our stop-loss orders are usually relatively far from the current price.
Please note that a full position doesn’t mean using all of the capital for a given trade. You will find details on our thoughts on gold portfolio structuring in the Key Insights section on our website.
As a reminder – “initial target price” means exactly that – an “initial” one, it’s not a price level at which we suggest closing positions. If this becomes the case (like it did in the previous trade) we will refer to these levels as levels of exit orders (exactly as we’ve done previously). Stop-loss levels, however, are naturally not “initial”, but something that, in our opinion, might be entered as an order.
Since it is impossible to synchronize target prices and stop-loss levels for all the ETFs and ETNs with the main markets that we provide these levels for (gold, silver and mining stocks – the GDX ETF), the stop-loss levels and target prices for other ETNs and ETF (among other: UGLD, DGLD, USLV, DSLV, NUGT, DUST, JNUG, JDST) are provided as supplementary, and not as “final”. This means that if a stop-loss or a target level is reached for any of the “additional instruments” (DGLD for instance), but not for the “main instrument” (gold in this case), we will view positions in both gold and DGLD as still open and the stop-loss for DGLD would have to be moved lower. On the other hand, if gold moves to a stop-loss level but DGLD doesn’t, then we will view both positions (in gold and DGLD) as closed. In other words, since it’s not possible to be 100% certain that each related instrument moves to a given level when the underlying instrument does, we can’t provide levels that would be binding. The levels that we do provide are our best estimate of the levels that will correspond to the levels in the underlying assets, but it will be the underlying assets that one will need to focus on regarding the signs pointing to closing a given position or keeping it open. We might adjust the levels in the “additional instruments” without adjusting the levels in the “main instruments”, which will simply mean that we have improved our estimation of these levels, not that we changed our outlook on the markets. We are already working on a tool that would update these levels on a daily basis for the most popular ETFs, ETNs and individual mining stocks.
Our preferred ways to invest in and to trade gold along with the reasoning can be found in the how to buy gold section. Additionally, our preferred ETFs and ETNs can be found in our Gold & Silver ETF Ranking.
As always, we'll keep you - our subscribers - updated should our views on the market change. We will continue to send out Gold & Silver Trading Alerts on each trading day and we will send additional Alerts whenever appropriate.
The trading position presented above is the netted version of positions based on subjective signals (opinion) from your Editor, and the Tools and Indicators.
As a reminder, Gold & Silver Trading Alerts are posted before or on each trading day (we usually post them before the opening bell, but we don't promise doing that each day). If there's anything urgent, we will send you an additional small alert before posting the main one.
=====
Latest Free Trading Alerts:
This week, the Arab world’s biggest powers cut ties with Qatar. What does it mean for the gold market?
After the French presidential election, gold lost some of safe-haven bids, as investor appetites increased for risky assets. Does it mean that the yellow metal is doomed to oblivion? We invite you to read our today’s article about the recent most important macroeconomic and geopolitical developments and find out what are their possible implications for the gold market.
Geopolitical Risks in Retreat. Will Gold Drown?
=====
Hand-picked precious-metals-related links:
PRECIOUS-Gold holds near 7-mth high ahead of key events
Gold Makes Run Toward $1,300 as Risk Flares From U.K. to Mideast
=====
In other news:
What the ECB Will Do This Week
Spain's Santander rescues Banco Popular from collapse
Short-seller Jim Chanos identifies areas in the U.S. where he is 'more bearish'
The Global Economy Will Grow at Its Fastest Pace In Six Years: OECD
Market Recon: The Market Is Telling You It Doesn't Trust the Federal Reserve -- Recession Lurking?
Australia's economic winning streak is epic, but it's not a record
Bill Gross Says Market Risk Is Highest Since Before 2008 Crisis
=====
Thank you.
Sincerely,
Przemyslaw Radomski, CFA
Founder, Editor-in-chief, Gold & Silver Fund Manager
Gold & Silver Trading Alerts
Forex Trading Alerts
Oil Investment Updates
Oil Trading Alerts

