

Briefly: In our opinion, full (150% of the regular full position) speculative short positions in gold, silver and mining stocks are justified from the risk/reward perspective. This position was originally featured on Jan. 12, 2017 at 3:49PM.
During yesterday’s session, precious metals and the related markets either didn’t do much or moved in tune with what we had written in yesterday’s alert. Consequently, all yesterday’s points remain up-to-date also today and thus today’s alert will to a large extent will be a follow-up to yesterday’s issue.
Let’s jump right into the charts, starting the U.S. currency(charts courtesy of http://stockcharts.com).
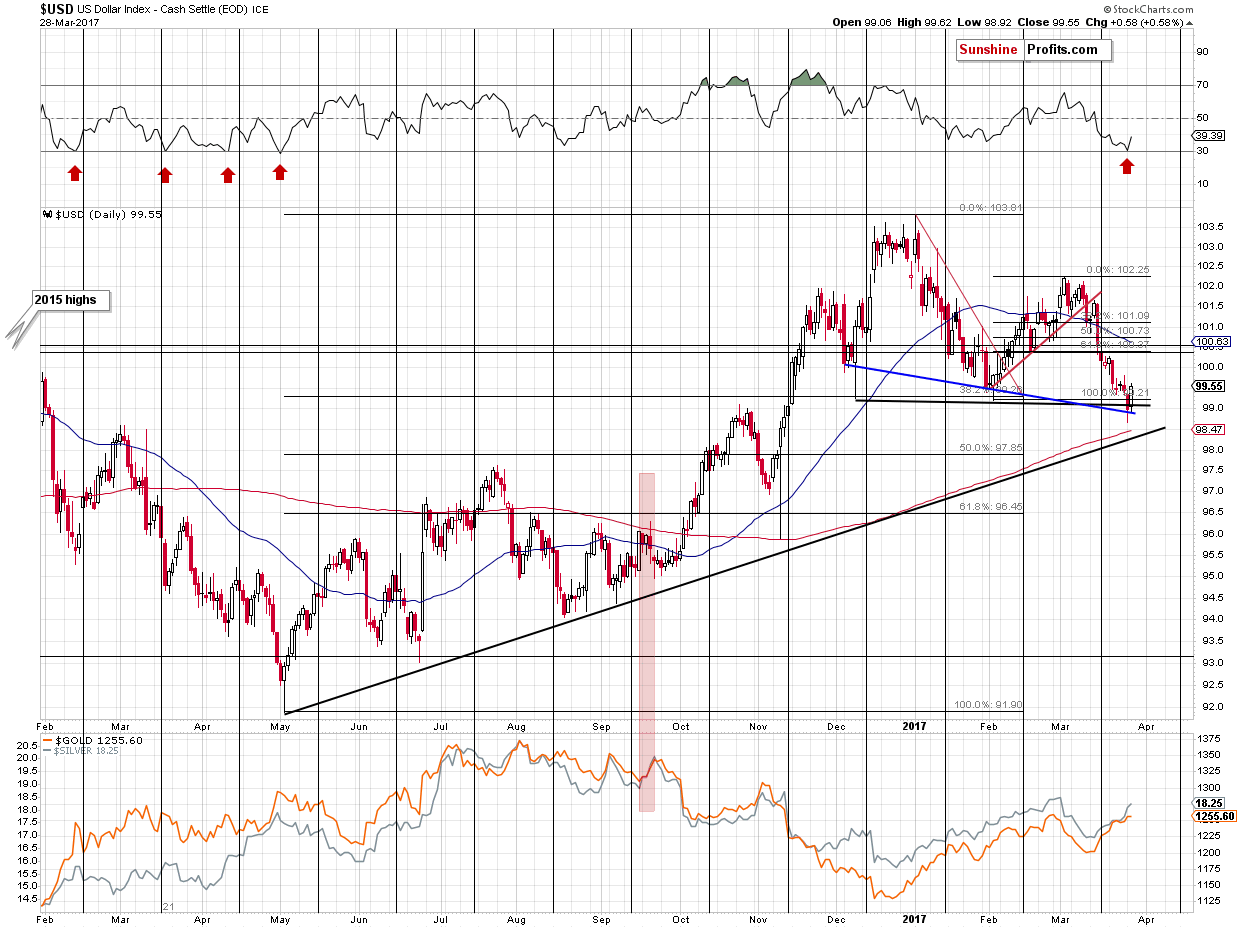
In the previous alerts we wrote that – being unconfirmed – the decline and the small breakdown in the USD Index should not have been taken at their face value and that their invalidation was actually likely. That’s exactly what we saw yesterday and what we are seeing today. At the moment of writing these words, the USD Index is trading at about 99.85, so it’s crystal clear that the breakdown below the February bottom was invalidated.
An invalidation of a breakdown is generally a very bullish sign, but this time it’s even more bullish than usually. Why? Because the USD Index just invalidated its head-and-shoulders pattern.
In the March 13th alert, we wrote the following:
The head-and-shoulders patterns in the USD Index are quite often misleading (and as Nadia Simmons says regarding these patterns in case of USD Index’s biggest component – the EUR/USD pair – are anti-reliable as so many of them have the effect that is opposite to the expected one) and thus we can actually expect a rally in the following weeks instead of a decline – just like what we saw in October 2016 and the following months.
In light of the above, it was quite interesting to read that quite a few analysts pointed out that the USD Index formed a head-and-shoulders pattern. Contrary to these analysts’ expectations, the implications thereof were not bearish, but bullish as so many of these patterns are invalidated. What happened? The USD invalidated the pattern and the short-term outlook is bullish.
Some may argue that the only part of the USD Index that’s worth watching is the Japanese yen. We disagree as other currency pairs (including EUR/USD) are important as well – whether or not the index moves in tune with gold shows just how well gold acts with regard to the overall (!) currency moves. There are many factors that “should” influence the price of gold in terms of the USD, but it’s usually not easy to interpret them (For instance: if the employment numbers are weak, is it a bullish factor for gold? Not if the market had been expecting even weaker numbers). Gold’s value in terms of different currencies is something different – if the value of the U.S. dollar declines, but the demand for it from the Eurozone remains unchanged, the price of gold in terms of the euro should remain stable, but its price in terms of the U.S. dollar should rise (otherwise everyone in the Eurozone would buy the USD and use it to buy gold at price that would be effectively lower than what they would have to pay with euros). This makes the movement in the USD Index a universal factor, to which gold’s strength can be compared – we know that its movement should (!) cause a given move in gold (in terms of the USD). If it doesn’t, we have a trading signal.
Still, let’s take a look at the Japanese currency.
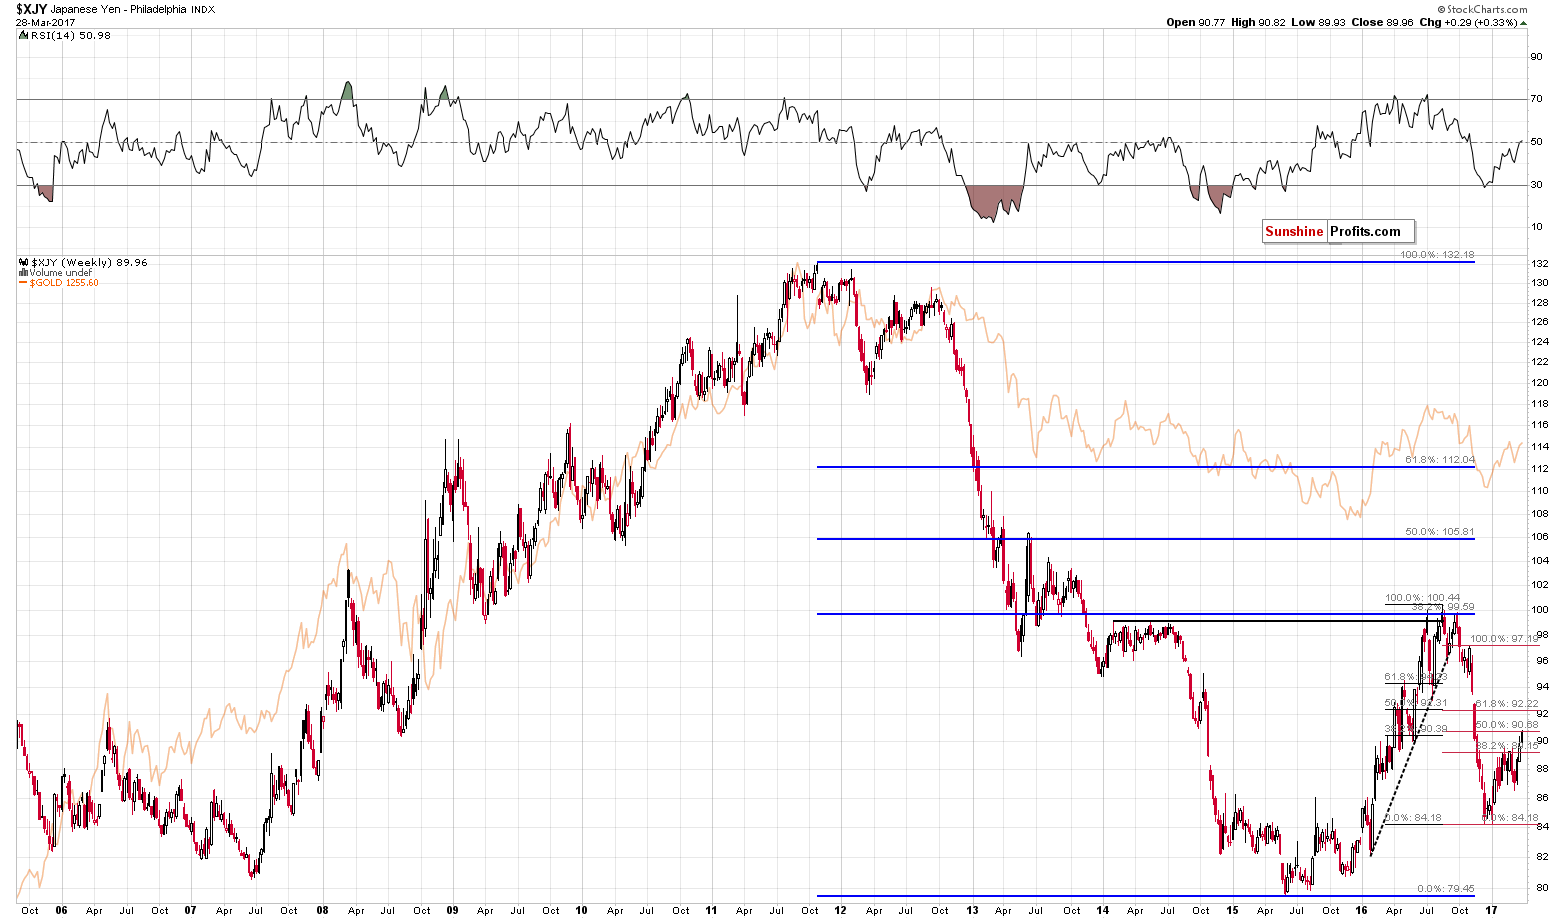
The Japanese currency moved higher but it just encountered a combination of 2 strong resistance levels. Both are created by the Fibonacci retracement levels and the big blue pattern shows that this technique should not be ignored for this market. The 2 resistance levels are the 50% retracement based on the quick slide (marked in red) and the 38.2% retracement based on the entire 2016 decline (marked in black). Each of these levels is an important resistance and their combination is even more powerful.
Moreover, the RSI indicator moved to the 50 level – something that translated into local tops in many cases in 2013 and 2014. It seems that a reversal in the Japanese yen should not surprise us (more details and regular analysis of this currency pair are available in our Forex Trading Alerts).
Also, please note that even though yen moved above its 2017 high, gold didn’t – one more sign that gold underperforms.
Gold didn’t do much yesterday and our yesterday’s comments remain up-to-date:
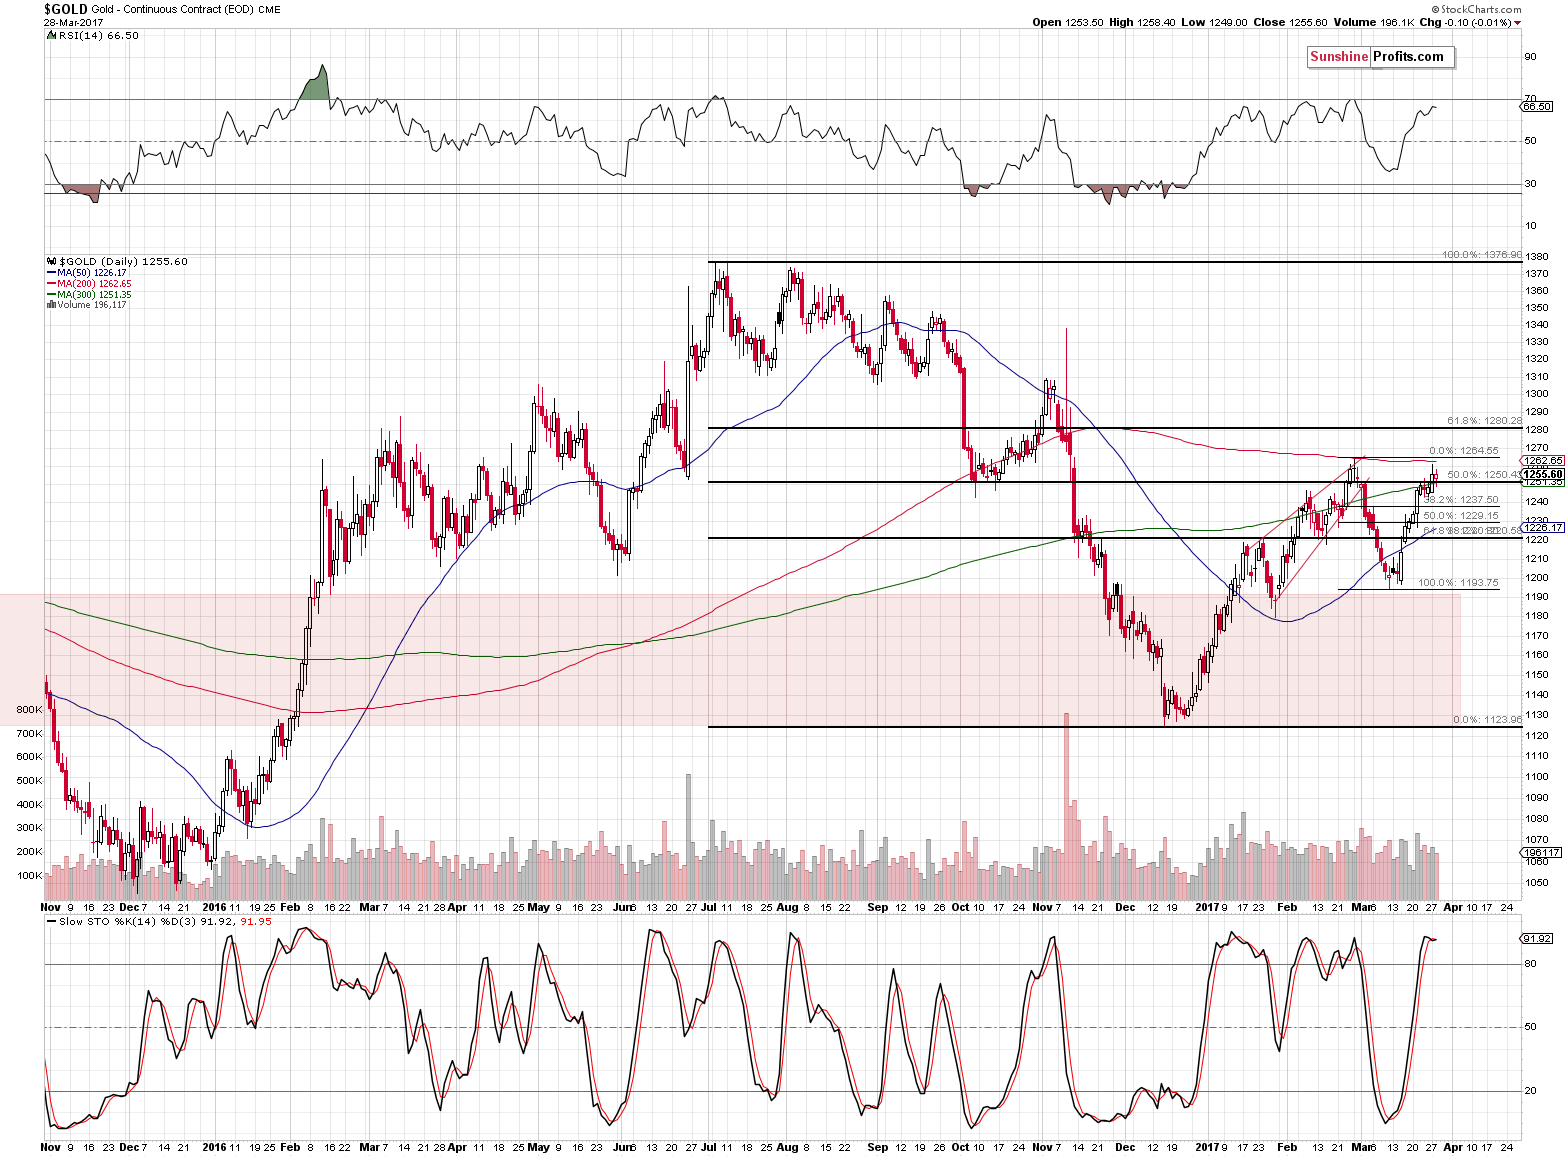
Just as the USD Index reversed yesterday, before the end of the session, gold did the same thing. As we discussed yesterday, gold moved to its February high and the 200-day moving average. Both are strong resistance levels and their combination is even stronger. Will it be enough to stop gold’s rally? It’s quite likely, especially that the volume on which gold moved higher on Friday was relatively low and this move was accompanied by silver’s outperformance (the white metal tends to outperform in the final parts of an upswing).
Gold’s volume that we saw yesterday wasn’t low, but that’s not what’s expected during reversals and thus it’s not necessarily a bullish phenomenon. Gold touched, but didn’t break the mentioned combination of resistance levels and – given the situation in the USD Index and also other factors – it’s not likely to break it or confirm such a breakout. There is a small sell signal from the Stochastic indicator, but it’s not one of the most important signals.
The mentioned outperformance of the white metal is.
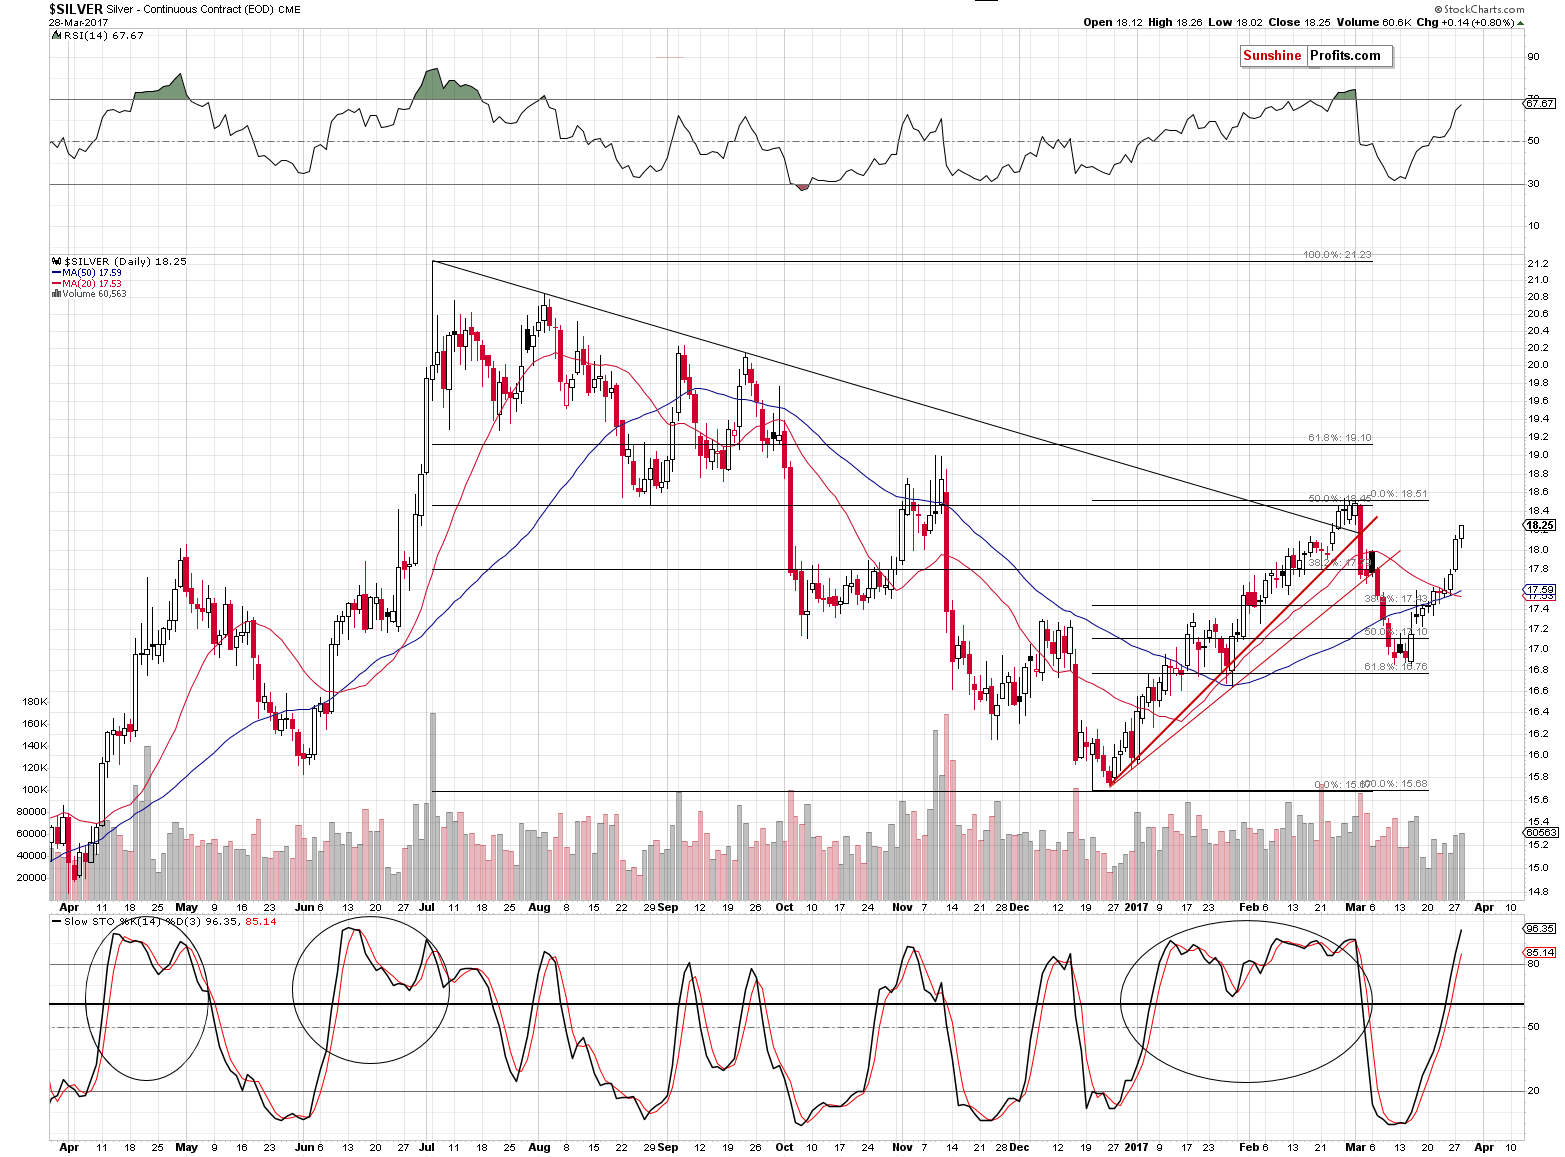
Silver’s outperformance continued yesterday (as you can see on the above chart), but as of today, silver is back at $18.10. Overall, our yesterday’s comments remain up-to-date:
In the past years, there were numerous times when silver faked a rally, breakout or even outperformed just on an intra-day basis right before turning south. Why is this the case? There is no way to say with 100% certainty why a given move has really happened, but it’s quite likely related to the fact that the silver market is much smaller than the one for gold and thus the share of individual investors compared to the share of big, institutional (professional) investors is much bigger.
One of the lesser known gold trading tips is that the general public is usually most eager to buy close to tops and thus we see that silver (to a bigger extent driven by these investors) outperforms gold right before tops. This is not always the case and doesn’t have to be the case, but it very often is – often enough to view silver’s outperformance (especially when accompanied by mining stocks’ underperformance) as something important and bearish.
Speaking of mining stocks’ underperformance, let’s take a look at the GDX.
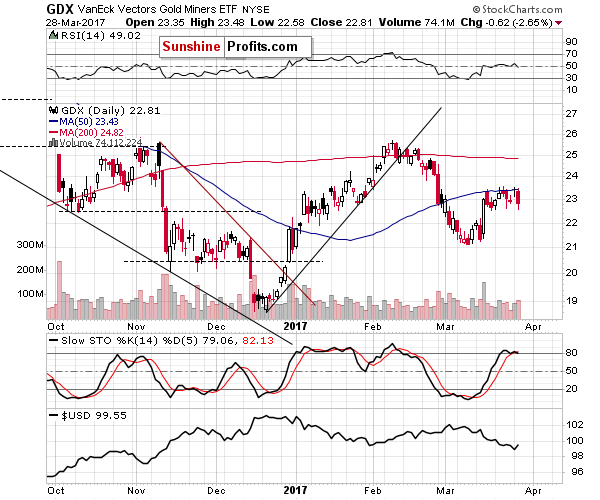
Mining stocks’ underperformance very visibly continued yesterday. Miners declined on relatively big volume, which is even more profound when one takes into account the stock market rally.
Again, our yesterday’s comments, as well as the summary of the alert, remain up-to-date:
Mining stocks are not following gold higher. GDX closed at its 50-day moving average, unable to generate a visible rally even though gold and silver moved visibly higher. Miners simply moved to last week’s high – not above it. Moreover, please note that mining stocks are not even close to their February highs, which proves that their underperformance is not only a one-day event.
Summing up, the move to the February high in gold might highlight this rally’s end just as the USD’s temporary breakdown below 99 and its invalidation could mark the end of the decline in the U.S. dollar. The long-term analogy to 2002 and 2003 in the USD Index remains in place and the outlook for the following weeks remains bearish for the precious metals market.
As always, we will keep you – our subscribers – informed.
To summarize:
Trading capital (supplementary part of the portfolio; our opinion): Short positions (150% of the full position) in gold, silver and mining stocks are justified from the risk/reward perspective with the following stop-loss orders and initial target price levels / profit-take orders:
- Gold: exit-profit-take level: $1,063; stop-loss: $1,273; initial target price for the DGLD ETN: $81.88; stop-loss for the DGLD ETN $48.17
- Silver: initial target price: $13.12; stop-loss: $18.67; initial target price for the DSLV ETN: $46.18; stop-loss for the DSLV ETN $19.87
- Mining stocks (price levels for the GDX ETF): initial target price: $9.34; stop-loss: $26.34; initial target price for the DUST ETF: $143.56; stop-loss for the DUST ETF $21.37
In case one wants to bet on junior mining stocks' prices (we do not suggest doing so – we think senior mining stocks are more predictable in the case of short-term trades – if one wants to do it anyway, we provide the details), here are the stop-loss details and initial target prices:
- GDXJ ETF: initial target price: $14.13; stop-loss: $45.31
- JDST ETF: initial target price: $104.26; stop-loss: $10.78
Long-term capital (core part of the portfolio; our opinion): No positions (in other words: cash)
Insurance capital (core part of the portfolio; our opinion): Full position
Please note that the in the trading section we describe the situation for the day that the alert is posted. In other words, it we are writing about a speculative position, it means that it is up-to-date on the day it was posted. We are also featuring the initial target prices, so that you can decide whether keeping a position on a given day is something that is in tune with your approach (some moves are too small for medium-term traders and some might appear too big for day-traders).
Plus, you might want to read why our stop-loss orders are usually relatively far from the current price.
Please note that a full position doesn’t mean using all of the capital for a given trade. You will find details on our thoughts on gold portfolio structuring in the Key Insights section on our website.
As a reminder – “initial target price” means exactly that – an “initial” one, it’s not a price level at which we suggest closing positions. If this becomes the case (like it did in the previous trade) we will refer to these levels as levels of exit orders (exactly as we’ve done previously). Stop-loss levels, however, are naturally not “initial”, but something that, in our opinion, might be entered as an order.
Since it is impossible to synchronize target prices and stop-loss levels for all the ETFs and ETNs with the main markets that we provide these levels for (gold, silver and mining stocks – the GDX ETF), the stop-loss levels and target prices for other ETNs and ETF (among other: UGLD, DGLD, USLV, DSLV, NUGT, DUST, JNUG, JDST) are provided as supplementary, and not as “final”. This means that if a stop-loss or a target level is reached for any of the “additional instruments” (DGLD for instance), but not for the “main instrument” (gold in this case), we will view positions in both gold and DGLD as still open and the stop-loss for DGLD would have to be moved lower. On the other hand, if gold moves to a stop-loss level but DGLD doesn’t, then we will view both positions (in gold and DGLD) as closed. In other words, since it’s not possible to be 100% certain that each related instrument moves to a given level when the underlying instrument does, we can’t provide levels that would be binding. The levels that we do provide are our best estimate of the levels that will correspond to the levels in the underlying assets, but it will be the underlying assets that one will need to focus on regarding the signs pointing to closing a given position or keeping it open. We might adjust the levels in the “additional instruments” without adjusting the levels in the “main instruments”, which will simply mean that we have improved our estimation of these levels, not that we changed our outlook on the markets. We are already working on a tool that would update these levels on a daily basis for the most popular ETFs, ETNs and individual mining stocks.
Our preferred ways to invest in and to trade gold along with the reasoning can be found in the how to buy gold section. Additionally, our preferred ETFs and ETNs can be found in our Gold & Silver ETF Ranking.
As always, we'll keep you - our subscribers - updated should our views on the market change. We will continue to send out Gold & Silver Trading Alerts on each trading day and we will send additional Alerts whenever appropriate.
The trading position presented above is the netted version of positions based on subjective signals (opinion) from your Editor, and the Tools and Indicators.
As a reminder, Gold & Silver Trading Alerts are posted before or on each trading day (we usually post them before the opening bell, but we don't promise doing that each day). If there's anything urgent, we will send you an additional small alert before posting the main one.
=====
Latest Free Trading Alerts:
This week, speeches of most of the FOMC’s twelve members were scheduled to take place . What can we learn from them?
Round of Fed Speeches and Gold
=====
Hand-picked precious-metals-related links:
PRECIOUS-Gold ticks higher as Brexit due to be triggered
Gold Set to Soar to $1,500 as Inflation Makes a Comeback
Shandong Gold Says It May Have Found China's Biggest Gold Mine
=====
In other news:
Britain's May goes into Brexit talks with ambitions high
The Biggest Risk From the Dollar's Drop May Not Be What You Would Guess
Brexit triggered: 5 huge obstacles to an amicable divorce
=====
Thank you.
Sincerely,
Przemyslaw Radomski, CFA
Founder, Editor-in-chief, Gold & Silver Fund Manager
Gold & Silver Trading Alerts
Forex Trading Alerts
Oil Investment Updates
Oil Trading Alerts

