

Briefly: In our opinion, full (150% of the regular full position) speculative short positions in gold, silver and mining stocks are justified from the risk/reward perspective. This position was originally featured on Jan. 12, 2017 at 3:49PM.
In yesterday’s alert we emphasized that the breakdown in the USD Index should not be trusted as it was not confirmed and there were several good reasons to think that it would not be confirmed. The breakdown is already invalidated and – again, as discussed yesterday – this is actually a strong bullish sign. Is the decline in the USD Index over and is the big slide in the precious metals sector just around the corner?
In short, that seems quite likely. Naturally, there’s much more to the precious metals market than just the USD Index and it’s prudent to analyze more factors than just this specific index. In other words, it is of utmost importance especially at this time, but there are many other important signs to keep in mind. Still, let’s start today’s analysis with the U.S. currency (charts courtesy of http://stockcharts.com).
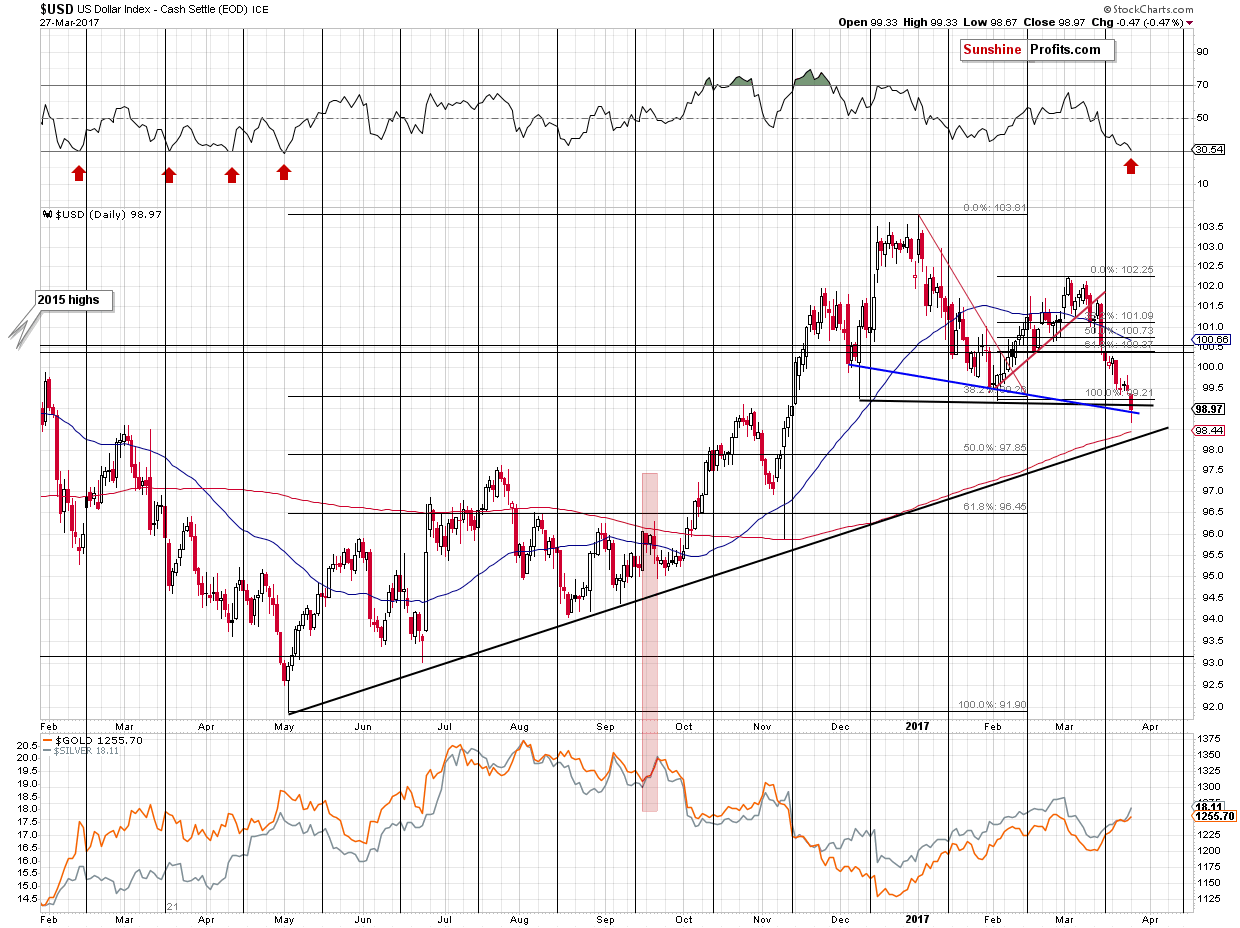
In yesterday’s alert, we commented on the above chart in the following way:
Today’s move to 99 is a small breakdown below the previous lows. Because the move is relatively small and the session in the U.S. is far from being over, it is definitely not confirmed. In fact, it could be quickly erased and the supposedly bearish event could turn into an invalidation of the breakdown, which would be a very bullish sign. For now, today’s move is not something that changes the short-term outlook.
Based on the above chart, the USD Index reversed and closed the session at 98.97 – there reversal is visible, but the breakdown was not really invalidated. However, if we take the closing price from Bloomberg – 99.166, we see that the USD Index closed extremely close to its February low (99.19). Still, no invalidation of the breakdown, but we now see that the breakdown was indeed very tiny. How much does it matter as of this moment? At this moment, the USD Index is trading at 99.21, having earlier moved to 99.347. This means that however one chooses to interpret yesterday’s breakdown or the daily reversal, the breakdown was still invalidated today and the bullish implications are in place anyway.
Additionally, if we focus on daily closing prices alone, then one can argue that there was actually no breakdown at all – the USD Index closed above the declining support line based on the daily closing prices (marked in blue). Either way, the implications of yesterday’s session are not bearish, but bullish.
The RSI indicator has just flashed / is about to flash a major buy signal as it moved to the 30 level. It didn’t move below it, but its proximity seems to be enough to be viewed as a buying opportunity. As you can see on the above chart, the last time when we saw this signal, the USD Index formed a major bottom in early May 2016. This signal also corresponded to a few local bottoms earlier that year.
The outlook for the USD Index is bullish, which has bearish implications for the precious metals market, especially that the latter is responding to the USD’s signals with much smaller strength than one might expect – the USD Index is well below its February monthly close, while gold and silver are relatively close to their own respective February closes.
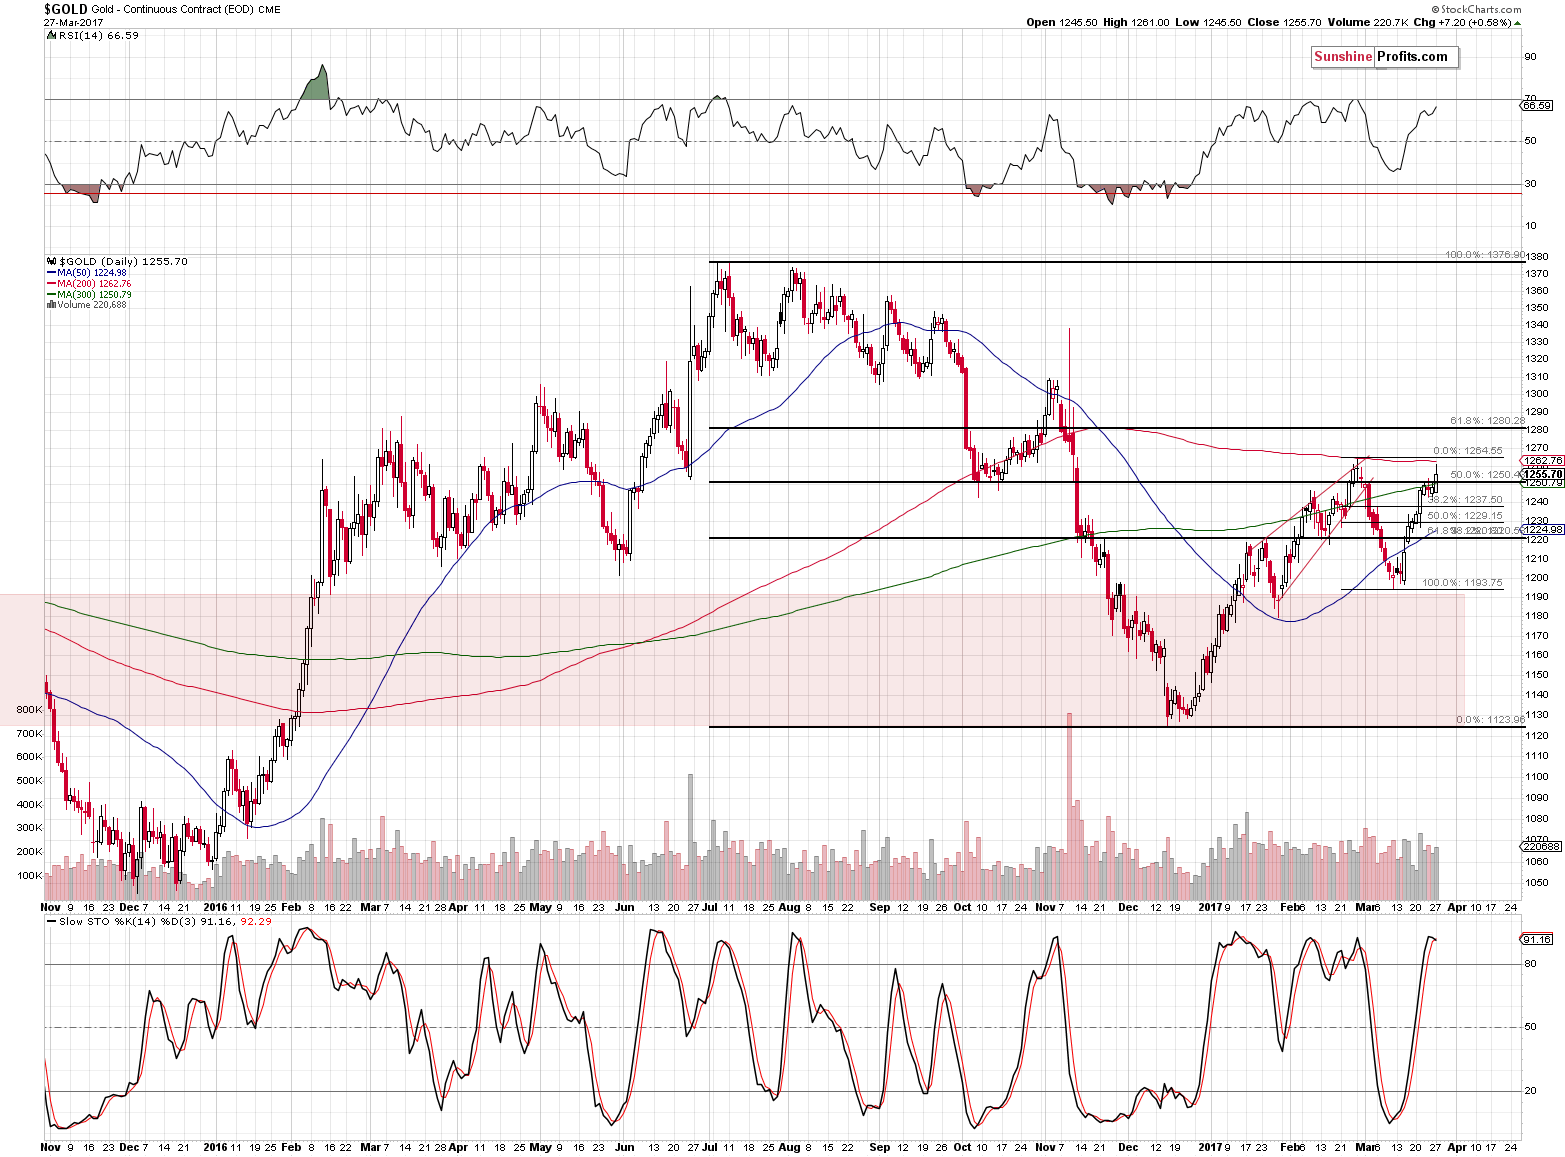
Just as the USD Index reversed yesterday, before the end of the session, gold did the same thing. As we discussed yesterday, gold moved to its February high and the 200-day moving average. Both are strong resistance levels and their combination is even stronger. Will it be enough to stop gold’s rally? It’s quite likely, especially that the volume on which gold moved higher on Friday was relatively low and this move was accompanied by silver’s outperformance (the white metal tends to outperform in the final parts of an upswing).
Gold’s volume that we saw yesterday wasn’t low, but that’s not what’s expected during reversals and thus it’s not necessarily a bullish phenomenon. Gold touched, but didn’t break the mentioned combination of resistance levels and – given the situation in the USD Index and also other factors – it’s not likely to break it or confirm such a breakout. There is a small sell signal from the Stochastic indicator, but it’s not one of the most important signals.
The mentioned outperformance of the white metal is.
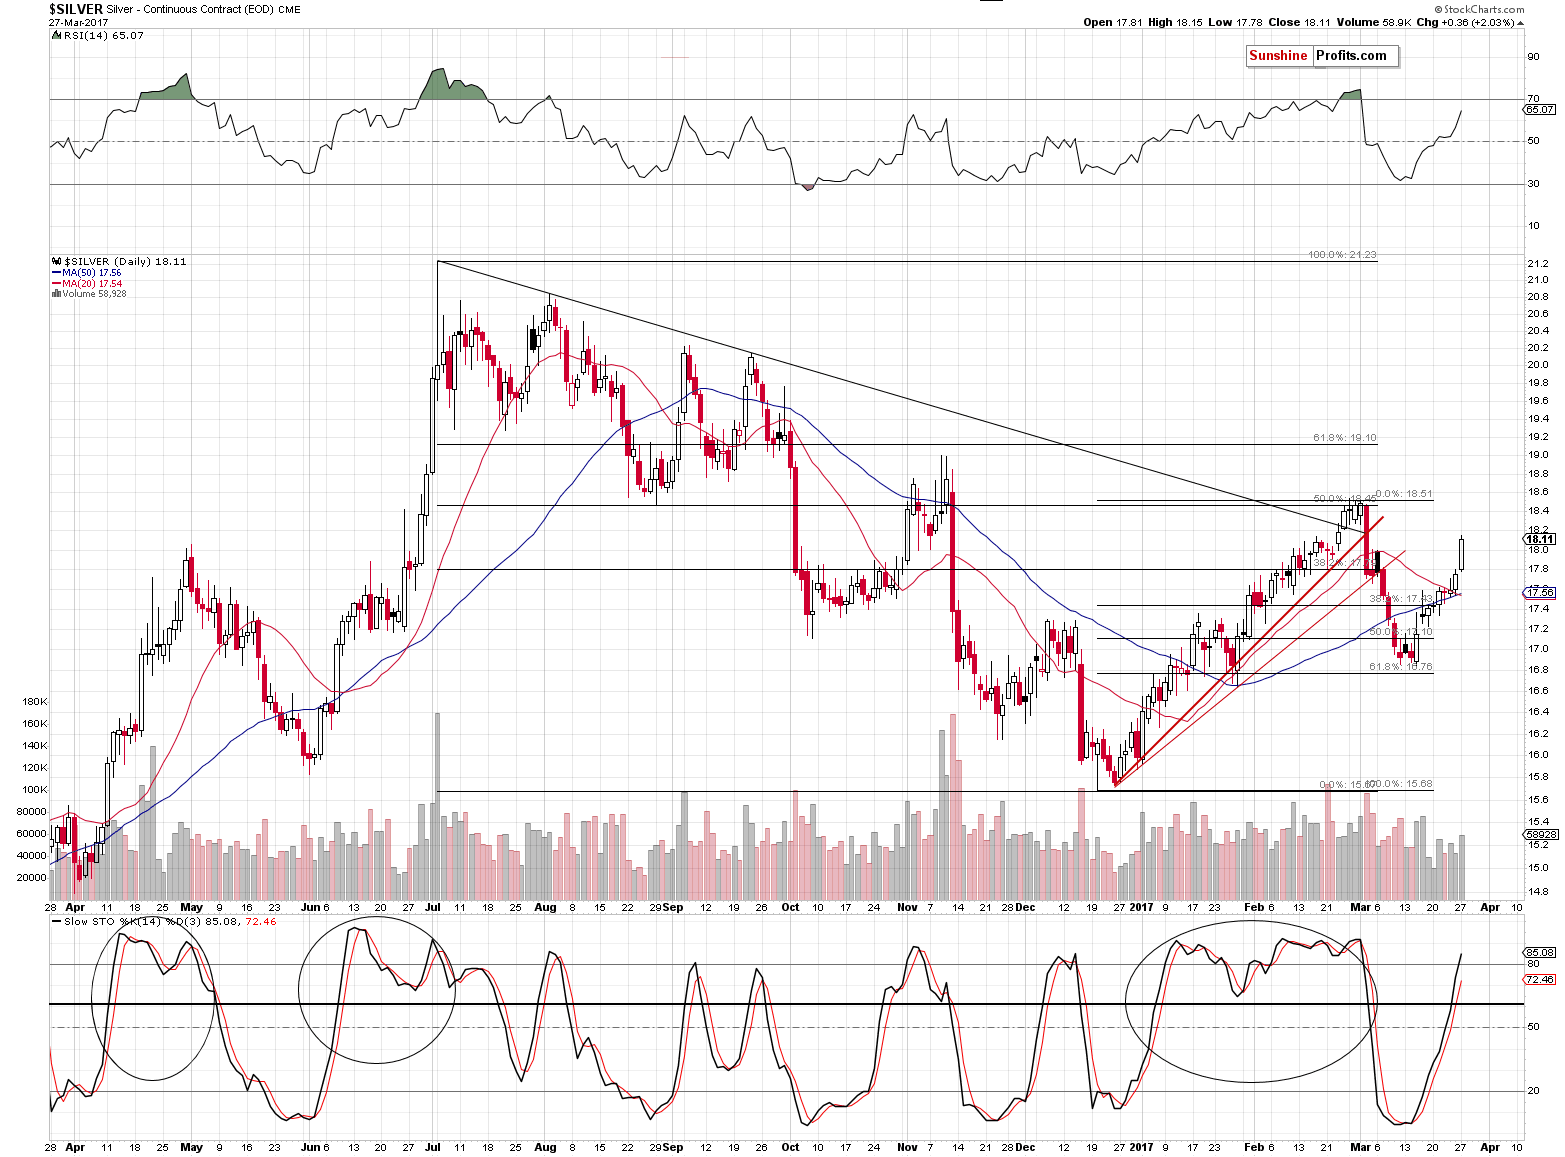
In the past years, there were numerous times when silver faked a rally, breakout or even outperformed just on an intra-day basis right before turning south. Why is this the case? There is no way to say with 100% certainty why a given move has really happened, but it’s quite likely related to the fact that the silver market is much smaller than the one for gold and thus the share of individual investors compared to the share of big, institutional (professional) investors is much bigger.
One of the lesser known gold trading tips is that the general public is usually most eager to buy close to tops and thus we see that silver (to a bigger extent driven by these investors) outperforms gold right before tops. This is not always the case and doesn’t have to be the case, but it very often is – often enough to view silver’s outperformance (especially when accompanied by mining stocks’ underperformance) as something important and bearish.
Speaking of mining stocks’ underperformance, let’s take a look at the GDX.
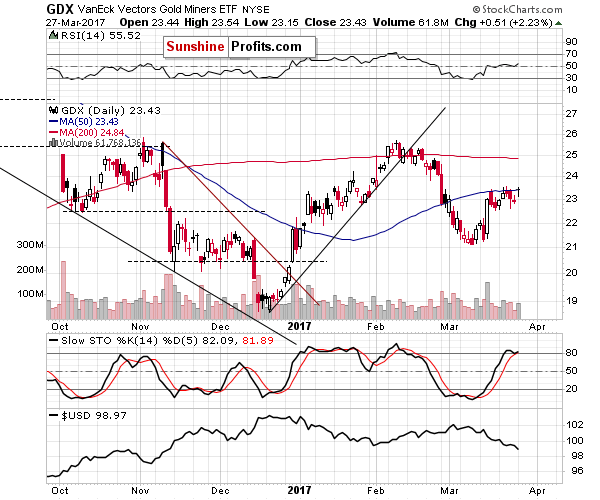
Mining stocks are not following gold higher. GDX closed at its 50-day moving average, unable to generate a visible rally even though gold and silver moved visibly higher. Miners simply moved to last week’s high – not above it. Moreover, please note that mining stocks are not even close to their February highs, which proves that their underperformance is not only a one-day event.
Summing up, the move to the February high in gold might highlight this rally’s end just as the USD’s temporary breakdown below 99 and its invalidation could mark the end of the decline in the U.S. dollar. The long-term analogy to 2002 and 2003 in the USD Index remains in place and the outlook for the following weeks remains bearish for the precious metals market.
Moving back to the title of today’s alert, please note that we have a strong bullish case for the USD in the short term, gold reaching strong resistance levels and its underperformance relative to the signals from the USD Index, silver’s visible short-term outperformance and general underperformance of the mining stocks sector (both short-term and medium-term). The buy signal from the RSI indicator and sell signal from Stochastic in gold supplement the already-bearish picture. Still, it is not the multitude of short-term signals that’s most important – it is the likelihood that the decline in the USD Index is very likely over and that a very powerful move higher is likely.
As always, we will keep you – our subscribers – informed.
To summarize:
Trading capital (supplementary part of the portfolio; our opinion): Short positions (150% of the full position) in gold, silver and mining stocks are justified from the risk/reward perspective with the following stop-loss orders and initial target price levels / profit-take orders:
- Gold: exit-profit-take level: $1,063; stop-loss: $1,273; initial target price for the DGLD ETN: $81.88; stop-loss for the DGLD ETN $48.17
- Silver: initial target price: $13.12; stop-loss: $18.67; initial target price for the DSLV ETN: $46.18; stop-loss for the DSLV ETN $19.87
- Mining stocks (price levels for the GDX ETF): initial target price: $9.34; stop-loss: $26.34; initial target price for the DUST ETF: $143.56; stop-loss for the DUST ETF $21.37
In case one wants to bet on junior mining stocks' prices (we do not suggest doing so – we think senior mining stocks are more predictable in the case of short-term trades – if one wants to do it anyway, we provide the details), here are the stop-loss details and initial target prices:
- GDXJ ETF: initial target price: $14.13; stop-loss: $45.31
- JDST ETF: initial target price: $104.26; stop-loss: $10.78
Long-term capital (core part of the portfolio; our opinion): No positions (in other words: cash)
Insurance capital (core part of the portfolio; our opinion): Full position
Please note that the in the trading section we describe the situation for the day that the alert is posted. In other words, it we are writing about a speculative position, it means that it is up-to-date on the day it was posted. We are also featuring the initial target prices, so that you can decide whether keeping a position on a given day is something that is in tune with your approach (some moves are too small for medium-term traders and some might appear too big for day-traders).
Plus, you might want to read why our stop-loss orders are usually relatively far from the current price.
Please note that a full position doesn’t mean using all of the capital for a given trade. You will find details on our thoughts on gold portfolio structuring in the Key Insights section on our website.
As a reminder – “initial target price” means exactly that – an “initial” one, it’s not a price level at which we suggest closing positions. If this becomes the case (like it did in the previous trade) we will refer to these levels as levels of exit orders (exactly as we’ve done previously). Stop-loss levels, however, are naturally not “initial”, but something that, in our opinion, might be entered as an order.
Since it is impossible to synchronize target prices and stop-loss levels for all the ETFs and ETNs with the main markets that we provide these levels for (gold, silver and mining stocks – the GDX ETF), the stop-loss levels and target prices for other ETNs and ETF (among other: UGLD, DGLD, USLV, DSLV, NUGT, DUST, JNUG, JDST) are provided as supplementary, and not as “final”. This means that if a stop-loss or a target level is reached for any of the “additional instruments” (DGLD for instance), but not for the “main instrument” (gold in this case), we will view positions in both gold and DGLD as still open and the stop-loss for DGLD would have to be moved lower. On the other hand, if gold moves to a stop-loss level but DGLD doesn’t, then we will view both positions (in gold and DGLD) as closed. In other words, since it’s not possible to be 100% certain that each related instrument moves to a given level when the underlying instrument does, we can’t provide levels that would be binding. The levels that we do provide are our best estimate of the levels that will correspond to the levels in the underlying assets, but it will be the underlying assets that one will need to focus on regarding the signs pointing to closing a given position or keeping it open. We might adjust the levels in the “additional instruments” without adjusting the levels in the “main instruments”, which will simply mean that we have improved our estimation of these levels, not that we changed our outlook on the markets. We are already working on a tool that would update these levels on a daily basis for the most popular ETFs, ETNs and individual mining stocks.
Our preferred ways to invest in and to trade gold along with the reasoning can be found in the how to buy gold section. Additionally, our preferred ETFs and ETNs can be found in our Gold & Silver ETF Ranking.
As always, we'll keep you - our subscribers - updated should our views on the market change. We will continue to send out Gold & Silver Trading Alerts on each trading day and we will send additional Alerts whenever appropriate.
The trading position presented above is the netted version of positions based on subjective signals (opinion) from your Editor, and the Tools and Indicators.
As a reminder, Gold & Silver Trading Alerts are posted before or on each trading day (we usually post them before the opening bell, but we don't promise doing that each day). If there's anything urgent, we will send you an additional small alert before posting the main one.
=====
Latest Free Trading Alerts:
Trump’s efforts to repeal and replace the Affordable Care Act failed on Friday. What does it mean for the gold market?
=====
Hand-picked precious-metals-related links:
PRECIOUS-Gold steady, investors focus on Trump agenda
Goldcorp, Barrick, team up on Chile gold mine projects
=====
In other news:
GLOBAL MARKETS-Stocks recover, dollar off lows as markets move past Trump's policy stumble
Fed speakers halt dollar slide with talk of rate rises
Poll shows Macron win in French election in shadow of 'Penelopegate'
=====
Thank you.
Sincerely,
Przemyslaw Radomski, CFA
Founder, Editor-in-chief, Gold & Silver Fund Manager
Gold & Silver Trading Alerts
Forex Trading Alerts
Oil Investment Updates
Oil Trading Alerts

