

Briefly: In our opinion, full (150% of the regular full position) speculative short positions in gold, silver and mining stocks are justified from the risk/reward perspective. This position was originally featured on Jan. 12, 2017 at 3:49PM.
At the first sight, it may seem that last week was volatile in the case of gold – however, that is true only from the very short-term point of view. Taking a broader picture into consideration allows us to see that gold continues to move back and forth within a broader trading range without a meaningful move in either direction – effectively decreasing gold’s volatility. What are the implications?
Let’s take a closer look at the charts for details (charts courtesy of http://stockcharts.com).
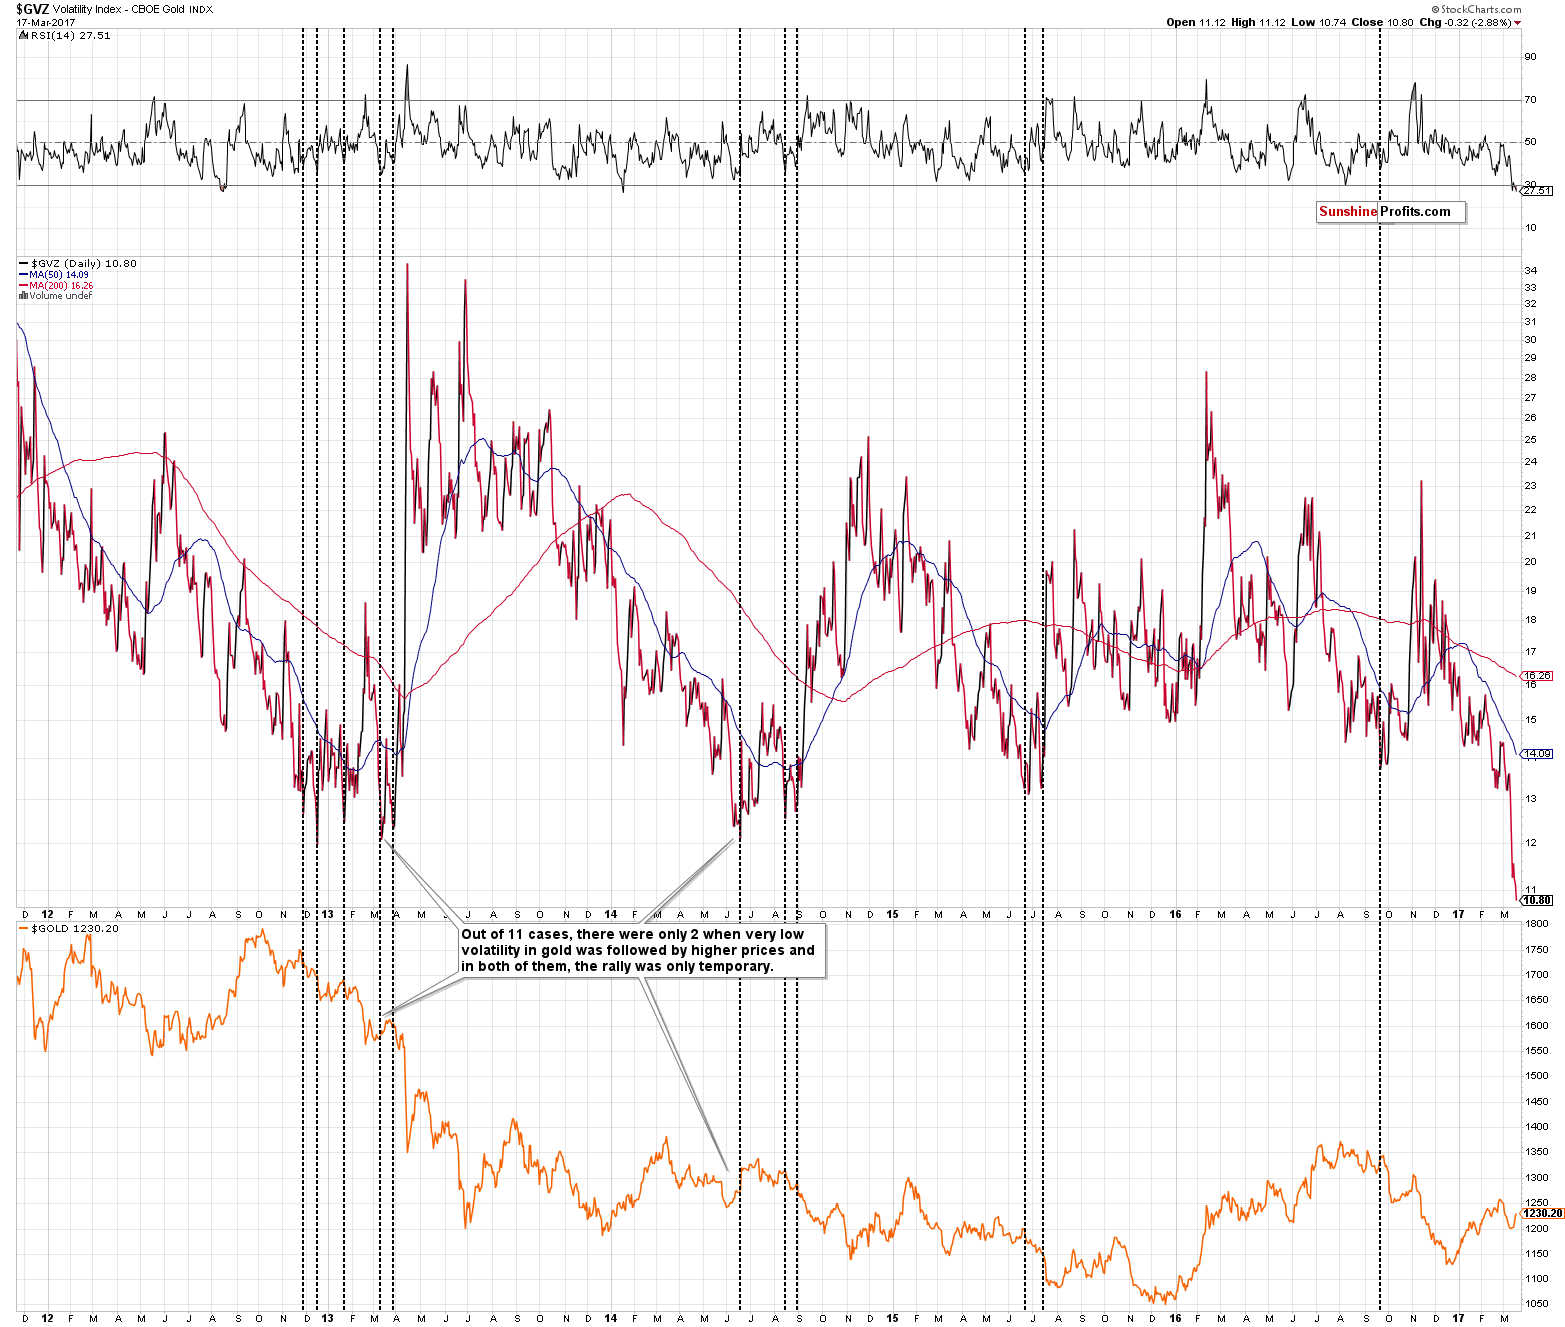
About a month ago we commented on gold’s volatility in the following way:
In the past years, very low readings of the gold volatility index were usually followed by lower gold prices. The key thing is what we mean by “usually” here – gold moved lower in the weeks following extremely low volatility readings in 10 out of 11 cases and 9 cases thereof were followed by immediate declines. Naturally, the implications are bearish.
Naturally, one could say that gold declined on average during the past 5 years which makes it normal for gold to decline on average after any random signal, but still, the 9 out of 11 or 10 out of 11 (depending on how one treats the March 2013 spike) efficiency shows that it is unlikely that the signal was random. In other words, 6 or 7 out of 11 signals could have raised an eyebrow, but it would be nothing to call home about, but 9 or 10 out of 11 is too many to be explained by just randomness.
Let’s move back to the bearish implications – they are present, but it’s also true that the volatility index could move even lower and therefore the top might not be here , but is just around the corner. What’s special about it? That it’s not just a usual indicator, but volatility. If it continues to decline, it means that gold is likely to move even less significantly higher than it did recently. Consequently, delaying the slide – IF it is delayed at all - is likely to be accompanied by a small upswing – not a huge one.
Gold’s volatility just reached a new low and this breakdown (and the size thereof) makes the previous bearish signal even more bearish.
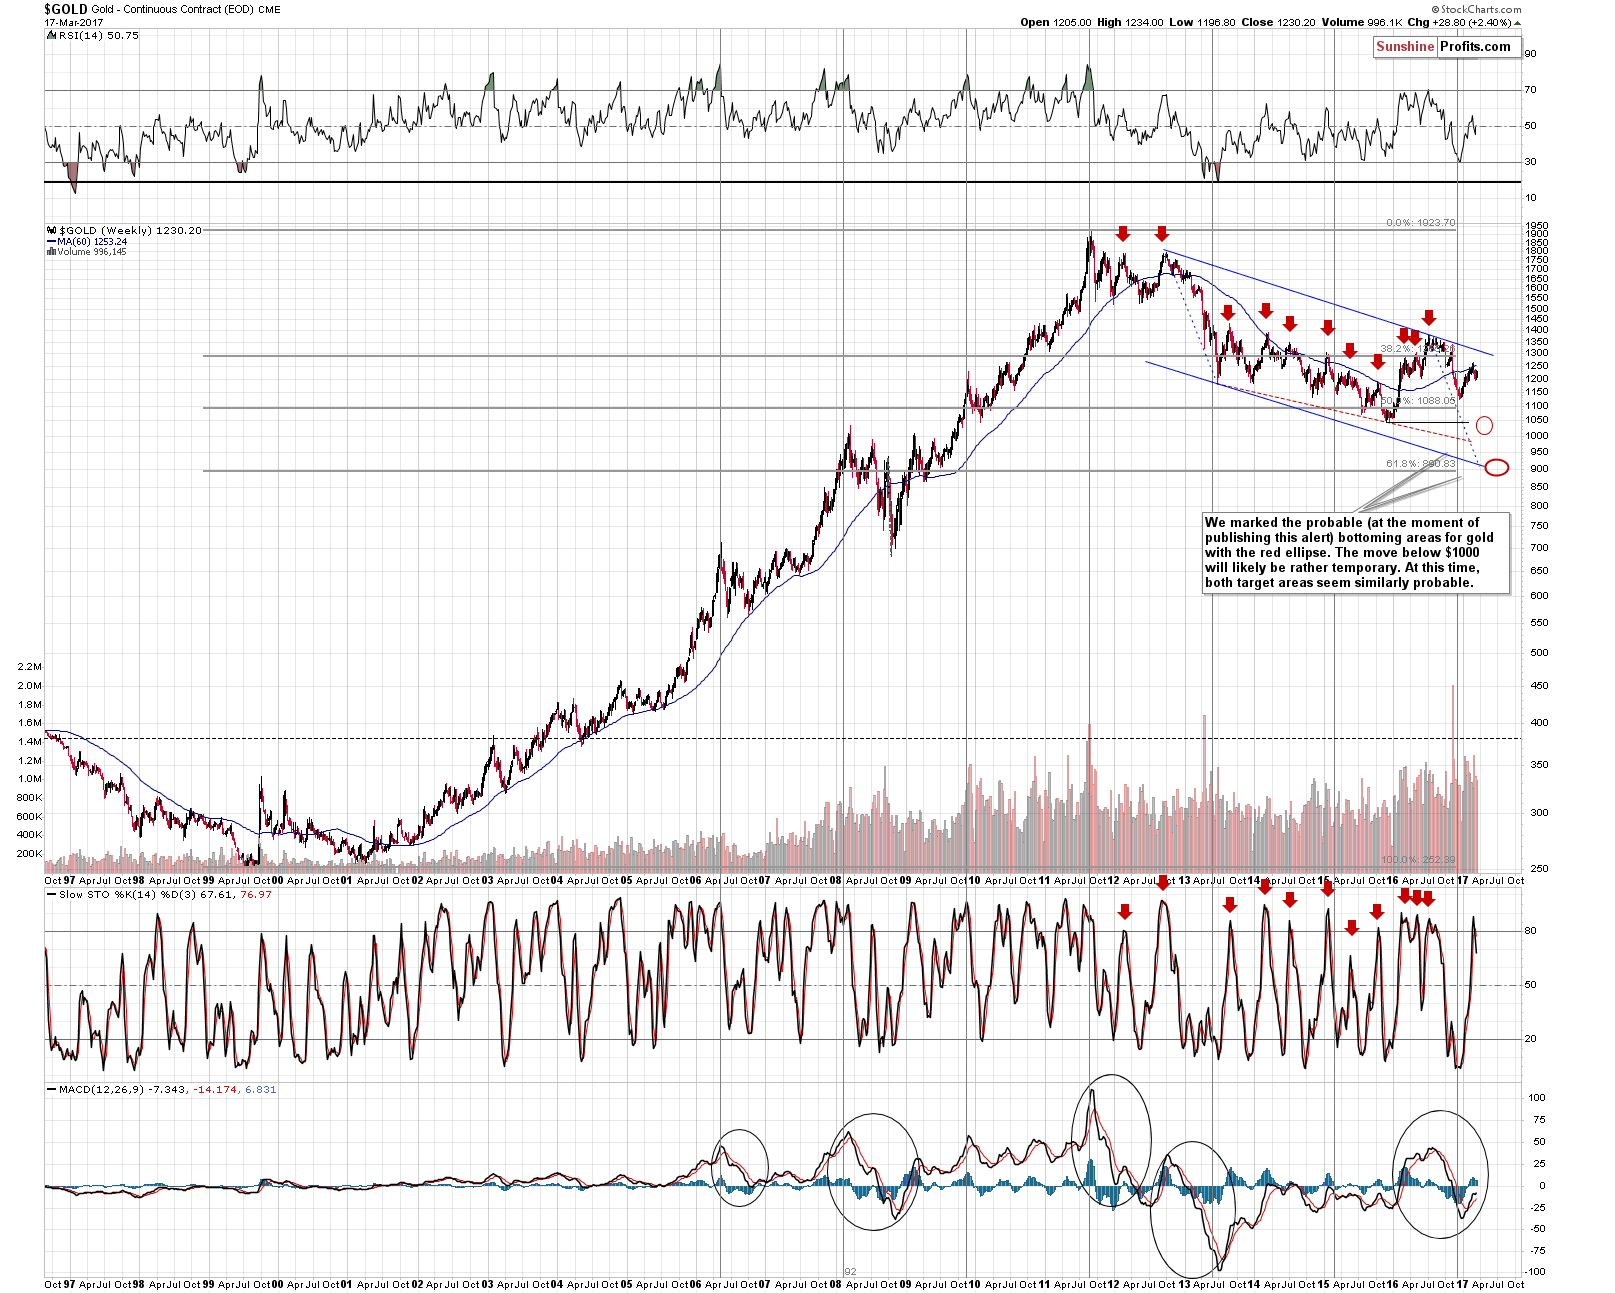
On a weekly basis we see that gold indeed rallied last week, but the move was not very significant – it didn’t change the position of the Stochastic indicator, which had flashed a major sell signal. Consequently, this signal was not invalidated and the bearish implications remain in place.
As far as price itself is concerned, gold remains below the 60-week moving average and overall not much changed from the technical point of view in case of the long-term perspective.
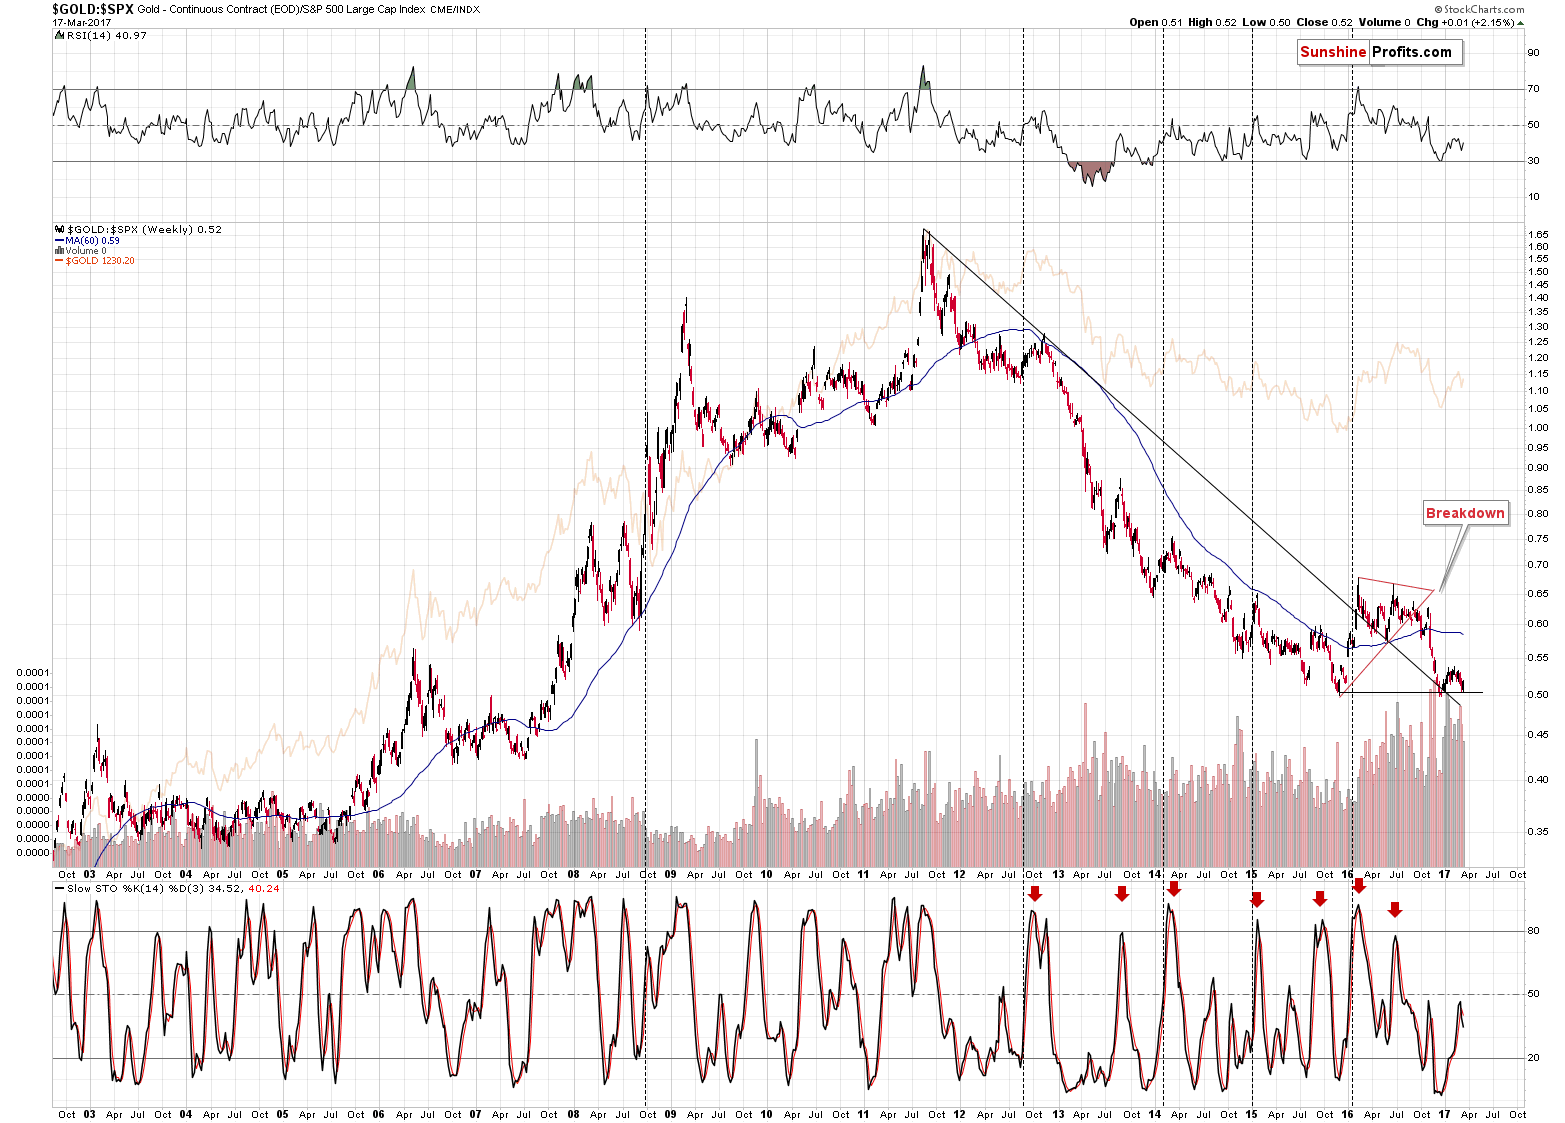
Moreover, let us emphasize that gold is already on a verge of a breakdown even though it is not so clear, as can be seen on the previous chart. In terms of gold’s performance relative to the stock market, gold is right at its 2015 and 2016 lows. Any additional weakness will mean a major breakdown and likely a powerful downswing as there is no significant support level below the current levels.
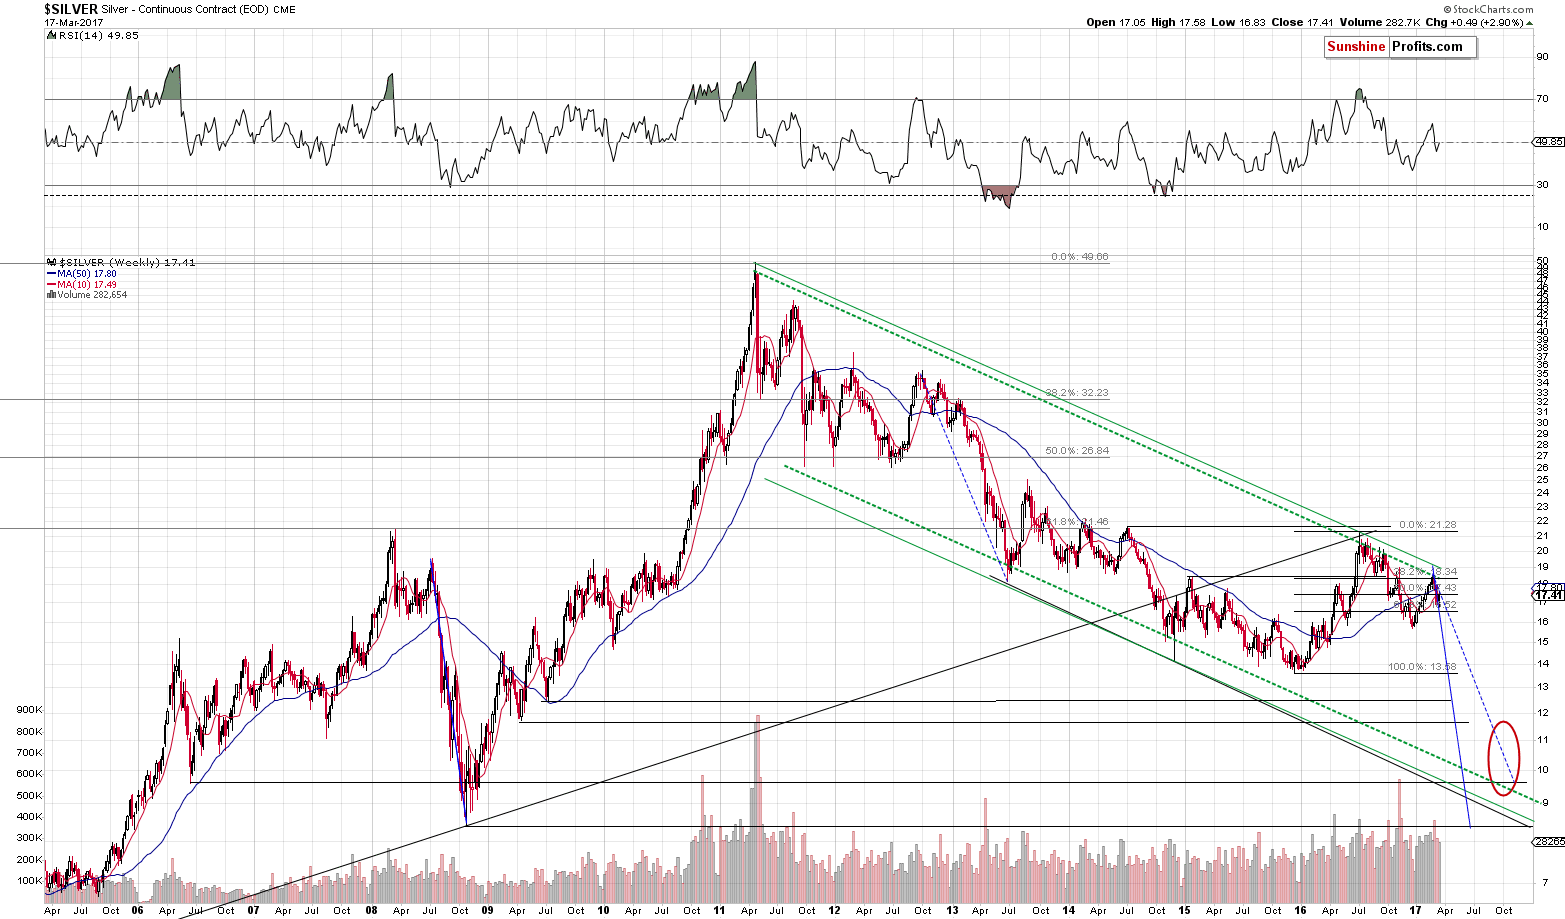
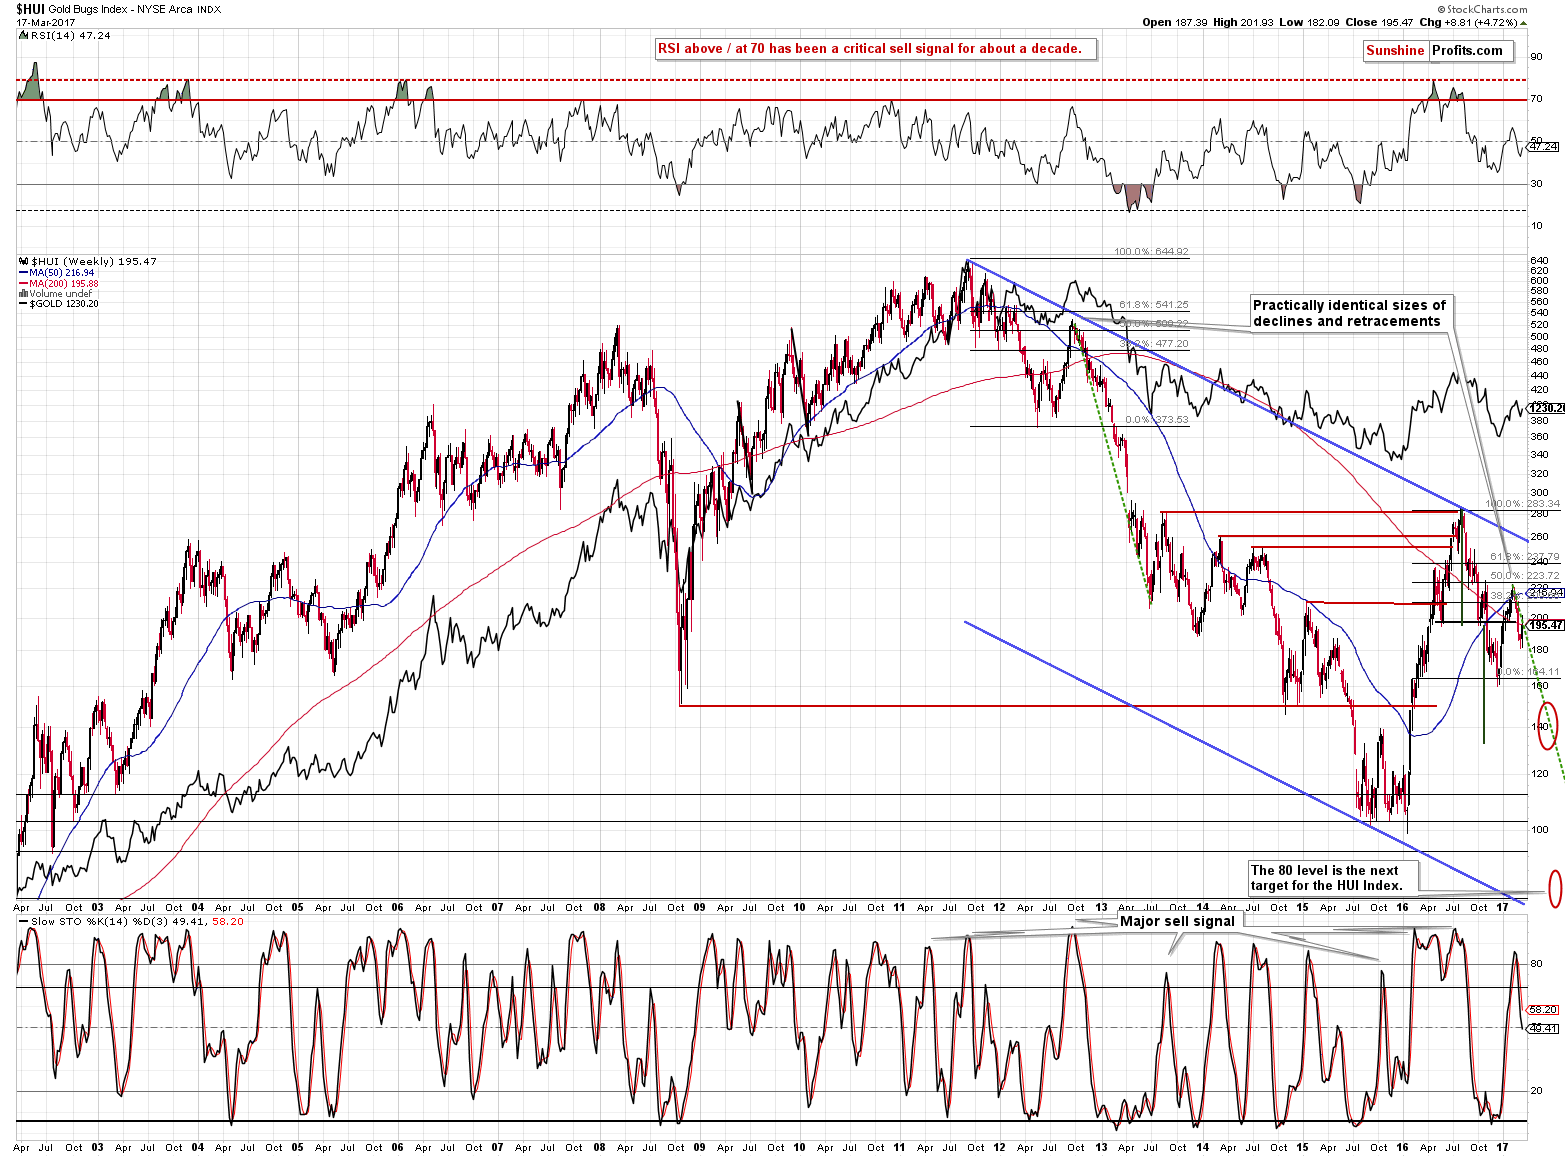
In the previous alerts we wrote that the decline in mining stocks was in tune with the previous decline and thus the corrective upswing should not be surprising. We also wrote that generally the same was the case for silver - the white metal’s decline remained in tune with both major declines of the past decade: the 2008 slide and the 2012-2013 slide.
Today, we would like to add that – just like what we see in the case of gold – the major sell signal from the weekly version of the Stochastic indicator remains in place. This tells us that last week’s developments really changed little – the decline remains in tune with the previous key declines and the long-term sell signals remain in place.
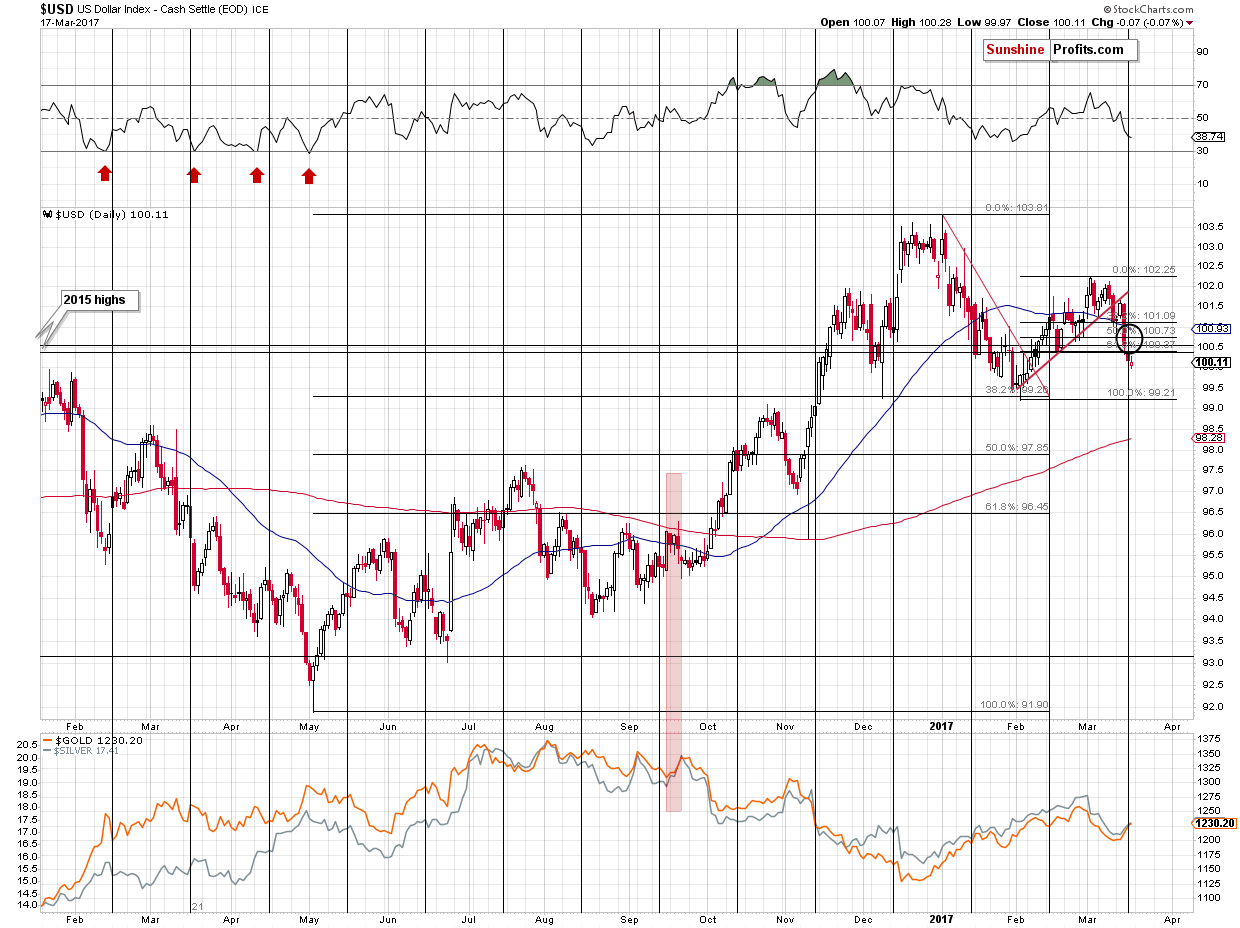
As far as the USD Index is concerned, our Friday’s comments remain up-to-date:
Even though the above may give the impression that the outlook for the USD Index is bearish, it is actually the other way around. Yes, the USD Index declined, but just because something moved in a given way, it doesn’t mean that this move’s continuation is likely. The cyclical turning point in the USD Index and the long-term chart make it clear that this decline is something that actually has bullish implications as it makes the following (likely epic) rally even more probable. We discussed details in yesterday’s alert, so in today’s alert we’ll focus on yesterday’s and today’s changes.
The USD Index declined below the support levels, but only one close below them doesn’t mean that the breakdown is verified. Conversely, since the breakdown took place right at the turning point, it’s rather likely that it will be invalidated.
The interesting – and bearish for PMs – thing is that even though USD declined yesterday, only gold moved a little higher. Silver and mining stocks didn’t. The size of yesterday’s price moves suggests that an additional decline in the USD Index (even if it declines to the February low at about 99.2, it would still not invalidate the medium-term bullish outlook) may not translate into much higher precious metals prices.
Summing up, last week’s price developments changed much less than it appears at the first sight – the long-term sell signals remain in place and the extremely low volatility reading in gold has profound bearish implications for the following weeks.
As always, we will keep you – our subscribers – informed.
To summarize:
Trading capital (supplementary part of the portfolio; our opinion): Short positions (150% of the full position) in gold, silver and mining stocks are justified from the risk/reward perspective with the following stop-loss orders and initial target price levels / profit-take orders:
- Gold: exit-profit-take level: $1,063; stop-loss: $1,273; initial target price for the DGLD ETN: $81.88; stop-loss for the DGLD ETN $48.17
- Silver: initial target price: $13.12; stop-loss: $18.67; initial target price for the DSLV ETN: $46.18; stop-loss for the DSLV ETN $19.87
- Mining stocks (price levels for the GDX ETF): initial target price: $9.34; stop-loss: $26.34; initial target price for the DUST ETF: $143.56; stop-loss for the DUST ETF $21.37
In case one wants to bet on junior mining stocks' prices (we do not suggest doing so – we think senior mining stocks are more predictable in the case of short-term trades – if one wants to do it anyway, we provide the details), here are the stop-loss details and initial target prices:
- GDXJ ETF: initial target price: $14.13; stop-loss: $45.31
- JDST ETF: initial target price: $104.26; stop-loss: $10.78
Long-term capital (core part of the portfolio; our opinion): No positions (in other words: cash)
Insurance capital (core part of the portfolio; our opinion): Full position
Please note that the in the trading section we describe the situation for the day that the alert is posted. In other words, it we are writing about a speculative position, it means that it is up-to-date on the day it was posted. We are also featuring the initial target prices, so that you can decide whether keeping a position on a given day is something that is in tune with your approach (some moves are too small for medium-term traders and some might appear too big for day-traders).
Plus, you might want to read why our stop-loss orders are usually relatively far from the current price.
Please note that a full position doesn’t mean using all of the capital for a given trade. You will find details on our thoughts on gold portfolio structuring in the Key Insights section on our website.
As a reminder – “initial target price” means exactly that – an “initial” one, it’s not a price level at which we suggest closing positions. If this becomes the case (like it did in the previous trade) we will refer to these levels as levels of exit orders (exactly as we’ve done previously). Stop-loss levels, however, are naturally not “initial”, but something that, in our opinion, might be entered as an order.
Since it is impossible to synchronize target prices and stop-loss levels for all the ETFs and ETNs with the main markets that we provide these levels for (gold, silver and mining stocks – the GDX ETF), the stop-loss levels and target prices for other ETNs and ETF (among other: UGLD, DGLD, USLV, DSLV, NUGT, DUST, JNUG, JDST) are provided as supplementary, and not as “final”. This means that if a stop-loss or a target level is reached for any of the “additional instruments” (DGLD for instance), but not for the “main instrument” (gold in this case), we will view positions in both gold and DGLD as still open and the stop-loss for DGLD would have to be moved lower. On the other hand, if gold moves to a stop-loss level but DGLD doesn’t, then we will view both positions (in gold and DGLD) as closed. In other words, since it’s not possible to be 100% certain that each related instrument moves to a given level when the underlying instrument does, we can’t provide levels that would be binding. The levels that we do provide are our best estimate of the levels that will correspond to the levels in the underlying assets, but it will be the underlying assets that one will need to focus on regarding the signs pointing to closing a given position or keeping it open. We might adjust the levels in the “additional instruments” without adjusting the levels in the “main instruments”, which will simply mean that we have improved our estimation of these levels, not that we changed our outlook on the markets. We are already working on a tool that would update these levels on a daily basis for the most popular ETFs, ETNs and individual mining stocks.
Our preferred ways to invest in and to trade gold along with the reasoning can be found in the how to buy gold section. Additionally, our preferred ETFs and ETNs can be found in our Gold & Silver ETF Ranking.
As always, we'll keep you - our subscribers - updated should our views on the market change. We will continue to send out Gold & Silver Trading Alerts on each trading day and we will send additional Alerts whenever appropriate.
The trading position presented above is the netted version of positions based on subjective signals (opinion) from your Editor, and the Tools and Indicators.
As a reminder, Gold & Silver Trading Alerts are posted before or on each trading day (we usually post them before the opening bell, but we don't promise doing that each day). If there's anything urgent, we will send you an additional small alert before posting the main one.
=====
Latest Free Trading Alerts:
The latest FOMC meeting was accompanied by Janet Yellen’s press conference. Let’s analyze the implications of her remarks for the gold market.
Yellen’s March Press Conference and Gold
S&P 500 index lost 0.1% on Friday, as investors continued to hesitate following last Wednesday's Fed's interest rate increase. Will medium-term uptrend continue after three-week-long consolidation? Is holding short position still justified?
Stock Trading Alert: Uncertainty Following Interest Rate Increase - Will Uptrend Continue?
=====
Hand-picked precious-metals-related links:
Gold Speculators Sharply Cut Bullish Net Positions For 2nd Week
Silver Wheaton's profile boosted by progress at Antamina Mine
=====
In other news:
U.K. to Trigger Brexit March 29, Starting Two Years of Talks
Yellen's exit may prompt the Fed to pare its balance sheet sooner rather than later, Goldman says
Market Recon: The G20 Meeting Was a Success for the U.S.
=====
Thank you.
Sincerely,
Przemyslaw Radomski, CFA
Founder, Editor-in-chief, Gold & Silver Fund Manager
Gold & Silver Trading Alerts
Forex Trading Alerts
Oil Investment Updates
Oil Trading Alerts

