

Briefly: In our opinion, full (150% of the regular full position) speculative short positions in gold, silver and mining stocks are justified from the risk/reward perspective. This position was originally featured on Jan. 12, 2017 at 3:49PM.
Yesterday’s session was quite specific in terms of signals. At the beginning of the session and in its early hours, it appeared that the precious metals sector was breaking higher, but things appeared to change later on as miners erased the entire daily upswing. What are the final implications?
The key implication is that gold’s and silver’s upswing should not be trusted, even in light of today’s move higher. Let’s take a closer look at the charts (charts courtesy of http://stockcharts.com).
In yesterday’s alert, we wrote the following:
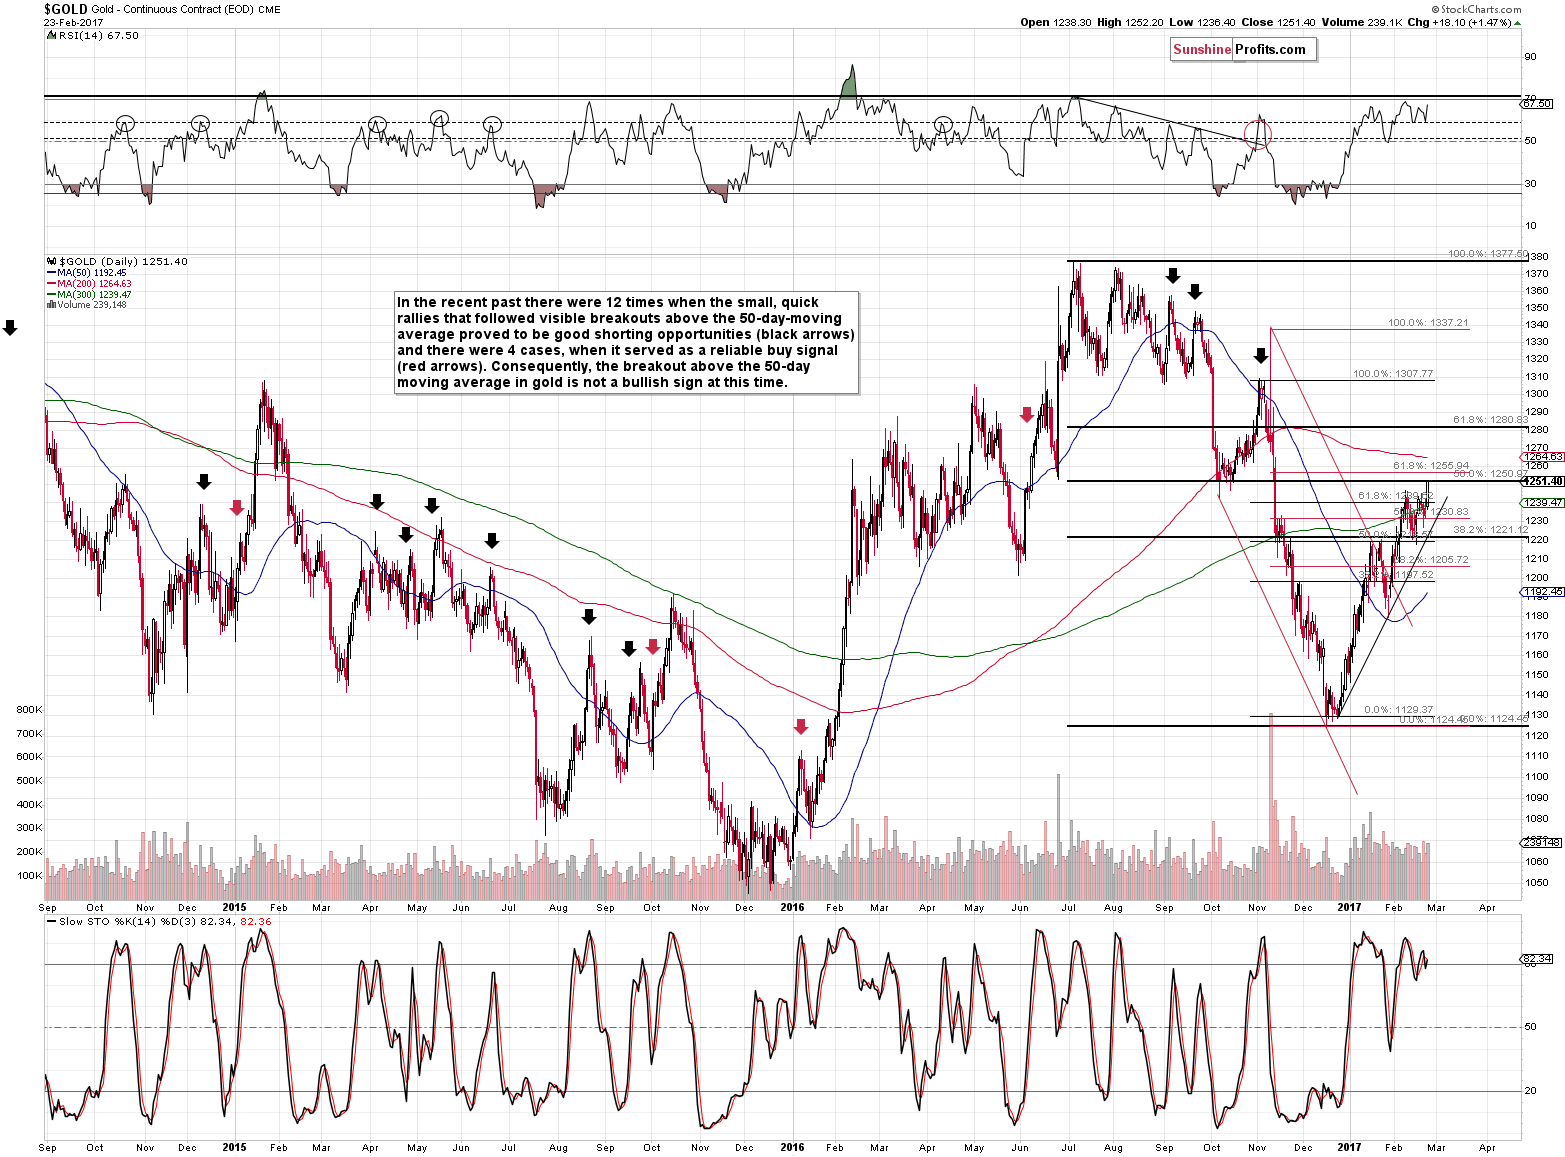
We were recently (after posting the analysis of gold’s volatility, in which we wrote that even if gold moved higher, it was not likely to move significantly higher due to the levels of volatility and the analogy to similar situations) asked how high gold – specifically – can move. Our best estimate for a daily closing price (again IF gold moves above the February highs at all) is the 50% Fibonacci retracement based on the 2016 high and the December 2016 low. It’s at approximately $1,251. This resistance is strengthened by the October 2016 lows, which makes it more important than other nearby retracements. Gold is also relatively close to its 200-day moving average, but it doesn’t seem that this moving average is of particular significance as it wasn’t really effective as support or resistance in the past few years (the 60-week moving average appears to be much more useful).
Gold closed practically at the mentioned 50% Fibonacci retracement level and thus there was no breakout. Gold moved higher in today’s pre-market trading, but it was just pre-market trading – it’s far (in terms of importance) from a daily closing price or weekly closing price. There are no bullish implications of the pre-market move, especially that gold reversed and erased almost the entire pre-market rally in today’s early trading.
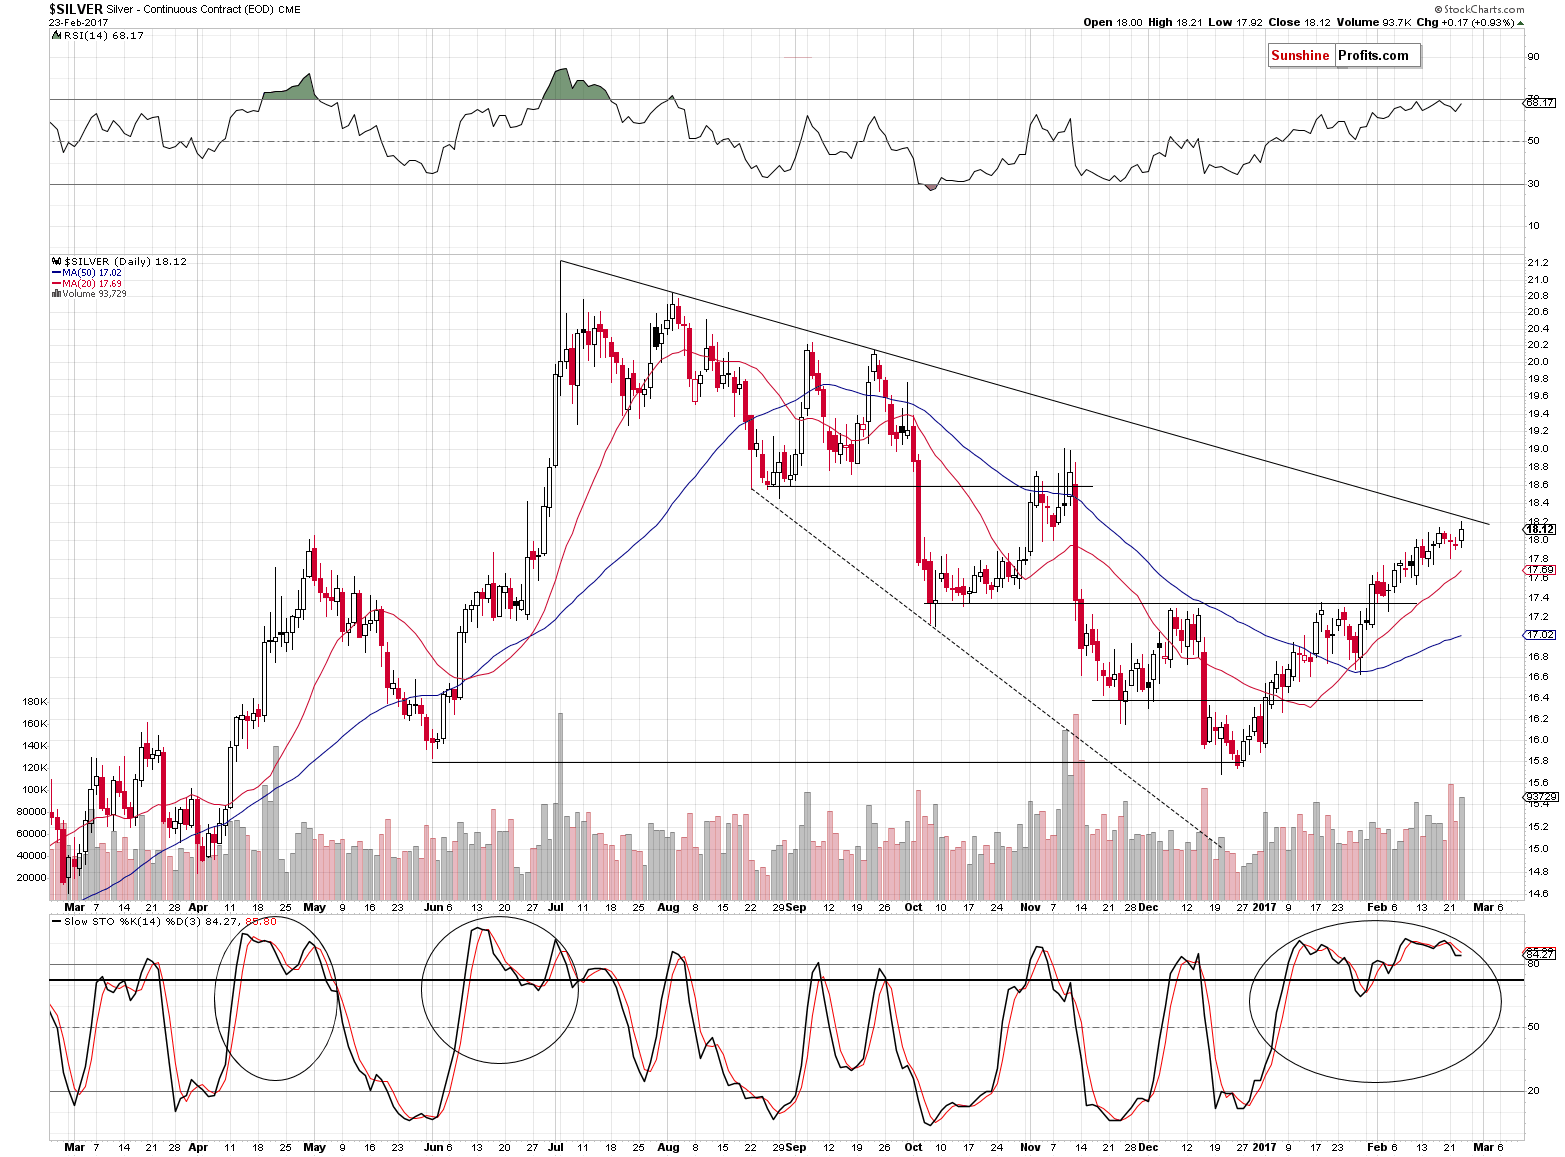
Silver moved higher as well and based on today’s pre-market move higher it reached the declining medium-term resistance line – the price level that was not likely to be reached based on what had happened in the previous weeks, but one that is still very likely to stop the rally (silver reversed close to today’s opening bell, just like gold did).
As far as indicators are concerned, please note that the RSI is once again approaching the 70 level (it was just below it based on yesterday’s session and is very likely at or slightly above 70 based on today’s upswing), which is a bearish sign. In case of the Stochastic indicator, we recently saw a second local high and yet another sell signal. Overall the situation is similar to what we saw in case of both major tops in silver in the past year.
The most important thing, though, is not what we saw in gold nor silver – it’s what we saw in the mining stocks.
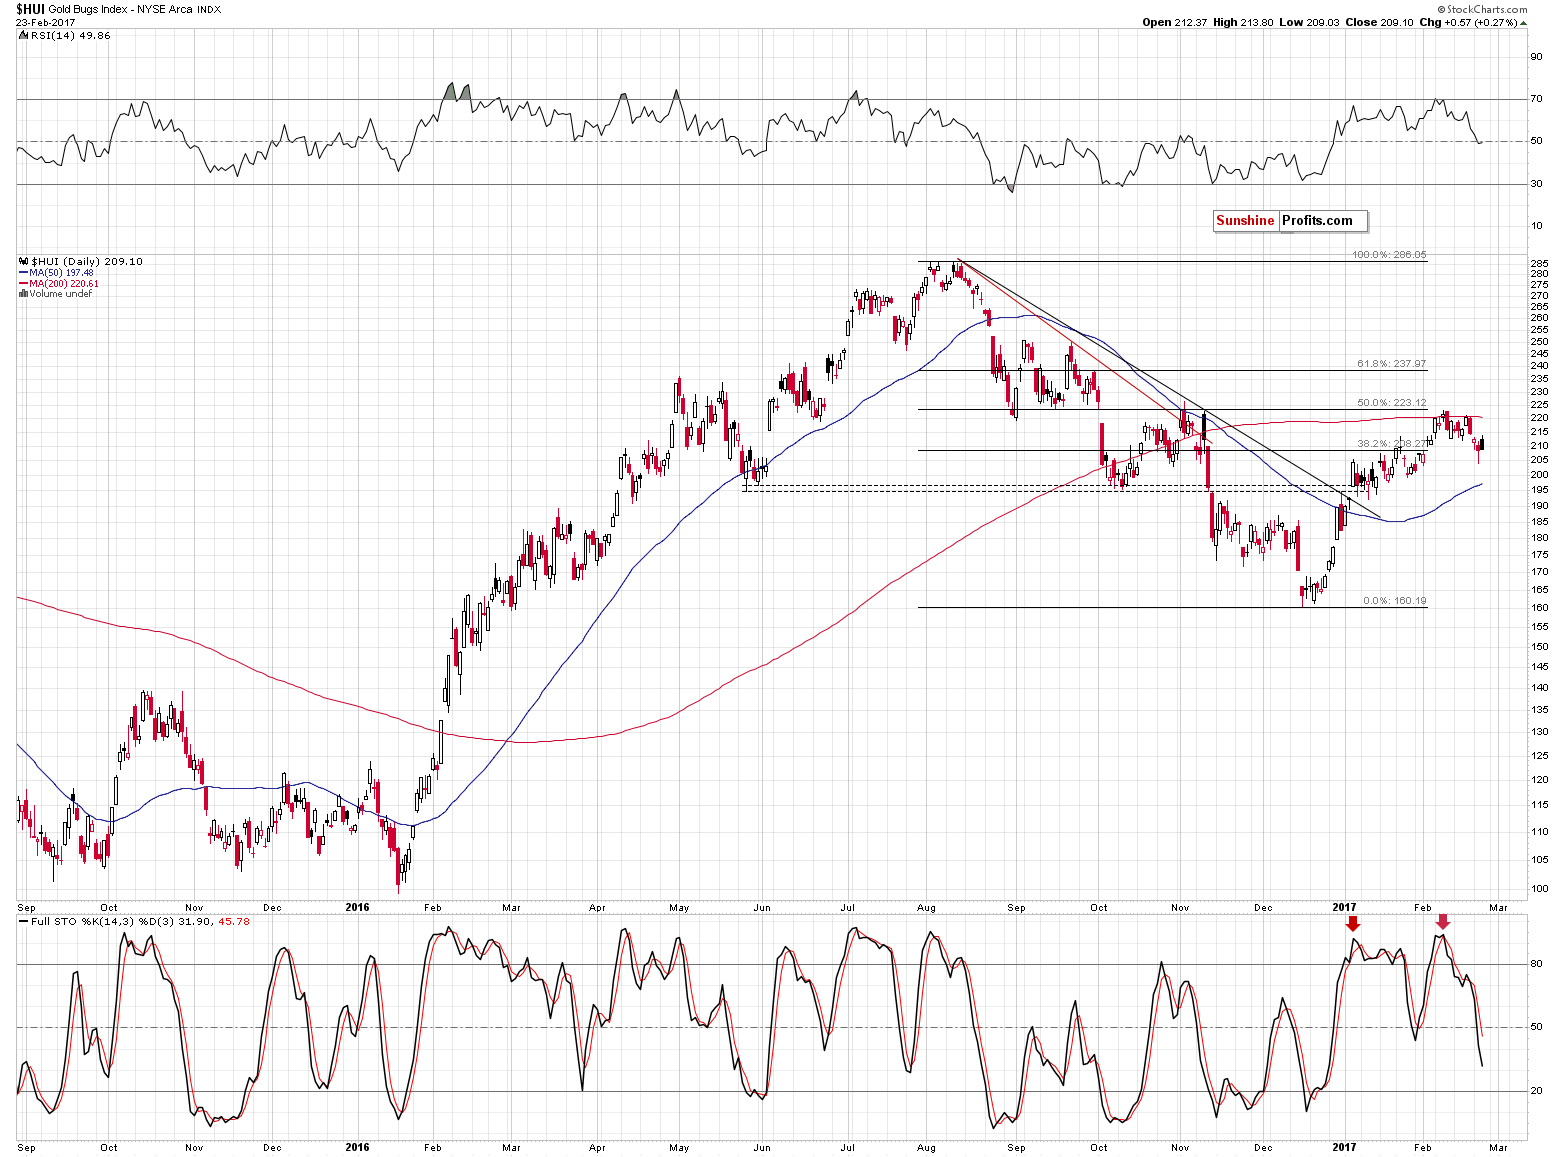
Gold stocks erased almost the entire daily gain before the session was over. In yesterday’s alert we wrote the following:
Gold moved a bit higher but mining stocks declined. The moves were not huge, but the fact that miners were able to decline over 1% even though gold closed the session a bit higher is quite meaningful. Well, it wouldn’t be that meaningful if it had been just a single day of miners’ underperformance – but it wasn’t. Mining stocks have been underperforming gold for several days and this has been the case despite the rallying general stock market. Mining stocks had very good reasons to soar and instead they declined. This underperformance and – in particular – its persistence is a bearish indication.
We saw yet another – profound – confirmation of the miners’ underperformance and it serves as yet another bearish confirmation. This time it was even clearer than in the previous days. Even without looking at USD’s long-term chart, the relationship between gold and “uncertainty”, “volatility” and other major sell signals, the mining stocks’ underperformance is a very strong reason (alone) to say that short positions – not long ones - are currently justified from the risk to reward point of view.
Summing up, the bearish outlook for the precious metals sector remains in place. While the daily price changes are not particularly meaningful (except the miners’ underperformance – its implications are meaningful and bearish), the long- and medium-term signals that are very important (being highly effective in the past) continue to paint a very bearish picture for the precious metals sector for the upcoming weeks and months.
Due to gold’s pre-market upswing and yet another bearish sign (miners’ underperformance) we are moving the stop-loss level for gold a bit higher.
As always, we will keep you – our subscribers – informed.
To summarize:
Trading capital (supplementary part of the portfolio; our opinion): Short positions (150% of the full position) in gold, silver and mining stocks are justified from the risk/reward perspective with the following stop-loss orders and initial target price levels / profit-take orders:
- Gold: exit-profit-take level: $1,063; stop-loss: $1,273; initial target price for the DGLD ETN: $81.88; stop-loss for the DGLD ETN $48.17
- Silver: initial target price: $13.12; stop-loss: $18.67; initial target price for the DSLV ETN: $46.18; stop-loss for the DSLV ETN $19.87
- Mining stocks (price levels for the GDX ETF): initial target price: $9.34; stop-loss: $26.34; initial target price for the DUST ETF: $143.56; stop-loss for the DUST ETF $21.37
In case one wants to bet on junior mining stocks' prices (we do not suggest doing so – we think senior mining stocks are more predictable in the case of short-term trades – if one wants to do it anyway, we provide the details), here are the stop-loss details and initial target prices:
- GDXJ ETF: initial target price: $14.13; stop-loss: $45.31
- JDST ETF: initial target price: $104.26; stop-loss: $10.78
Long-term capital (core part of the portfolio; our opinion): No positions (in other words: cash)
Insurance capital (core part of the portfolio; our opinion): Full position
Please note that the in the trading section we describe the situation for the day that the alert is posted. In other words, it we are writing about a speculative position, it means that it is up-to-date on the day it was posted. We are also featuring the initial target prices, so that you can decide whether keeping a position on a given day is something that is in tune with your approach (some moves are too small for medium-term traders and some might appear too big for day-traders).
Plus, you might want to read why our stop-loss orders are usually relatively far from the current price.
Please note that a full position doesn’t mean using all of the capital for a given trade. You will find details on our thoughts on gold portfolio structuring in the Key Insights section on our website.
As a reminder – “initial target price” means exactly that – an “initial” one, it’s not a price level at which we suggest closing positions. If this becomes the case (like it did in the previous trade) we will refer to these levels as levels of exit orders (exactly as we’ve done previously). Stop-loss levels, however, are naturally not “initial”, but something that, in our opinion, might be entered as an order.
Since it is impossible to synchronize target prices and stop-loss levels for all the ETFs and ETNs with the main markets that we provide these levels for (gold, silver and mining stocks – the GDX ETF), the stop-loss levels and target prices for other ETNs and ETF (among other: UGLD, DGLD, USLV, DSLV, NUGT, DUST, JNUG, JDST) are provided as supplementary, and not as “final”. This means that if a stop-loss or a target level is reached for any of the “additional instruments” (DGLD for instance), but not for the “main instrument” (gold in this case), we will view positions in both gold and DGLD as still open and the stop-loss for DGLD would have to be moved lower. On the other hand, if gold moves to a stop-loss level but DGLD doesn’t, then we will view both positions (in gold and DGLD) as closed. In other words, since it’s not possible to be 100% certain that each related instrument moves to a given level when the underlying instrument does, we can’t provide levels that would be binding. The levels that we do provide are our best estimate of the levels that will correspond to the levels in the underlying assets, but it will be the underlying assets that one will need to focus on regarding the signs pointing to closing a given position or keeping it open. We might adjust the levels in the “additional instruments” without adjusting the levels in the “main instruments”, which will simply mean that we have improved our estimation of these levels, not that we changed our outlook on the markets. We are already working on a tool that would update these levels on a daily basis for the most popular ETFs, ETNs and individual mining stocks.
Our preferred ways to invest in and to trade gold along with the reasoning can be found in the how to buy gold section. Additionally, our preferred ETFs and ETNs can be found in our Gold & Silver ETF Ranking.
As always, we'll keep you - our subscribers - updated should our views on the market change. We will continue to send out Gold & Silver Trading Alerts on each trading day and we will send additional Alerts whenever appropriate.
The trading position presented above is the netted version of positions based on subjective signals (opinion) from your Editor, and the Tools and Indicators.
As a reminder, Gold & Silver Trading Alerts are posted before or on each trading day (we usually post them before the opening bell, but we don't promise doing that each day). If there's anything urgent, we will send you an additional small alert before posting the main one.
=====
Latest Free Trading Alerts:
Gold is showing impressive resilience to an unfavorable macroeconomic environment. Does it mean that investors are buying gold as a hedge against the risk of Trump’s impeachment?
Is Gold a Hedge against Trump’s Impeachment?
The narration of reflation and ‘Great Fiscal Rotation’ imply that the Fed will hike interest rates in a more aggressive way in a response to accelerated growth and higher inflation. We invite you to read our today’s article about the connections between the federal funds rate, real interest rates, U.S. dollar and gold, and find out what is the impact of higher interest rates for gold market.
Gold, Second Fed Hike and Interest Rates
=====
Hand-picked precious-metals-related links:
COLUMN-We need to talk about the London Metal Exchange: Andy Home
ROSS NORMAN - A Response to The LME Issue
World's deepest mine gets $1 billion injection
=====
In other news:
Dow pulls off a stunt it hasn't done in 30 years
Greek PM says bailout review to be concluded in March after 'honorable compromise'
Oil prices fall as U.S. crude inventories rise further
Best Returns Since 1900 Came From These Markets: Chart
=====
Thank you.
Sincerely,
Przemyslaw Radomski, CFA
Founder, Editor-in-chief, Gold & Silver Fund Manager
Gold & Silver Trading Alerts
Forex Trading Alerts
Oil Investment Updates
Oil Trading Alerts

