

Briefly: In our opinion, speculative short positions (full) in gold and silver are justified from the risk/reward point of view.
The precious metals market moved higher yesterday and basically the comments that we made in yesterday’s second alert remain mostly up-to-date.
As a quick reminder, we wrote the following:
Gold and silver are a bit higher, but still below the resistance lines (gold remains within the declining trend channel) and levels (May 2015 high in case of silver) so nothing changed. The USD Index didn’t break below the previous lows, so nothing changed on this market either. Mining stocks moved higher and our position in them was automatically closed - we intentionally placed the stop-loss order relatively close, so that we are taken out of the market in case of a move above the 2015 high. Still, it seems unlikely that miners’ rally will continue for much longer. We expect to see an invalidation of this small breakout and once we see it, we will most likely re-enter the short position in mining stocks, but we are not automatically doing so at this time.
We haven’t seen the above-mentioned invalidation of the move higher in mining stocks yet and we haven’t seen breakouts in gold or silver yet either. The only thing that changed is the situation in the USD Index, which closed lower.
Let’s start with the latter (charts courtesy of http://stockcharts.com).
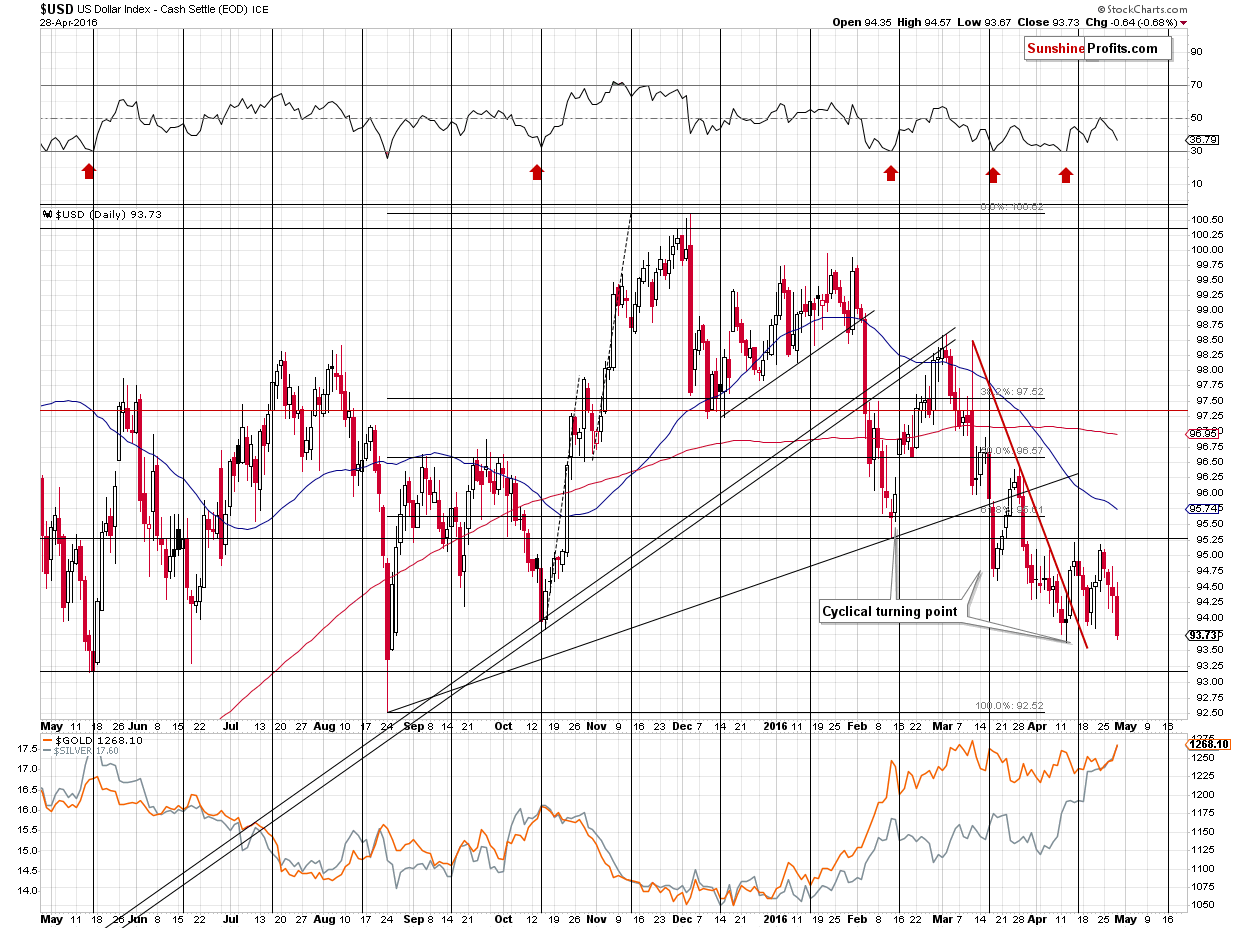
On the short-term chart you can see a new daily close and we see that USD moved even lower in today’s pre-market trading. On the short-term chart we can see support levels in the form of May 2015 and August 2015 lows. As far as the latter is concerned, if we take the closing prices into account, this support was already reached. The most important thing about the short-term perspective is that the current value of the USD Index is quite close to the support levels – one was just reached and the next one (May 2015 low) is very close. The August low of about 92.5 is not very far either.
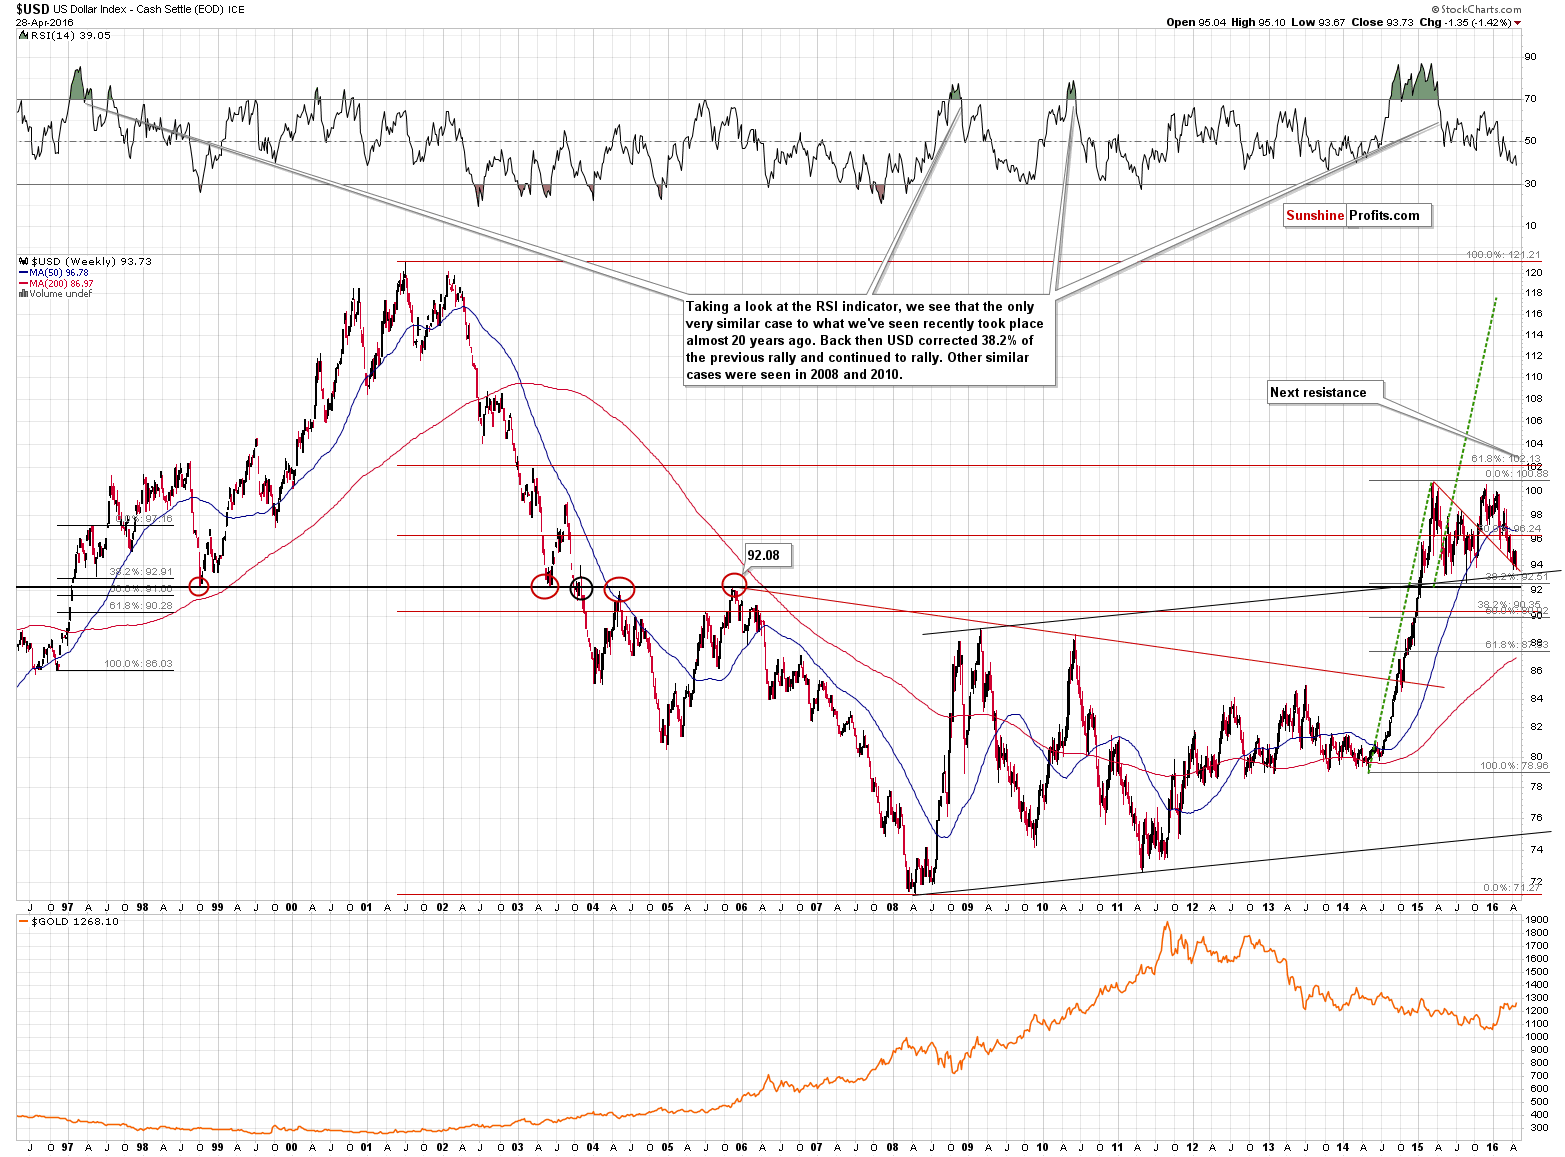
Now, keeping this in mind, let’s take a look at the long-term chart. The implications are much more important. Firstly (and less importantly), please note that the long-term support levels are aligned more or less aligned with the short-term ones. In today’s pre-market downswing USD moved to the upper border of the rising trend channel above which USD broke in early 2015. The 38.2% Fibonacci retracement level is at about 92.5, which is another strong support. The level through which the USD Index broke (about 92) and that stopped previous declines and rallies (marked with red ellipses) is also relatively close.
The second thing is even more important for us, precious metals investors. Please note that this year’s move higher in gold (lower part of the chart) has been a reflection of the decline in the USD Index. It was not until the USD Index started to slide that gold started to rally. Gold is now a bit (from the long-term perspective) below the level it reached in early 2015 and USD is a bit above this level. More or less what’s been going on in gold within the past year or so can be explained by the moves in the USD Index. Why is this so important? Because the very limited potential for additional declines in the USD Index implies very limited (again, from the long-term perspective) potential for a move higher in gold.
In early 2015, USD broke through all these important resistances in a sharp, volatile fashion and the fact that it’s been consolidating for many months is not surprising – it’s quite natural. Was the breakout invalidated? No. Are the support levels close? Yes. This means that the USD Index is likely to rally – if not right away, then relatively soon. This means that gold is likely to decline – and decline significantly, just as the USD Index is likely to rally significantly. The moves that follow consolidations tend to be similar to the moves that preceded it and this provides with an upside target of 118 in the USD Index.
Is the bottom in the USD Index already in? Possibly, but the most important thing is that if it’s not, then it’s not likely far away. The opposite is the case with gold.
With the situation in the USD Index being as it is, being invested in the precious metals market appears very risky.
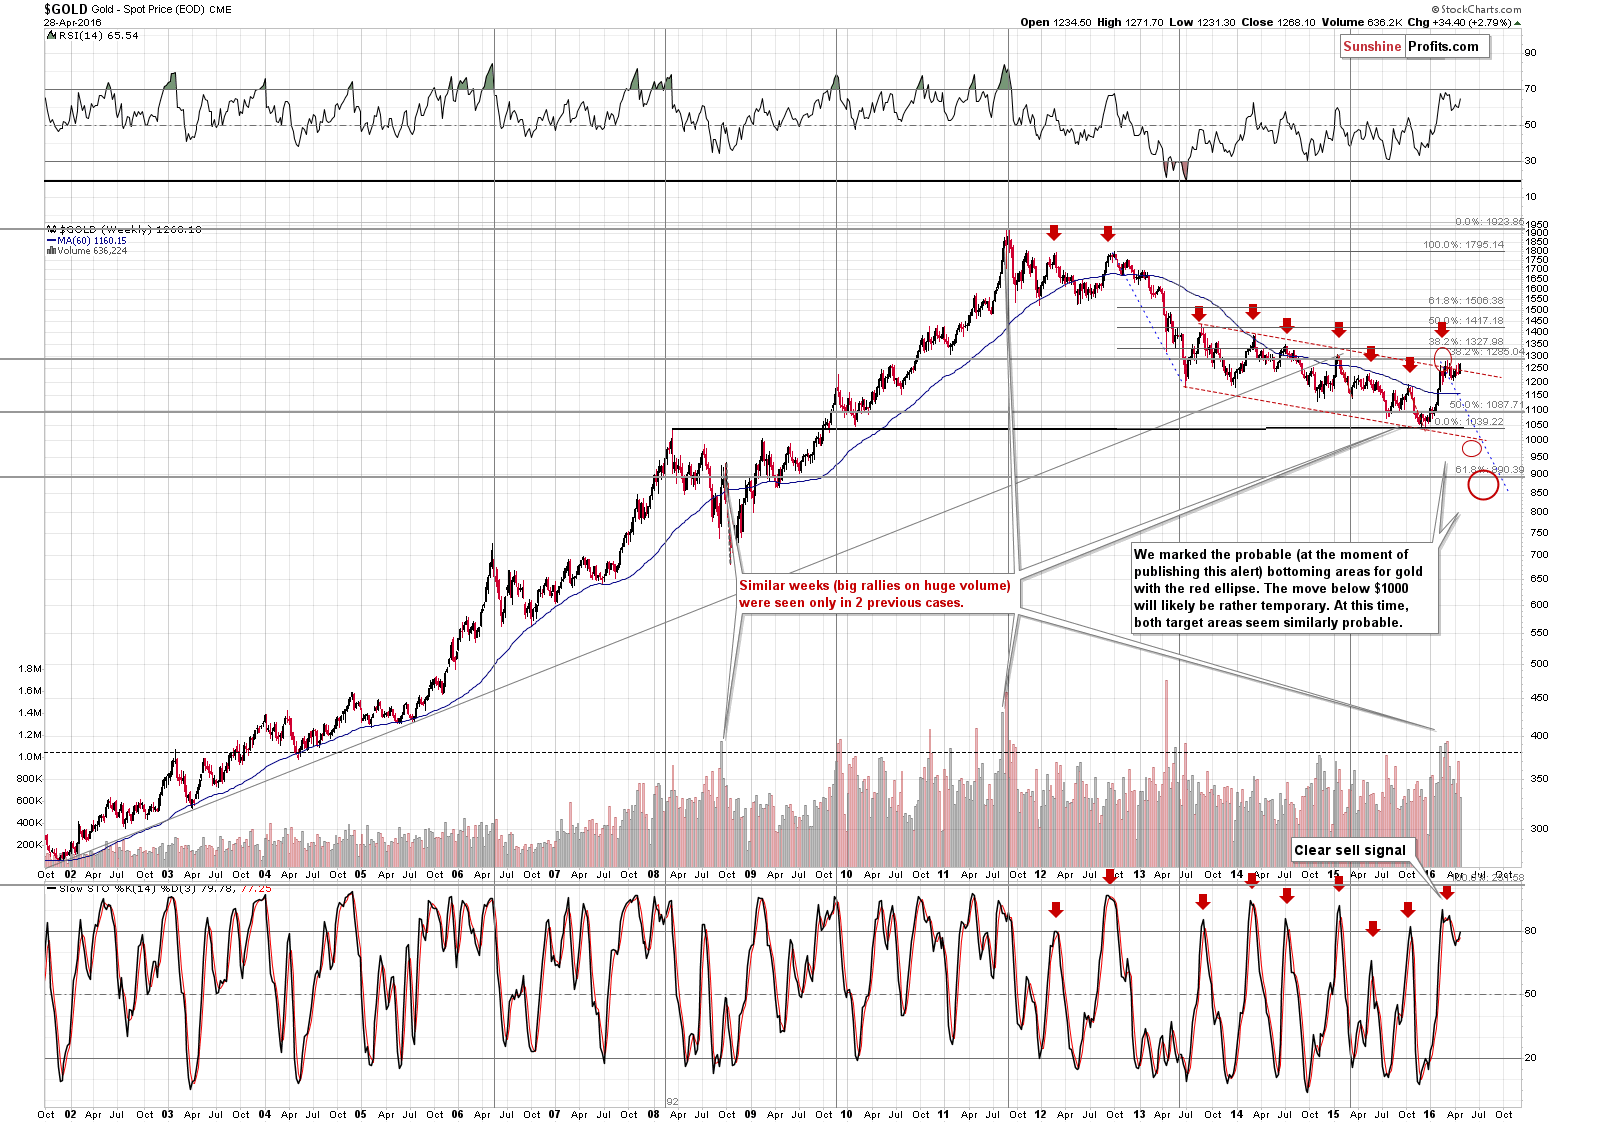
Gold is now a bit above the declining trend channel, but all previous similar attempts to break out were invalidated, so we don’t view this breakout as important – at least not yet. Moreover, gold didn’t move above the 38.2% Fibonacci retracement based on the entire bull market, so all in all not much changed.
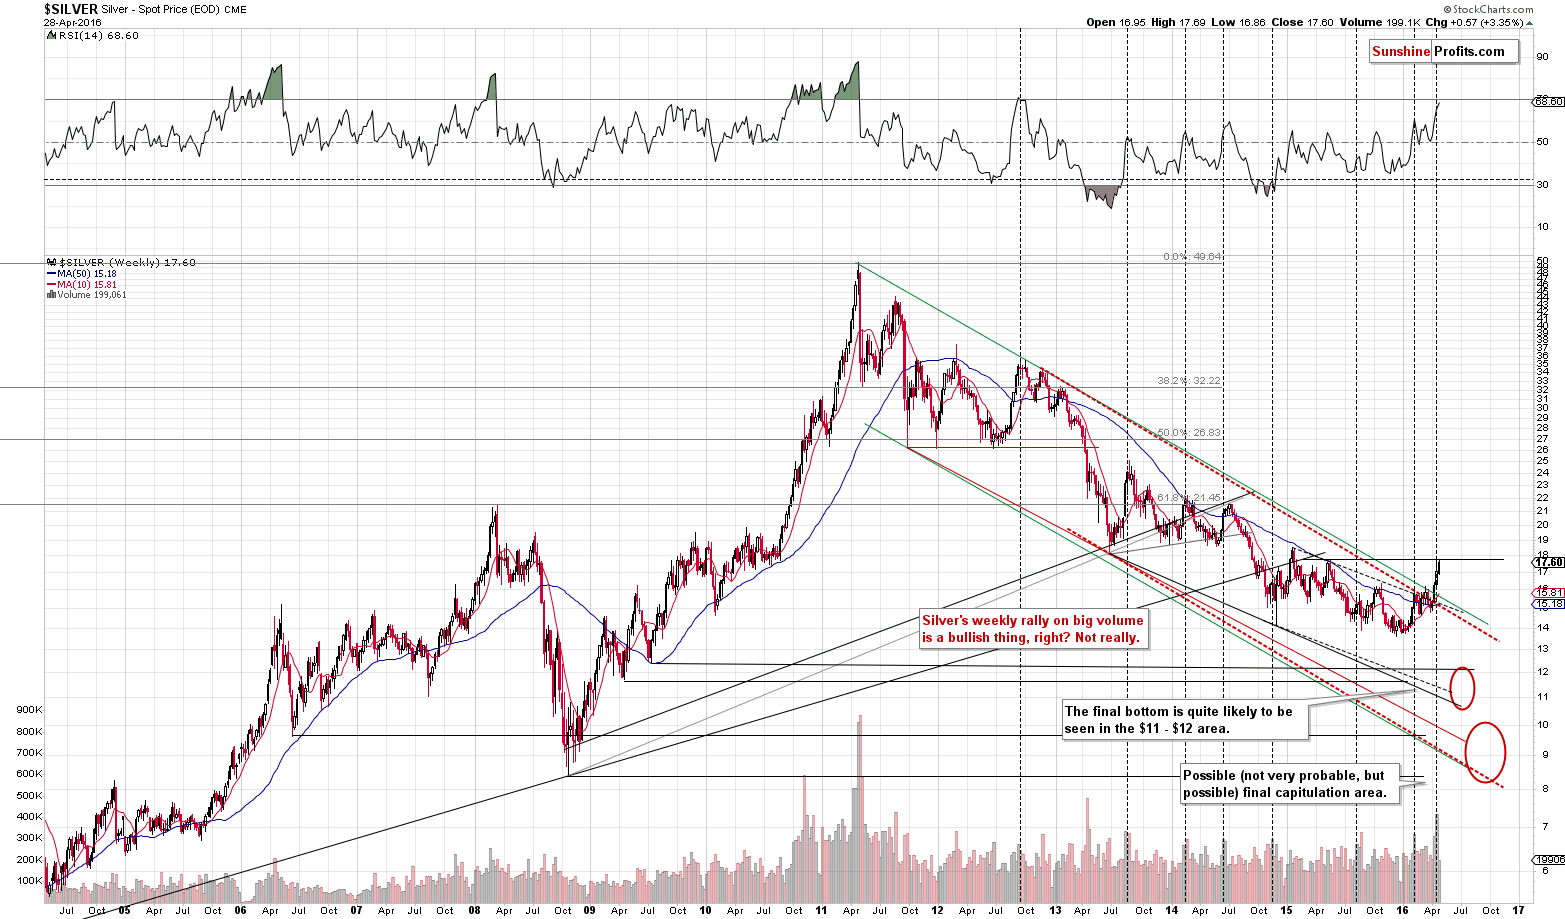
Meanwhile, silver also moved a bit higher yesterday and today, but it remains below its May 2015 high, so nothing really changed and the outlook remains bearish. Our previous comments about the bearish implications of high volume in silver remain up-to-date.
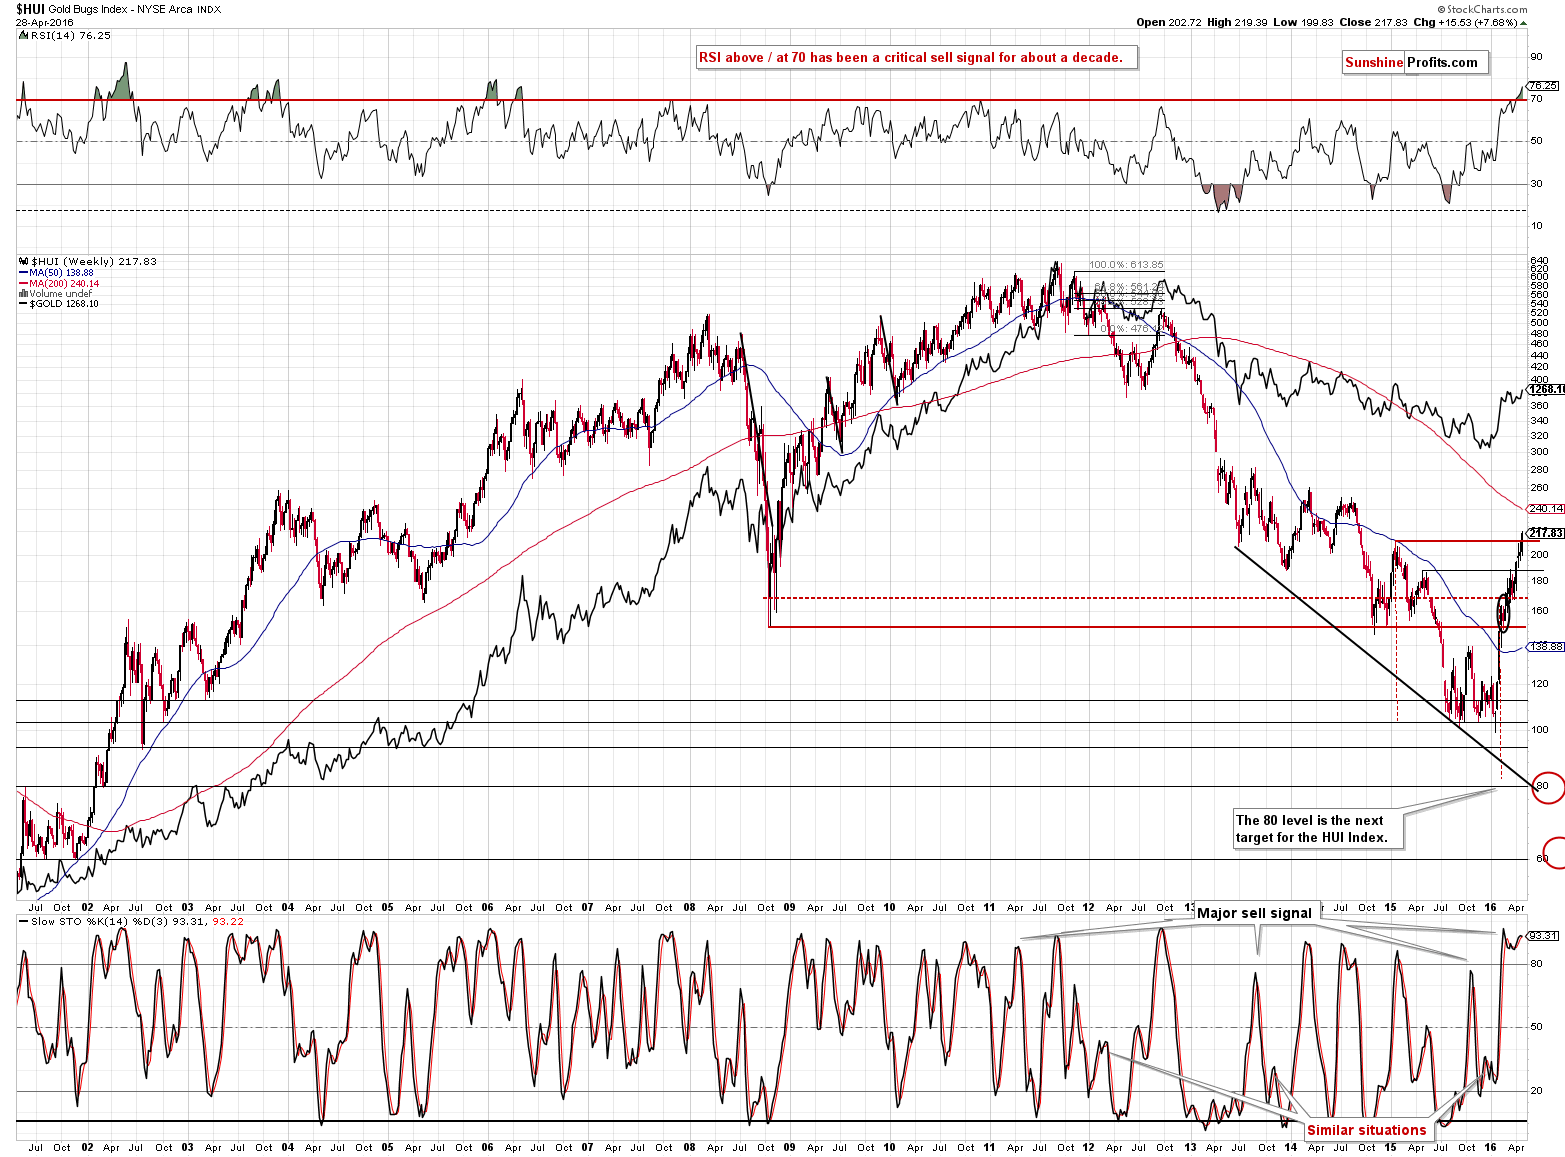
Gold stocks moved above their 2015 high, but the breakout is unconfirmed so far (just 1 daily close above this level) and given the extremely overbought reading in the RSI indicator it is doubtful that gold miners can really rally much higher (let’s keep in mind that the situation in the USD Index is likely to affect miners too).
Summing up, the current situation in the USD Index suggests that a big move higher in it will be seen rather sooner than later and the implications for the precious metals market are profound and bearish. Since the major breakout in the USD Index was never invalidated (conversely, it was verified a few times already) and USD is very close to both: short- and long-term support levels, we can expect higher USD values in the coming weeks. This is likely to translate into much lower precious metals values – if not immediately, then still very likely relatively soon. The only part of the precious metals sector where anything changed are the mining stocks, which moved above their 2015 high. Still, miners are extremely overbought on a short- and medium-term basis and we expect to see an invalidation of the breakout in mining stocks and once we see it, we will most likely re-enter the short position in mining stocks, but we are not automatically doing so at this time. We are also moving the stop-loss order for silver a bit higher as the white metal moved close to it. If it get’s hit, we’ll likely re-enter the position at higher prices.
As always, we will keep you – our subscribers – updated.
To summarize:
Trading capital (our opinion): Short positions (full) in gold, silver and mining stocks are justified from the risk/reward perspective with the following stop-loss orders and initial target price levels:
- Gold: initial target price: $973; stop-loss: $1,304, initial target price for the DGLD ETN: $89.05; stop-loss for the DGLD ETN $47.15
- Silver: initial target price: $12.13; stop-loss: $18.17, initial target price for the DSLV ETN: $61.16; stop-loss for DSLV ETN $26.34
Long-term capital (our opinion): No positions
Insurance capital (our opinion): Full position
Plus, you might want to read why our stop-loss orders are usually relatively far from the current price.
Please note that a full position doesn’t mean using all of the capital for a given trade. You will find details on our thoughts on gold portfolio structuring in the Key Insights section on our website.
As a reminder – “initial target price” means exactly that – an “initial” one, it’s not a price level at which we suggest closing positions. If this becomes the case (like it did in the previous trade) we will refer to these levels as levels of exit orders (exactly as we’ve done previously). Stop-loss levels, however, are naturally not “initial”, but something that, in our opinion, might be entered as an order.
Since it is impossible to synchronize target prices and stop-loss levels for all the ETFs and ETNs with the main markets that we provide these levels for (gold, silver and mining stocks – the GDX ETF), the stop-loss levels and target prices for other ETNs and ETF (among other: UGLD, DGLD, USLV, DSLV, NUGT, DUST, JNUG, JDST) are provided as supplementary, and not as “final”. This means that if a stop-loss or a target level is reached for any of the “additional instruments” (DGLD for instance), but not for the “main instrument” (gold in this case), we will view positions in both gold and DGLD as still open and the stop-loss for DGLD would have to be moved lower. On the other hand, if gold moves to a stop-loss level but DGLD doesn’t, then we will view both positions (in gold and DGLD) as closed. In other words, since it’s not possible to be 100% certain that each related instrument moves to a given level when the underlying instrument does, we can’t provide levels that would be binding. The levels that we do provide are our best estimate of the levels that will correspond to the levels in the underlying assets, but it will be the underlying assets that one will need to focus on regarding the sings pointing to closing a given position or keeping it open. We might adjust the levels in the “additional instruments” without adjusting the levels in the “main instruments”, which will simply mean that we have improved our estimation of these levels, not that we changed our outlook on the markets. We are already working on a tool that would update these levels on a daily basis for the most popular ETFs, ETNs and individual mining stocks.
Our preferred ways to invest in and to trade gold along with the reasoning can be found in the how to buy gold section. Additionally, our preferred ETFs and ETNs can be found in our Gold & Silver ETF Ranking.
As always, we'll keep you - our subscribers - updated should our views on the market change. We will continue to send out Gold & Silver Trading Alerts on each trading day and we will send additional Alerts whenever appropriate.
The trading position presented above is the netted version of positions based on subjective signals (opinion) from your Editor, and the Tools and Indicators.
As a reminder, Gold & Silver Trading Alerts are posted before or on each trading day (we usually post them before the opening bell, but we don't promise doing that each day). If there's anything urgent, we will send you an additional small alert before posting the main one.
=====
Latest Free Trading Alerts:
Yesterday, the Bank of Japan released its most recent monetary policy statement. How can it affect the gold market?
The Commitments of Traders Report is one of the most important publications on the gold market. We invite you to read our today’s article presenting the link between the long-term trends in Comex traders’ positioning and the gold prices and find out how to use the CoT report for trading purposes.
How to Use the CoT Report in Gold Investing?
2016 is an U.S. presidential election year. This is an important fact for the gold market, because the elections tend to influence financial markets and where the price of gold is headed.
=====
Hand-picked precious-metals-related links:
What Steve Jobs knew about the internet that can make you a better gold investor
=====
In other news:
China’s Central Bank Raises Yuan Fixing by Most Since July 2005
Euro zone economy accelerates, but prices fall more than expected
President Obama Weighs His Economic Legacy
Obama's Economic Disappointment
For U.K. and EU, Breaking Up Is Legally Hard to Do
Unmasking the Men Behind Zero Hedge, Wall Street's Renegade Blog
=====
Thank you.
Sincerely,
Przemyslaw Radomski, CFA
Founder, Editor-in-chief, Gold & Silver Fund Manager
Gold & Silver Trading Alerts
Forex Trading Alerts
Oil Investment Updates
Oil Trading Alerts

