

Briefly: In our opinion, full (150% of the regular size of the position) speculative long positions in gold, silver and mining stocks are justified from the risk/reward perspective at the moment of publishing this alert.
Yesterday’s session was critical for the short term. Gold and silver declined, while the USD Index soared to new 2018 highs and metals closed relatively unchanged. It all happened at the combination of several turning points, some based on regular cyclicality, and some based on the apexes of triangles. Will the precious metals sector reverse and really rally shortly?
In short, that seems very likely. In fact, gold and silver are already moving higher today. Let’s take a look at the charts and check what actually happened, why it could have happened the way that it did, and what the implications going forward are. Let’s start with gold (chart courtesy of http://stockcharts.com).
Gold’s Turning Point
In yesterday’s first alert, we wrote the following:
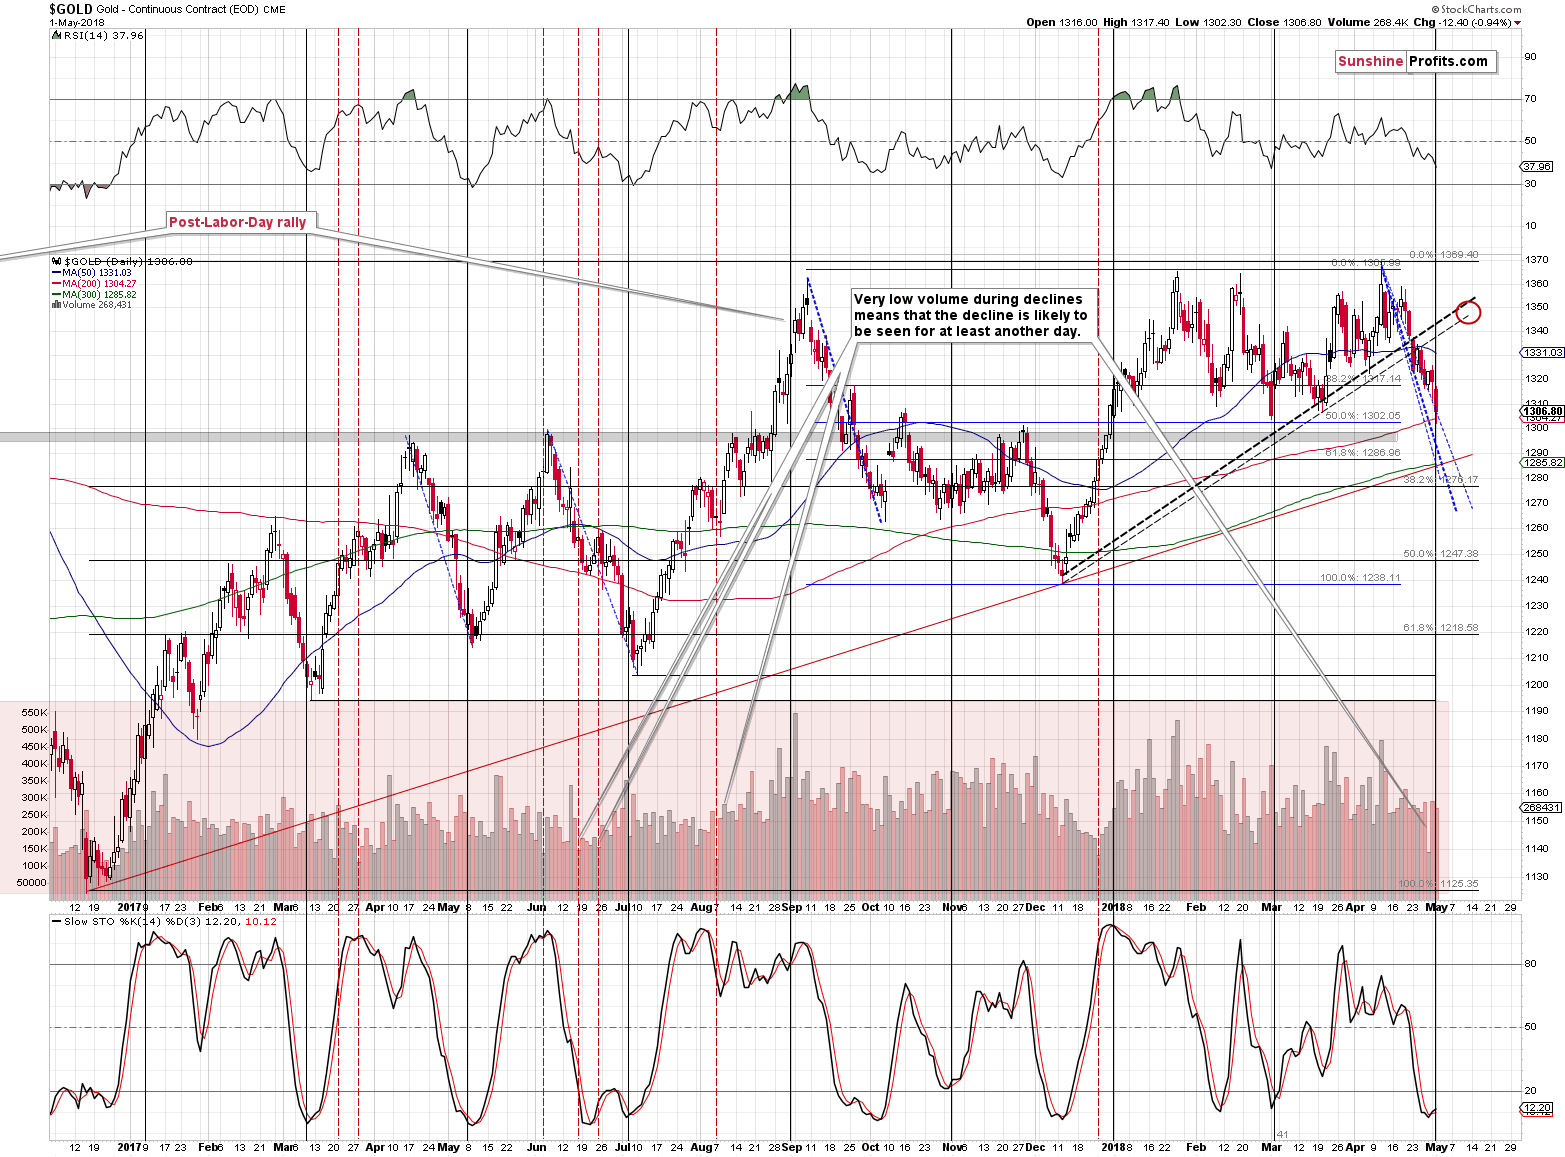
Gold’s reversal day is today, but since it works on a near-to basis, it’s no wonder that gold reversed yesterday. Today’s pre-market move lower is not that surprising, though. The volume during yesterday’s session was not huge, but it was not low either, which means that it doesn’t confirm the reversal, but it doesn’t invalidate it either. If it wasn’t for the cyclical turning point, we wouldn’t put a lot of weight to the reversal candlestick, but since we do have it at hand, the shape of the session adds to its bullish implications.
We saw a small buy signal in the Stochastic indicator, which has bullish implications as the last several times when we saw it, a visible rally followed.
Before moving further, let’s consider how high gold could go, if it does indeed rally from here. There are generally only two resistance levels that appear significant from the short-term point of view. Both are based on the rising line that’s created using the December and mid-March bottoms. One line is based on intraday lows and the other is based on daily closing prices.
Based on these lines and assuming (we’ll explain shortly) that it will take about 2 weeks to reach them, the price target area is approximately between $1,340 and $1,350. There is no clear single price that would determine that a top is in – it will be necessary to look for confirmations from other signals and markets. Naturally, we’ll keep you – our subscribers – informed.
The above remains up-to-date, but we’d like to be more specific about the target area. Yesterday, we provided approximate values, and the more precise ones are $1,345 - $1,353.
Gold declined to $1,302 and then moved back up to about $1,307 very close to the cyclical turning point, which means that it was quite likely the local bottom. The odds increase further, because the $1,300 level or its proximity served as support and resistance multiple times in the past.
Silver at Previous Lows
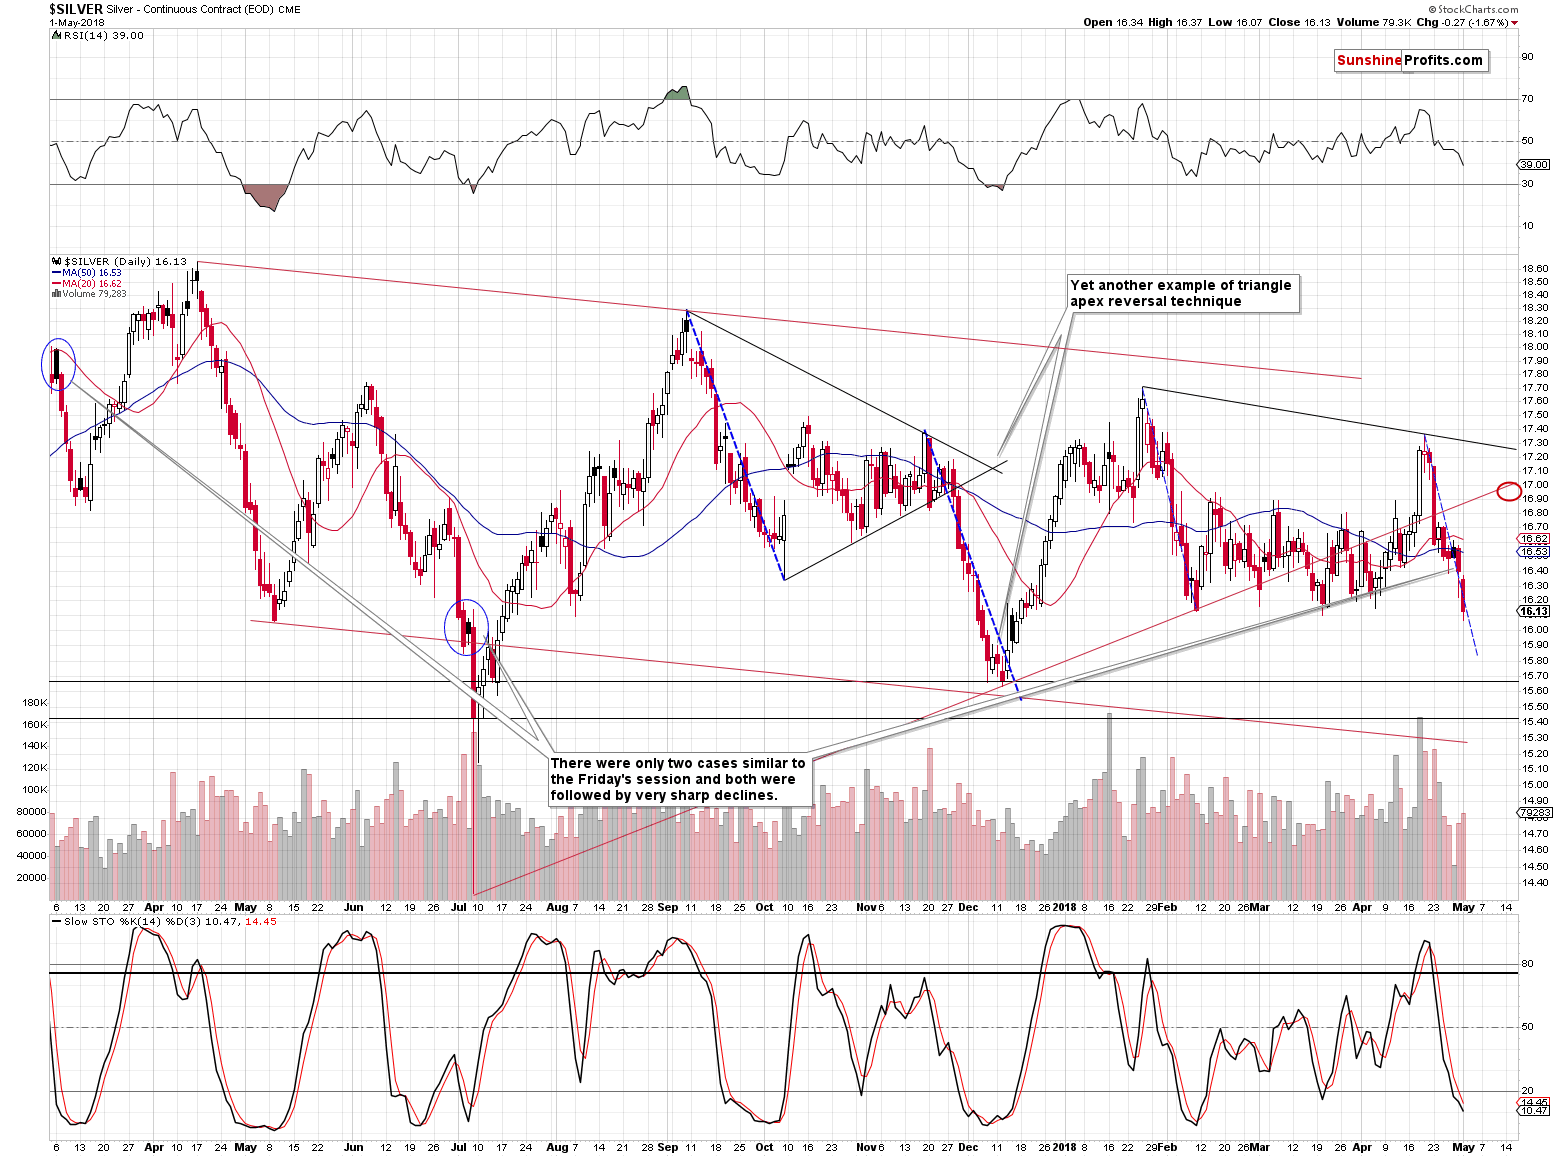
In yesterday’s alert, we wrote that it was possible for silver to move even lower on an intraday basis and that’s what we saw. The white metal declined to its previous lows and we tripled the size of the short position when the white metal was trading at $16.10. At the moment of writing these words, it’s already at $16.30. The reversal seems to be complete and in perfect tune with silver’s apex-based pattern.
Our yesterday’s comments on the above chart, remain up-to-date:
It’s still likely that the decline is ending from the very short-term point of view (and only from this point of view – the medium-term outlook remains very bearish) and we’ll show you one additional factor supporting the above in the following part of the alert.
For now, let’s discuss how high silver will be likely to rally if the upswing does indeed materialize.
In general, its usually difficult to predict silver’s short-term highs in advance, due to silver’s tendency to rally strongly right before the end of the move, even to the point of breaking above important resistance levels only to invalidate the breakout with vengeance in the following days, hours or minutes. Still, if gold rallies to the previously broken rising support / resistance line, then perhaps silver will do the same. This line is marked in red and it will be close to $16.90 in about 2 weeks. That’s when we saw previous silver highs, which adds credibility to this target.
To be more precise, the target area is $16.90 - $17.
Mining Stocks’ Extreme Short-term Strength
In yesterday’s first alert, we wrote the following.
The cyclical turning point supports a reversal not only in gold, but also in mining stocks. Since the entire precious metals market is likely to move together, it’s likely that silver will move along if both above rally shortly.
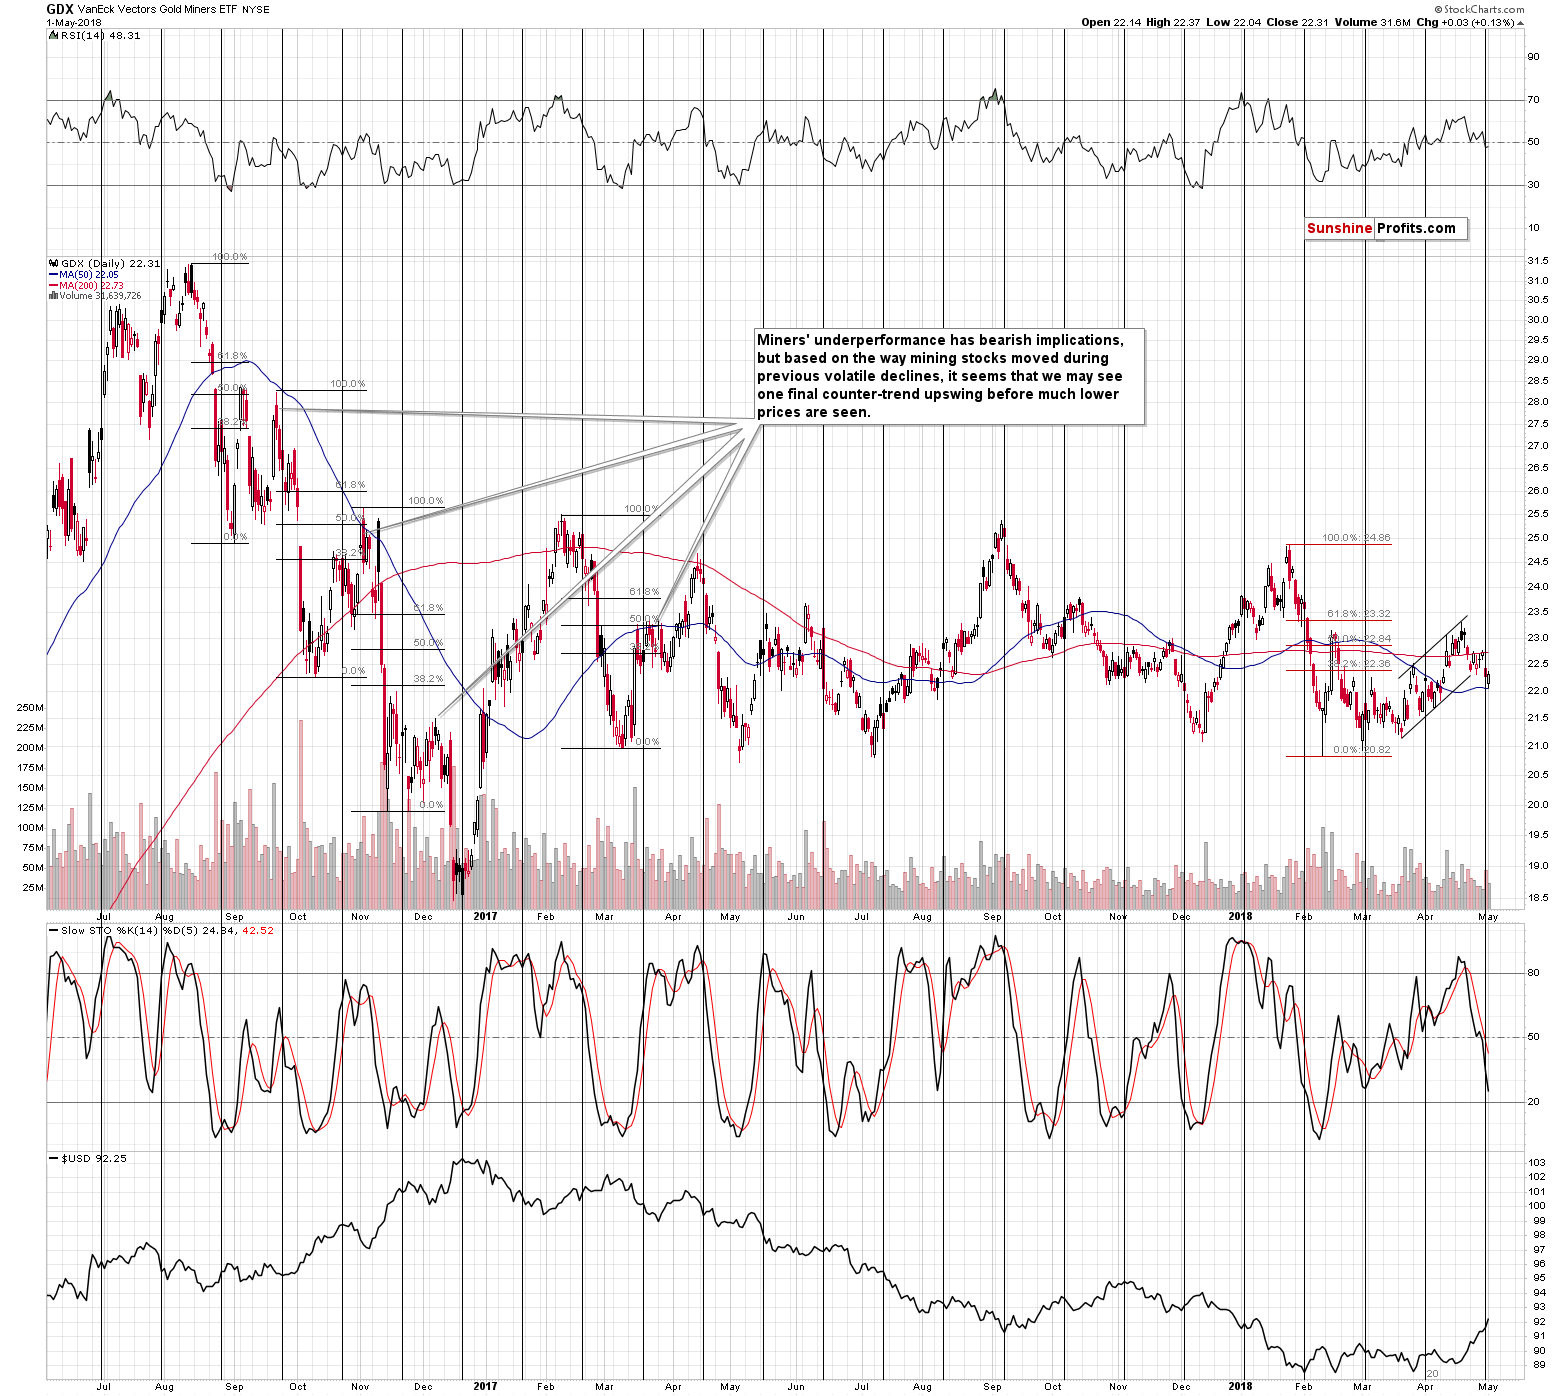
The move lower and the breakdown below the short-term rising support line appears bearish, especially that we saw it on significant volume. The turning point nullifies this implication. One could even say that it makes the outlook bullish for the following days, but not for today as the shape of yesterday’s session seems to be a more important factor in the immediate-term and since it looks like GDX was not done declining yesterday, it’s likely to continue lower at least in the early part of today’s session.
And it did. GDX declined in the first minutes of the session and rallied back up shortly, finally closing the session above the previous daily close. The rally was even bigger in the case of the HUI Index, which moved up by 0.41%. It doesn’t seem to be a significant number on its own, but it’s huge if one compares it to the fact that both gold and silver declined during yesterday’s session.
That’s a profoundly bullish factor for the short term.
As far as the price target is concerned, GDX is likely to once again rally to its 61.8% Fibonacci retracement level and the April high at about $23.30.
USD’s Target Reached
We previously commented on the USD in the following way:
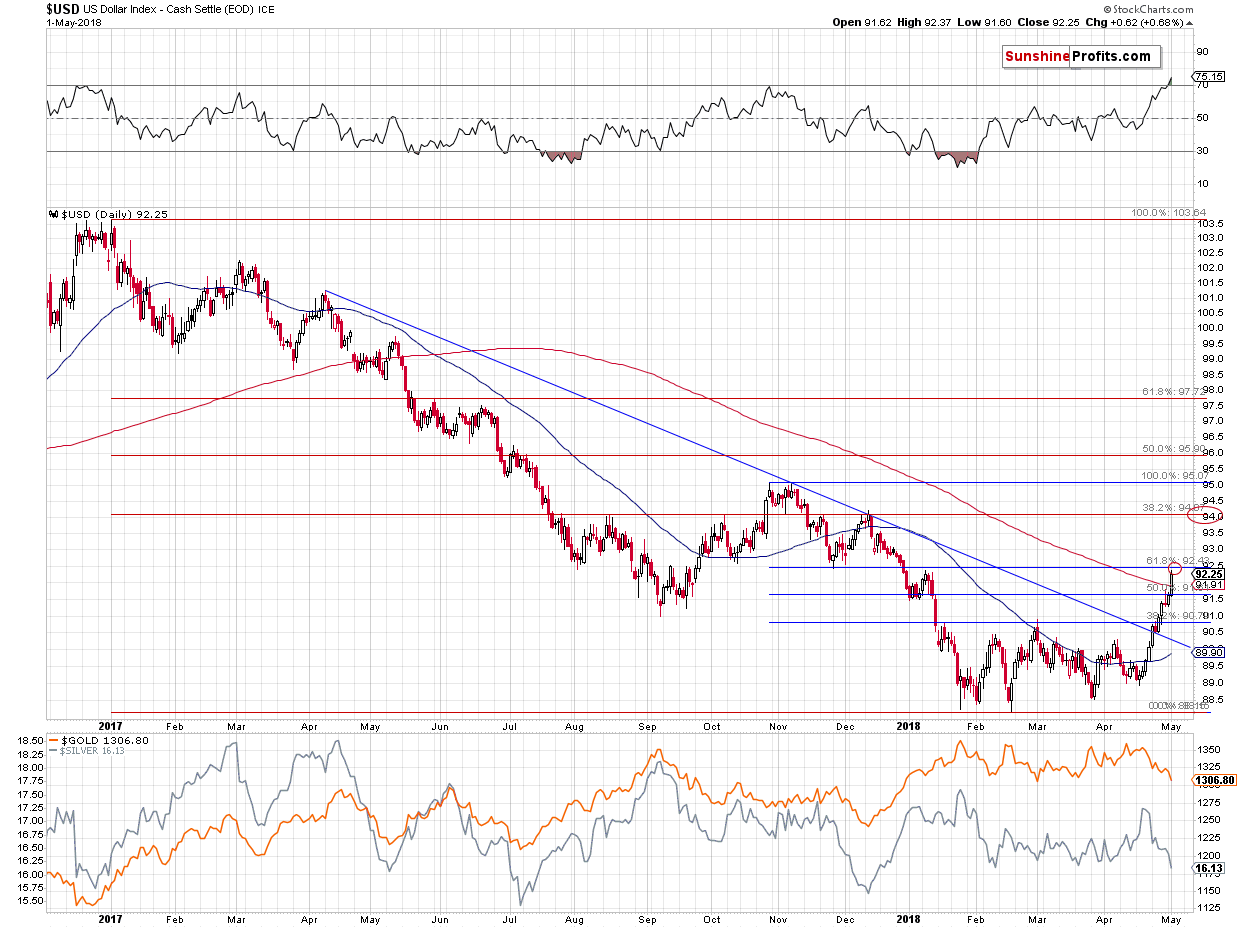
The USD Index rallied significantly in the second half of April and it broke through several important resistance levels. The key resistance that you can see on the above chart is the declining blue line. It’s noteworthy that the USDX initially moved lower immediately after breaking above it and it successfully tested this line as support. The rally then continued and we saw several closes above it, including the weekly one. The medium-term outlook improved greatly, but we wouldn’t rule out another verification of the mentioned blue line in the following weeks.
There are three things that make a short-term move lower likely – the RSI very close to the 70 level, the fact that USDX tried to break above the 2017 low, the January 2018 low and the 50% Fibonacci retracement, and failed, and the shape of the Friday’s session. Namely, we saw a clear reversal.
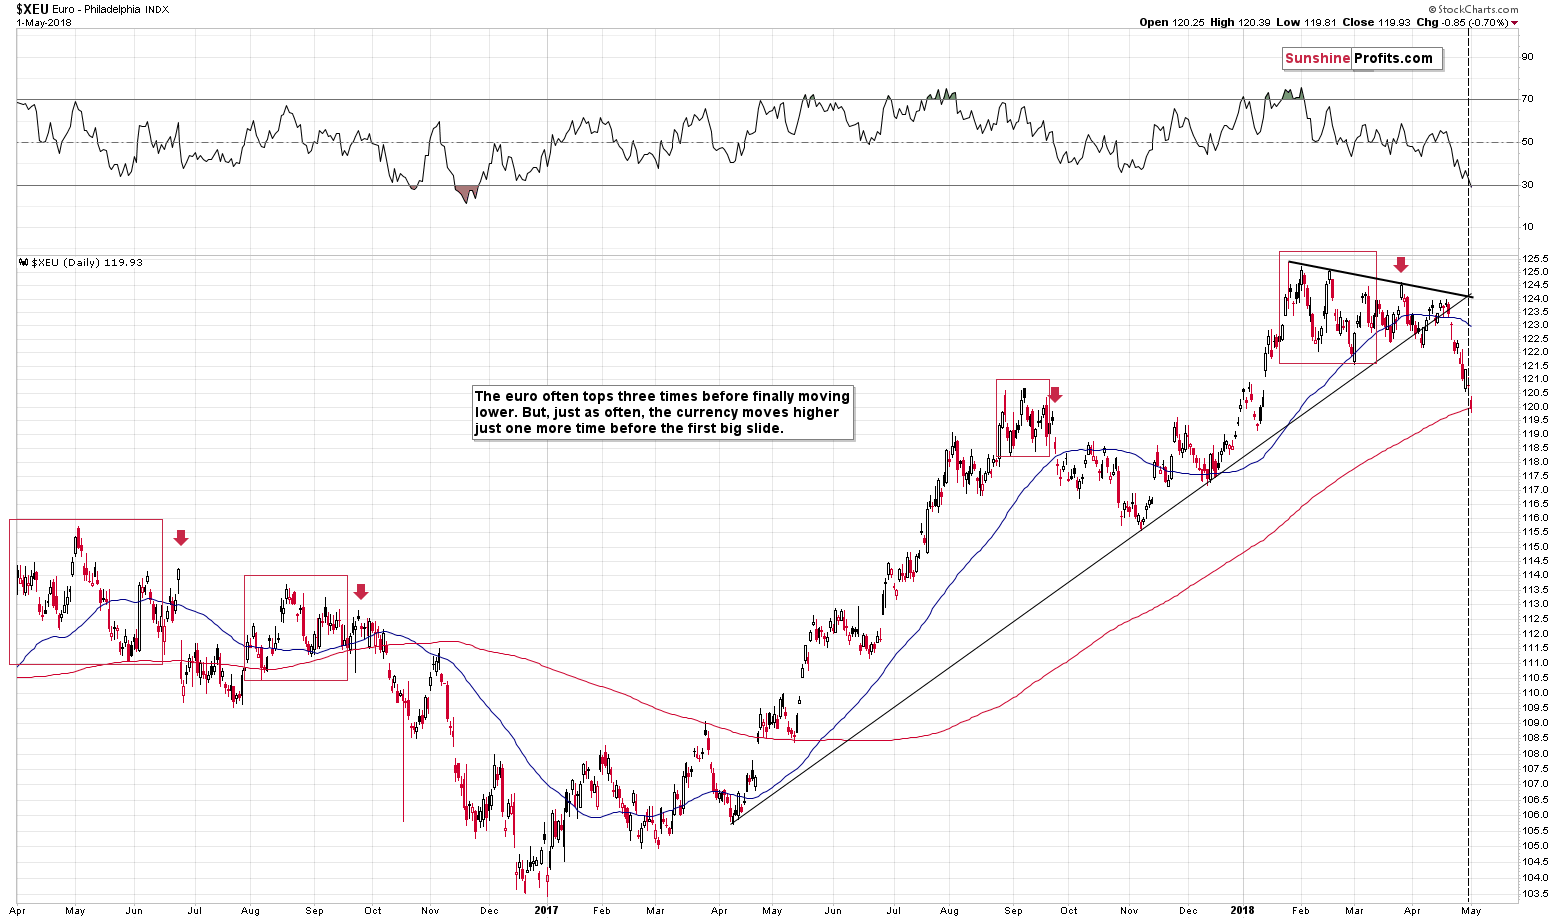
The EUR/USD moved higher right at its triangle-apex-based reversal, which also suggests that we’ll see a break in the current decline.
But, does it have to start right away? Not necessarily. The USD Index could form another reversal as that’s what it used to do quite a few times in the past. For instance, the early December 2016 reversal was not the final one – the USDX topped two days later. The early April 2016 reversal was also followed by 2 (in terms of daily closing prices) or 3 (in intraday terms) days of higher prices. In such case, we could even see a quick move to the 61.8% Fibonacci retracement, which is approximately at the 2018 high and November and October 2017 lows.
Plus, there were several reversals in December 2016 and October/November 2017 before the USD finally declined.
In yesterday’s first alert, we added the following:
After the above was posted, we saw another daily upswing in the USD, which was in tune with our expectations. The USD Index could move even higher today or tomorrow, but it’s not an outlook worth betting on, it would seem. The time for the correction here is based on the euro’s apex-based turning point.
Moreover, please note that the RSI based on the USDX is now above 70, which means that it's higher than it's been since the beginning of 2017. That’s right, with regard to the RSI, the USD Index is more overbought on a short-term basis than it was at the late-2016 / early-2017 high and more overbought than on any other day that followed.
How low can the USD Index move? To 90.10 or so. That’s where we have the declining blue support line and it seems to be the most prominent support level that’s visible on the above chart. Another possibility is the March high of 90.89, but since the USD Index is only about 1 index point above this level, it might not be enough to cool down the investors’ RSI-confirmed enthusiasm.
The situation became even more extreme based on yesterday’s move higher, but since the key resistance level (combination of the previous 2018 high and the 61.8% Fibonacci retracement) was approximately reached, it seems that the rally will now stop for a while.
The previous 2018 high (January 9) had been 92.36 and yesterday’s intraday high was 92.37. The USD Index tried to break above it, but the breakout was immediately invalidated. Interestingly, the closing price on January 9 had been 92.26, and yesterday’s closing price was 92.25. So, after a 0.01 intraday breakout, there was a 0.01 comeback below the closing price. A subtle, yet important invalidation sign.
One more thing that we would like to add to yesterday’s analysis is that since the USD moved even higher, it also moved further away from the March high and thus a correction to this level would no longer be something tiny. This means that this level (90.89) is now just as probable as 90.10 as the downside target.
The likelihood of a pullback is also visible at first sight from the very long-term point of view.
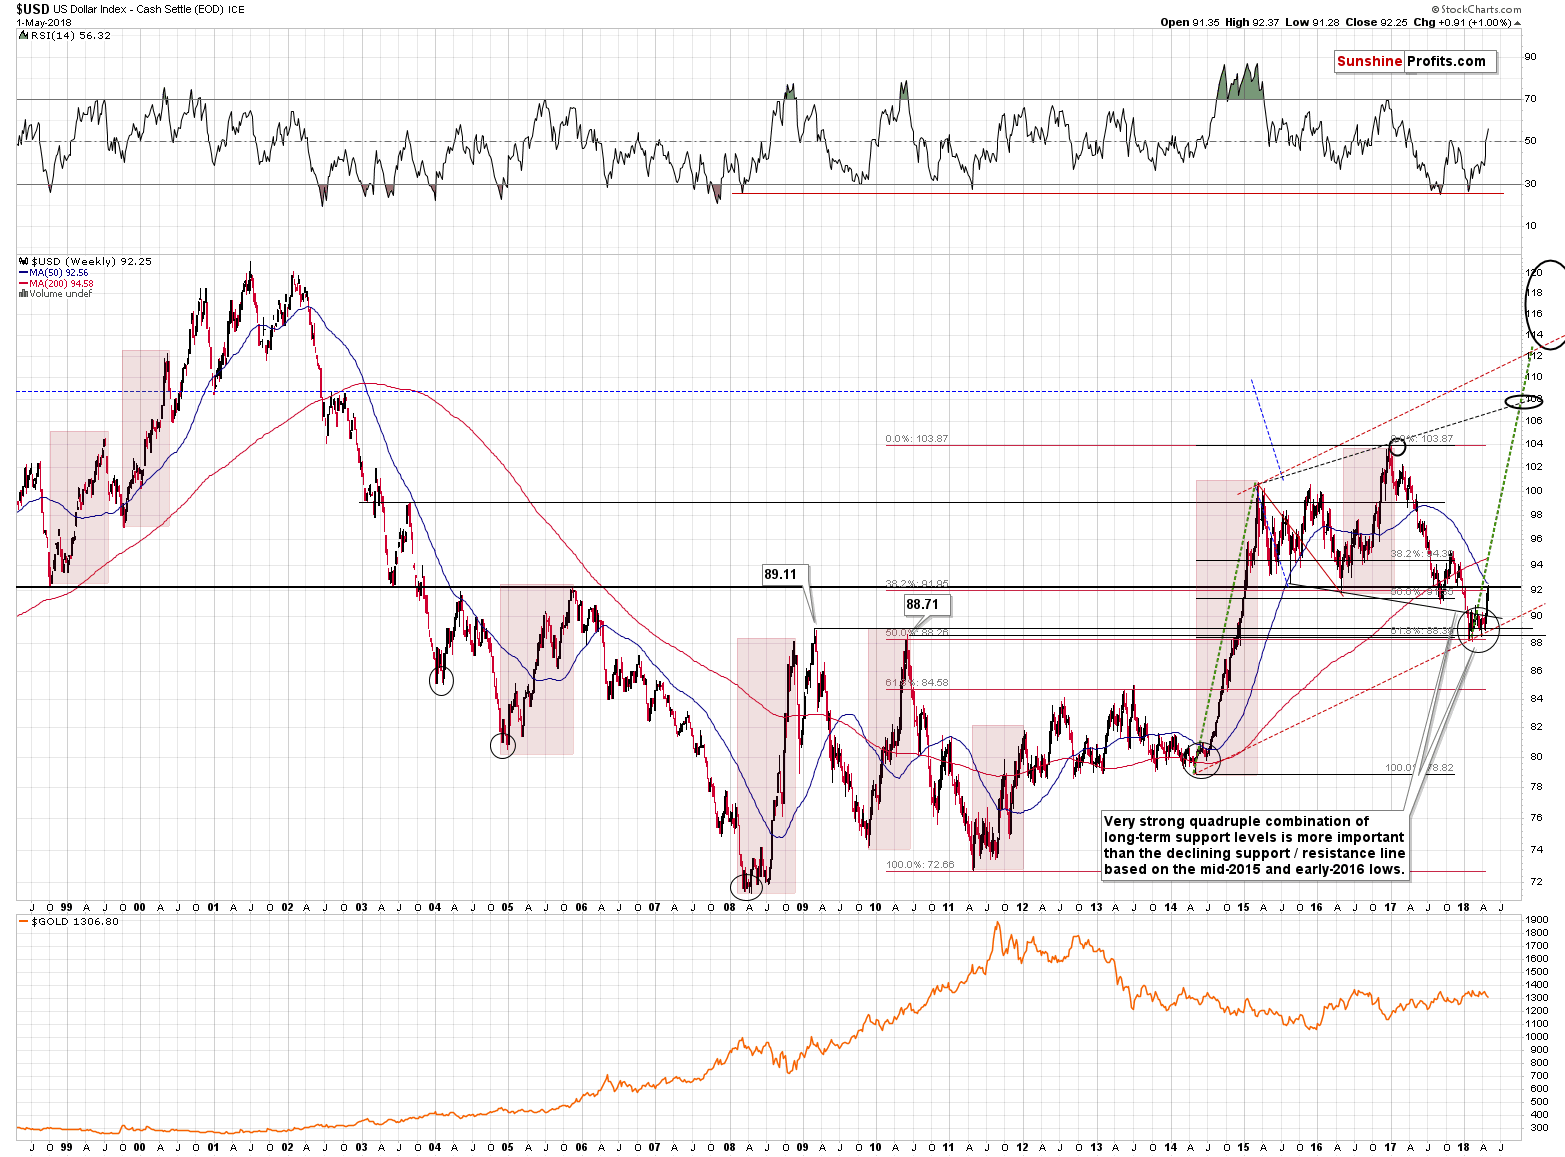
At first sight, it’s clear that the recent rally was extremely sharp. In fact, it was even sharper than the rally which we saw in 2014 and which seems to be repeating (to a considerable extent) right now.
Those who called us crazy for predicting the USD’s rally when it was below 90 for months are probably no longer doing so, as the USD soared even quicker than 4 years ago. But that may be a problem for the short term. Whenever the price gets ahead of itself too fast, it has to correct. The green dashed lines show the similarity between both rallies and the current one also serves as a guideline (pun intended). The first bigger correction in 2014 took place when the USD Index moved close to the green line and that’s what we’re seeing this week. Back then, the USDX moved back to the previous high and verified it as support. We might see something similar also this time and this similarity increases the odds for the decline to be stopped by the proximity of 90.89. In other words, if / when the USD Index moves to about 91, it will be high time to watch the markets for buy signals in the USDX and sell signals in gold, silver, and mining stocks.
The following two sections remain up-to-date and we are quoting them in their entirety, as they are so critical for the current short-term outlook. We want to make sure that you don’t miss them.
True Seasonals for May
The True Seasonal patterns are the regular seasonality plus the effects of the expirations of derivatives: futures, options and stock options. You can read a detailed report on this tool by clicking here and the long-story-short version is that this upgraded version of seasonality is most useful when there are no strong signals from other tools, but even if there are other signals in place, it can be used as confirmation. Overall, it’s more of a loose guideline than a strict rule.
So, let’s take a look what’s in store for this month.
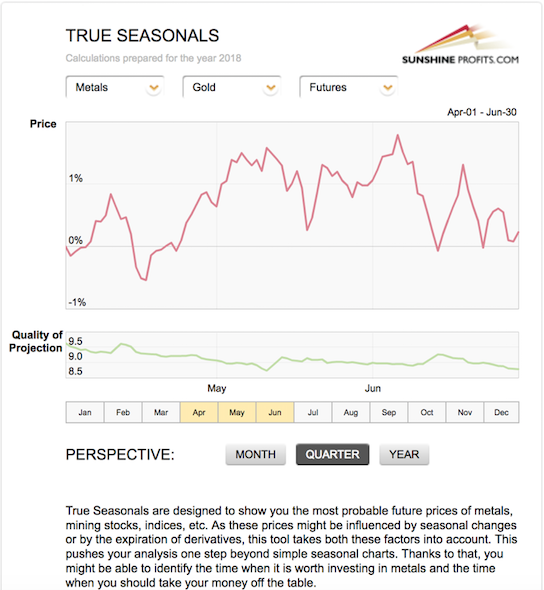
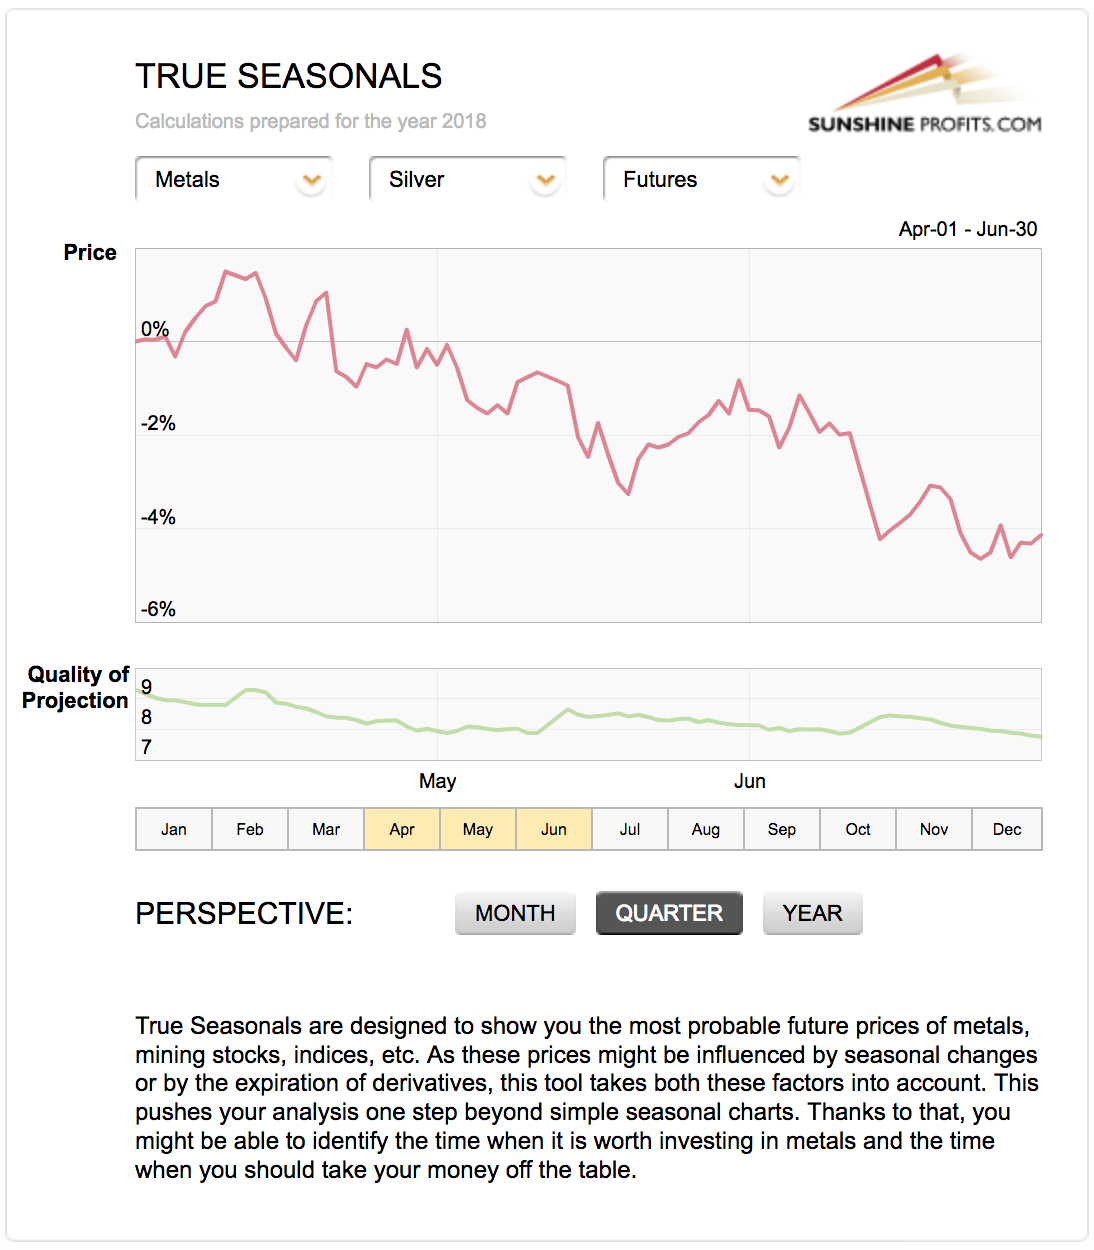
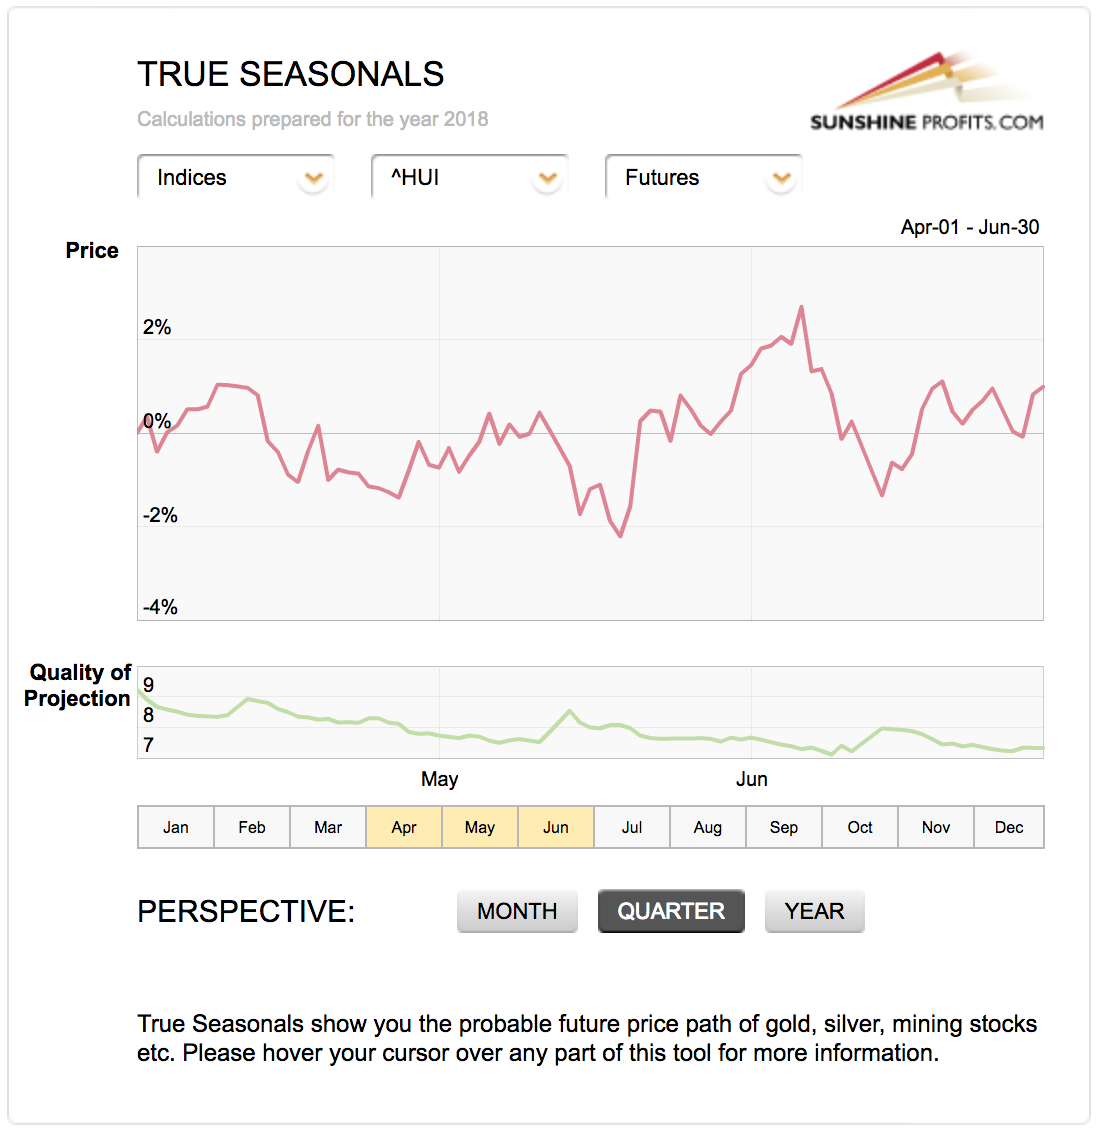
Gold’s rally, silver’s decline and miners’ horizontal trend are not errors – that’s a reflection of how the PM market performed in the recent years. It doesn’t necessarily imply that gold will lead, silver will lag, and the miners’ performance will be average. The relative performance is more likely to depend on individual factors that change from year to year.
What’s most interesting about the three above charts is what is similar in the case of all markets and this thing is the local top on May 11th in all cases. If it was just one market that suggested a top at that time, it wouldn’t be that important – but since all three do, it’s something that we should definitely keep in mind.
Taking this one level higher, if the True Seasonality was the only thing that made the outlook bullish and a top close to May 11th likely, we still wouldn’t view this time target as very important. But this time target is confirmed by – that’s right, you guessed it – apex-based turning points.
Apex-Based Reversals
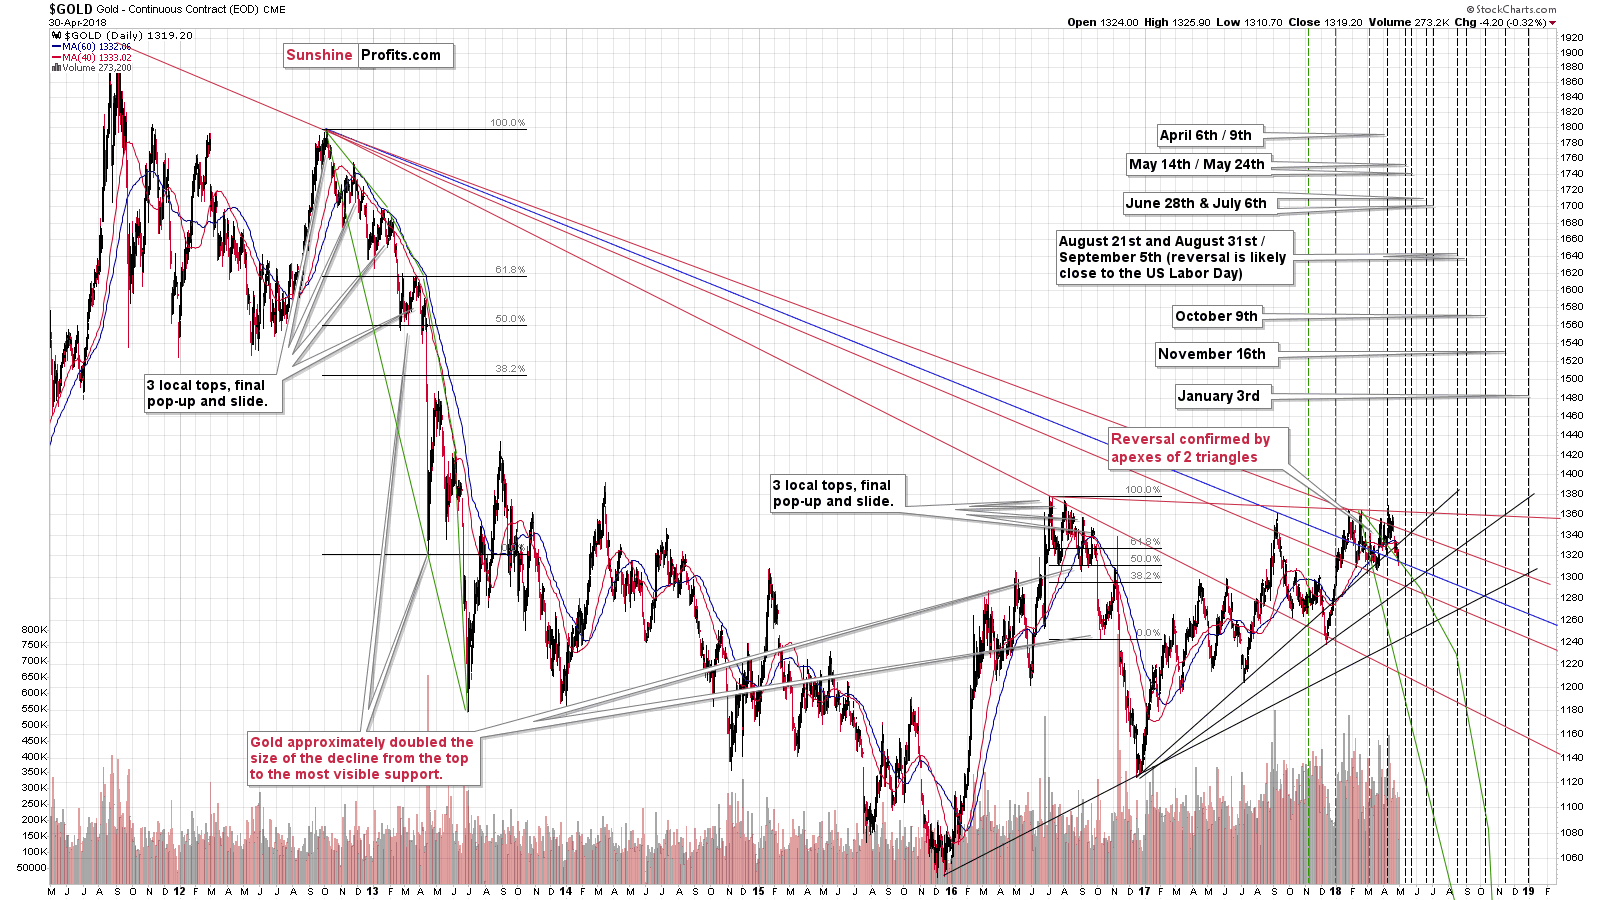
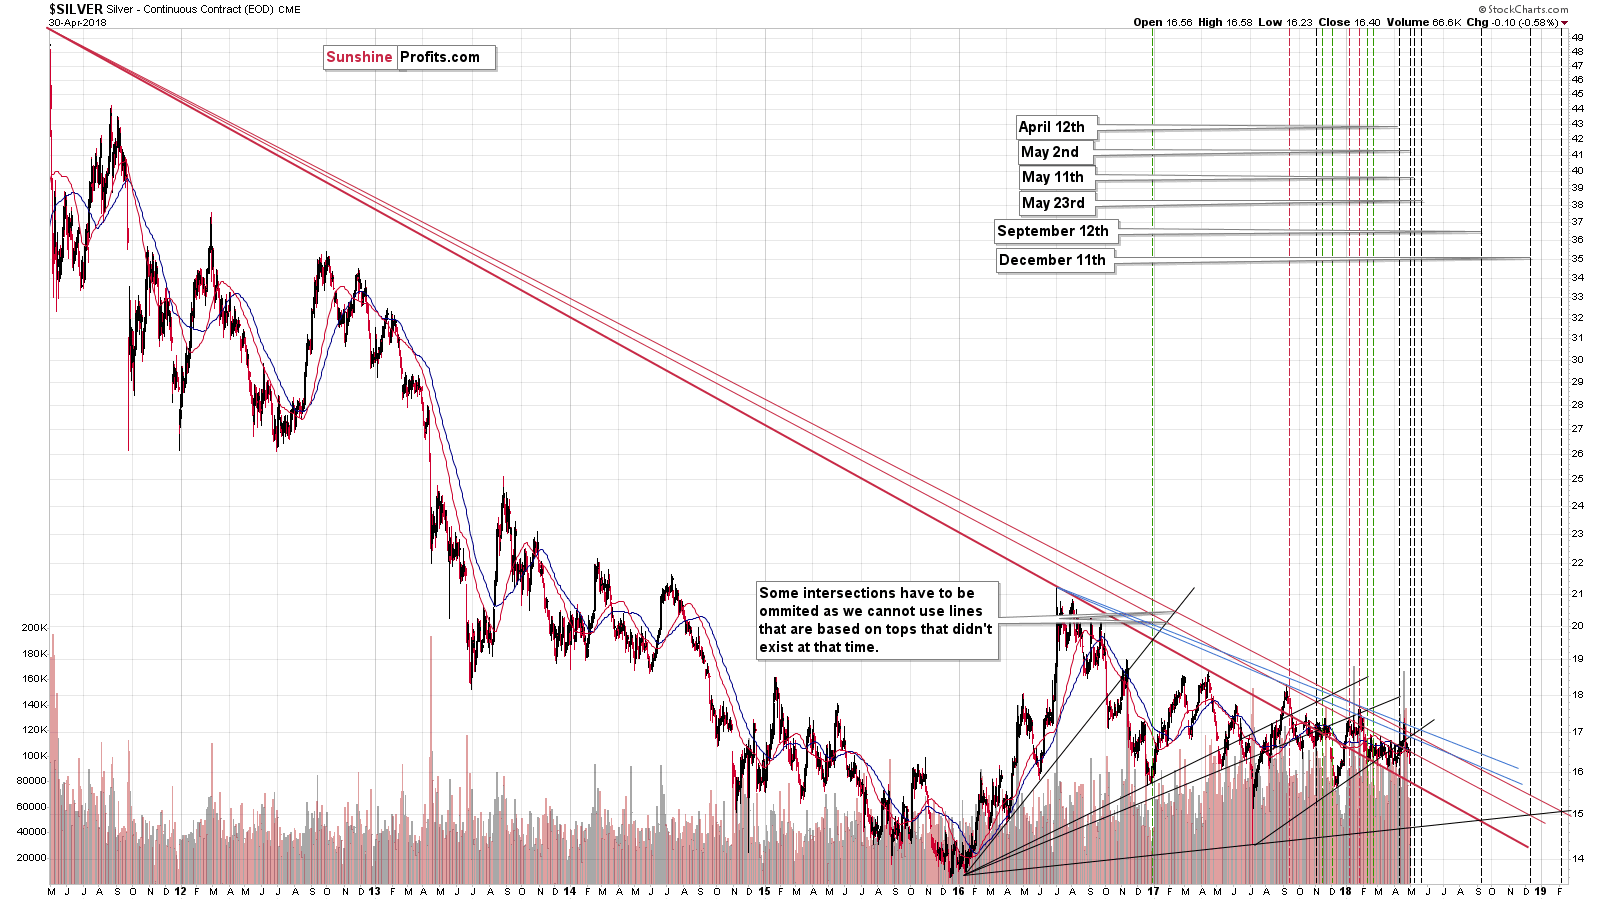
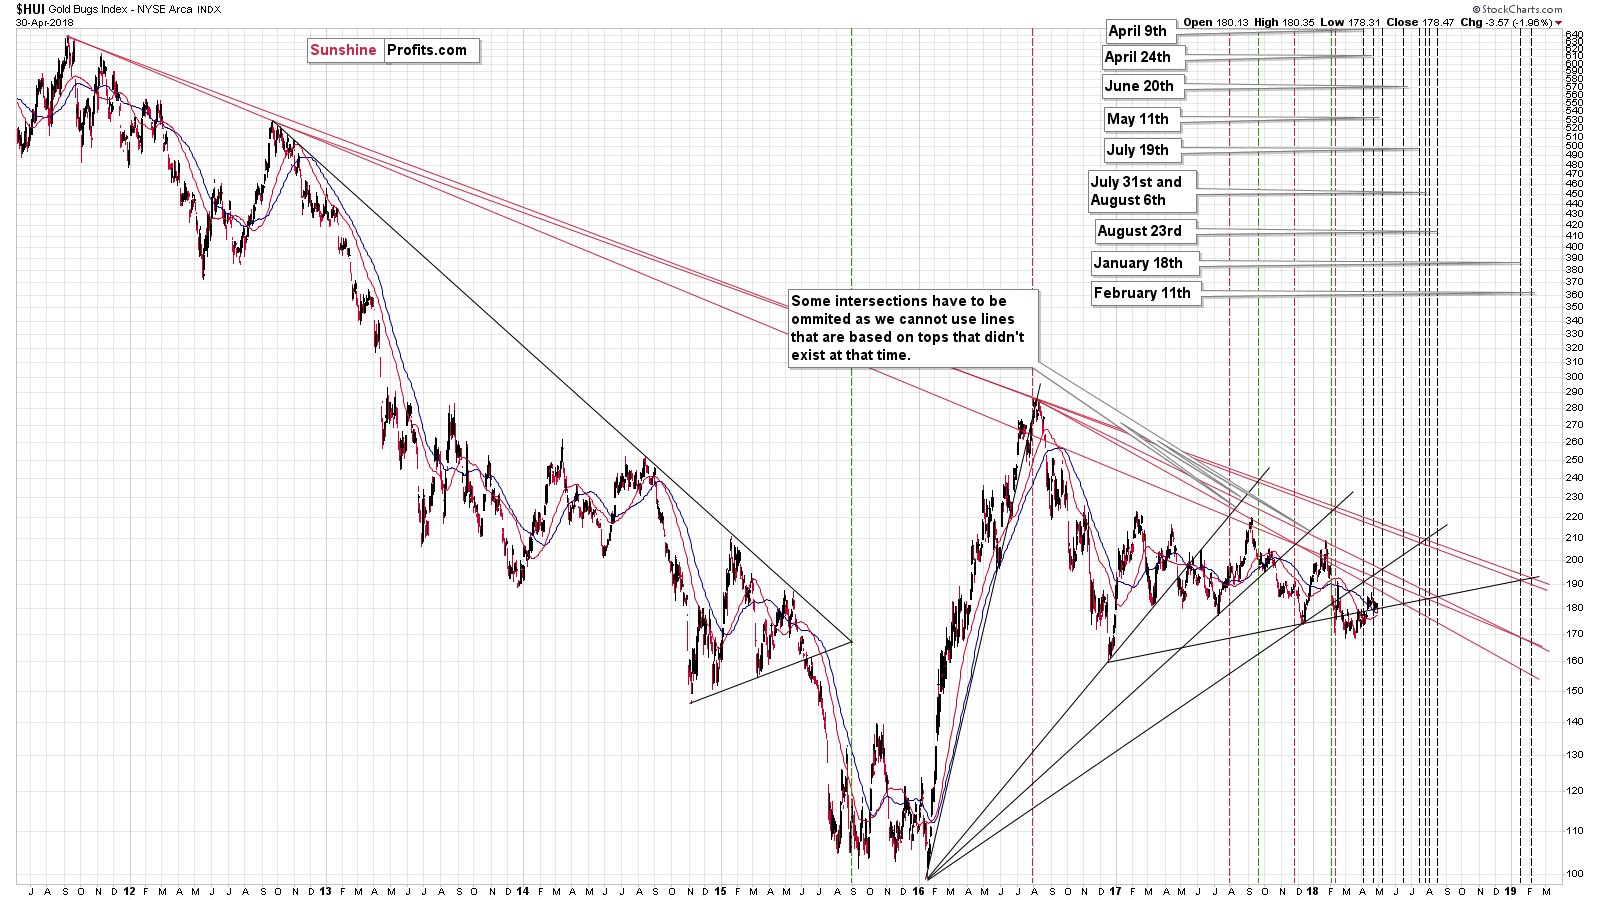
The long-term triangles have apexes on May 14th (gold), May 11th (silver), and May 11th (HUI Index), which is a near-perfect confirmation of what we saw on the above True Seasonal charts.
The apex-based reversals proved their usefulness multiple times and since we’re seeing all three of them pointing to almost the same reversal day (May 11th is Friday, so it’s just before Monday, May 14th, in trading day terms), the likelihood of seeing a major reversal on this date or close to it (give or take 3 days or so).
Naturally, the reversal could also be a bullish one if the PM sector declines for the next two weeks, but…
The additional signal here is that silver’s nearest apex-based reversal date is today. The most recent move was definitely down, so the implications are bullish for the following days.
Silver reversed just as we indicated yesterday and the outlook for approximately the next two weeks is bullish.
Summary
Summing up, the situation in the USD Index and the Euro Index suggests that we’re seeing the beginning of a corrective downswing and the opposite seems to be the case in the case of the precious metals market. The important thing is that this is most likely not a new medium-term upswing, but rather a short-term, two-week-long move.
As always, we will keep you – our subscribers – informed.
To summarize:
Trading capital (supplementary part of the portfolio; our opinion): Full long positions (150% of the full position) in gold, silver and mining stocks are justified from the risk/reward perspective with the following stop-loss orders and initial target price levels:
- Gold: initial target price: $1,338; stop-loss: $1,272; initial target price for the UGLD ETN: $11.68; stop-loss for the UGLD ETN $9.88
- Silver: initial target price: $16.86; stop-loss: $15.49; initial target price for the USLV ETN: $10.68; stop-loss for the USLV ETN $7.88
- Mining stocks (price levels for the GDX ETF): initial target price: $23.18; stop-loss: $21.47; initial target price for the NUGT ETF: $28.38; stop-loss for the NUGT ETF $22.88
In case one wants to bet on junior mining stocks' prices (we do not suggest doing so – we think senior mining stocks are more predictable in the case of short-term trades – if one wants to do it anyway, we provide the details), here are the stop-loss details and initial target prices:
- GDXJ ETF: initial target price: $33.93; stop-loss: $31.38
- JNUG ETF: initial target price: $15.68 stop-loss: $11.88
The stop-loss levels are quite far from the current price, but please note that the aim of the stop-loss is to take the investor off the market if the price move by its own is so meaningful that it changes the outlook. Naturally, if things go against us, we will aim to get out of the market much sooner – for instance based on signals from volume or other tools.
Long-term capital (core part of the portfolio; our opinion): No positions (in other words: cash)
Insurance capital (core part of the portfolio; our opinion): Full position
Important Details for New Subscribers
Whether you already subscribed or not, we encourage you to find out how to make the most of our alerts and read our replies to the most common alert-and-gold-trading-related-questions.
Please note that the in the trading section we describe the situation for the day that the alert is posted. In other words, it we are writing about a speculative position, it means that it is up-to-date on the day it was posted. We are also featuring the initial target prices, so that you can decide whether keeping a position on a given day is something that is in tune with your approach (some moves are too small for medium-term traders and some might appear too big for day-traders).
Plus, you might want to read why our stop-loss orders are usually relatively far from the current price.
Please note that a full position doesn’t mean using all of the capital for a given trade. You will find details on our thoughts on gold portfolio structuring in the Key Insights section on our website.
As a reminder – “initial target price” means exactly that – an “initial” one, it’s not a price level at which we suggest closing positions. If this becomes the case (like it did in the previous trade) we will refer to these levels as levels of exit orders (exactly as we’ve done previously). Stop-loss levels, however, are naturally not “initial”, but something that, in our opinion, might be entered as an order.
Since it is impossible to synchronize target prices and stop-loss levels for all the ETFs and ETNs with the main markets that we provide these levels for (gold, silver and mining stocks – the GDX ETF), the stop-loss levels and target prices for other ETNs and ETF (among other: UGLD, DGLD, USLV, DSLV, NUGT, DUST, JNUG, JDST) are provided as supplementary, and not as “final”. This means that if a stop-loss or a target level is reached for any of the “additional instruments” (DGLD for instance), but not for the “main instrument” (gold in this case), we will view positions in both gold and DGLD as still open and the stop-loss for DGLD would have to be moved lower. On the other hand, if gold moves to a stop-loss level but DGLD doesn’t, then we will view both positions (in gold and DGLD) as closed. In other words, since it’s not possible to be 100% certain that each related instrument moves to a given level when the underlying instrument does, we can’t provide levels that would be binding. The levels that we do provide are our best estimate of the levels that will correspond to the levels in the underlying assets, but it will be the underlying assets that one will need to focus on regarding the signs pointing to closing a given position or keeping it open. We might adjust the levels in the “additional instruments” without adjusting the levels in the “main instruments”, which will simply mean that we have improved our estimation of these levels, not that we changed our outlook on the markets. We are already working on a tool that would update these levels on a daily basis for the most popular ETFs, ETNs and individual mining stocks.
Our preferred ways to invest in and to trade gold along with the reasoning can be found in the how to buy gold section. Additionally, our preferred ETFs and ETNs can be found in our Gold & Silver ETF Ranking.
As a reminder, Gold & Silver Trading Alerts are posted before or on each trading day (we usually post them before the opening bell, but we don't promise doing that each day). If there's anything urgent, we will send you an additional small alert before posting the main one.
=====
Hand-picked precious-metals-related links:
PRECIOUS-Gold claws back from 4-month low; investors await Fed
Goldman says case for owning commodities has 'rarely been stronger' than it is now
Perth Mint's April gold sales halve m/m, silver sales dive
=====
In other news:
Dollar consolidates gains after break above key level; Fed eyed
Global Market Volatility Now a ‘Made in the U.S.A.’ Phenomenon
Ghosts of tantrums past trigger first emerging market outflows since 2016: IIF
=====
Thank you.
Sincerely,
Przemyslaw Radomski, CFA
Founder, Editor-in-chief, Gold & Silver Fund Manager
Gold & Silver Trading Alerts
Forex Trading Alerts
Oil Investment Updates
Oil Trading Alerts

