
Based on the November 19th, 2013 Oil Investment Update
In our previous essay, we examined one of the most interesting relationships in the crude oil market – the one between oil stocks and other stocks, to find out if there's something else on the horizon that could drive oil stocks higher or lower in the near future. Back then, we wrote that there were periods of time when the S&P 500 Index was stronger than the oil stock index and that such divergences had triggered declines in both indices before.
Since that essay was published, we’ve seen similar price action. In the previous week, the S&P500 index broke above the previous high and hit a fresh all-time high. Meanwhile, although the XOI moved higher, the move ended slightly below the 2013 high.
Nevertheless, on Monday we saw further improvement and both indices hit their new 2013 highs. However, after that they declined. Will we see further deterioration? Before we try to answer this question, we’ll examine the NYSE Arca Oil Index (XOI) to find out what the current outlook for oil stocks is.
Let’s start with a look at the monthly chart of the oil stock index (charts courtesy by http://stockcharts.com).
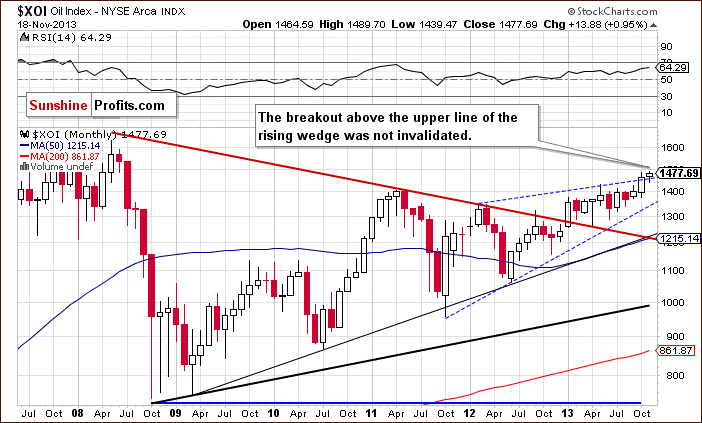
On the above chart, we see that the situation has improved recently and the XOI still remains above the upper line of the rising wedge.
Quoting our essay on oil stocks and crude oil from Oct. 30, 2013:
The breakout, however, is not yet confirmed. (…) in this area there’s a very important Fibonacci retracement level - 78.6% (close to 1,467) based on the entire May-October 2008 decline, which may slow the rally. However, if the buyers don’t give up and manage to push the oil stock index above this resistance, we will likely see further growth.
Looking at the above chart, we see that the breakout above the 78.6% retracement level encouraged buyers to act and resulted in a new 2013 high at 1,489. From this point of view, the situation is very bullish.
To see the current situation more clearly, let’s zoom in on our picture and move on to the weekly chart.
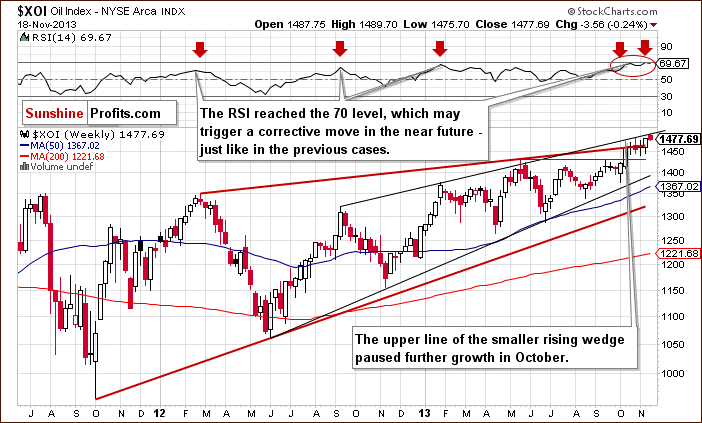
Looking at the above chart, we see that the oil stock index bounced off the bottom of the recent corrective move in the previous week, which resulted in a sharp pullback. With this upward move, the XOI came back to slightly below the October high. On Monday, we saw further improvement and the oil stock index climbed to a fresh 2013 high at 1,489.
In spite of this growth, the breakout above the previous high is not confirmed.
Please note that the upper line of the smaller rising wedge (marked with the black line), which successfully stopped growth at the end of October, is still in play. As you can see on the weekly chart, the XOI remains below this line, which serves as resistance (currently around 1,495). Additionally, the RSI moved above the 70 level, which may trigger a corrective move in the near future – similarly to what we saw in the previous months.
Nevertheless, from the technical point of view, the medium-term uptrend is not threatened at the moment, and the situation remains bullish.
Now, let’s turn to the daily chart.
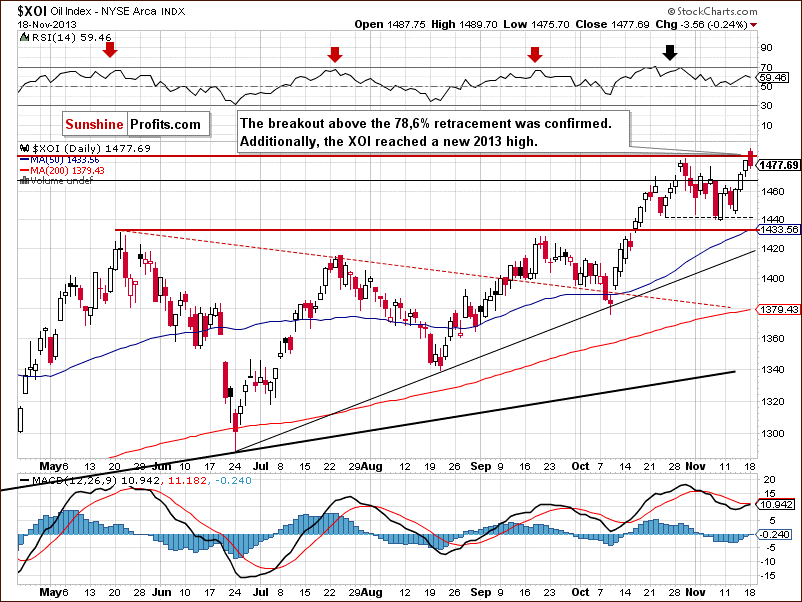
Looking at the above chart, we see that the oil stock index didn’t manage to break above the 78.6% retracement at the beginning of the previous week, which resulted in a decline in the following days. As you see on the daily chart, this downward move took the XOI to slightly above the bottom of the recent corrective move. On Wednesday, this support level encouraged buyers to act, which resulted in a pullback. In this way, the oil stock index broke above the 78.6% Fibonacci retracement level and almost reached the 2013 high on Friday.
On Monday, we saw further improvement, and the XOI hit a new annual high at 1,489. However, after this positive event, we saw a correction which pushed the oil stock index slightly below the previously-broken high. In spite of this drop, the breakout above the 78.6% retracement level was confirmed, which is a strong bullish sign.
Summing up, from the long-, medium- and short-term perspectives, the outlook for oil stocks remains bullish and the uptrend is not threatened at the moment. However, taking into account the combination of a strong resistance level (the upper line of the rising wedge) and the position of the RSI, we should keep an eye on the oil stock index because the sellers may lock profits and trigger another correction in the coming days.
Please note that at this time we still have a promotional offer that allows you to subscribe to my Oil Investment Updates and Oil Trading Alerts for only $1 and $2, respectively, for the first 3 weeks of service. I encourage you to subscribe today.
Thank you.
Nadia Simmons
Sunshine Profits' Crude Oil Expert
Oil Investment Updates
Oil Trading Alerts
