

The Dow Jones hit 20,000 for the first time ever. What does it imply for the yellow metal?
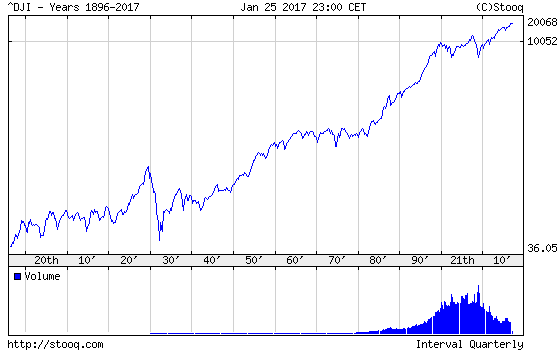
Yesterday, the Dow Jones Industrial Average broke above the symbolic 20,000 for the first time in history, as one can see in the chart below.
Chart 1: The Dow Jones Industrial Average from 1896 to 2017.
The return of risk to the markets was negative for the gold market. The yellow metal fell from $1,209 to $1,201 yesterday, as the second chart shows.
Chart 2: The price of gold over the last three days (the red line paints the behavior since January 25).
The decrease may indicate that the current rally in gold prices has ended, at least for a while. This is what we warned against over the last few days. For example, on Monday we wrote: “Investors should be cautious. There is a significant risk that once the new administration provides details of concrete economic policies, the pro-growth sentiment will come back to markets. Gold may take a hit then”. This is precisely what is happening right now. The new administration quickly began to implement its policies in order to fulfill Trump’s promises made during the presidential campaign. Yes, we know, some of these steps are unreasonable and detrimental to the economic growth. But it’s not the point. You see, markets just love clarity. The more Trump provides, the less uncertainty remains in the market. Therefore, the U.S. stock market has potential for further rises. This is bad news for gold, the ultimate safe-haven asset, which shines during elevated risk-aversion, but suffers in times of low uncertainty.
Surely, the relationship between the Dow Jones and the price of gold is far from being simple. However, since the U.S. presidential election in November 2016, there has been a clear negative correlation between these two variables, as one can see in the chart below.
Chart 3: The Dow Jones Industrial Average (blue line, left axis) and the price of gold (red line, right axis, London P.M. Fix) over the last year.
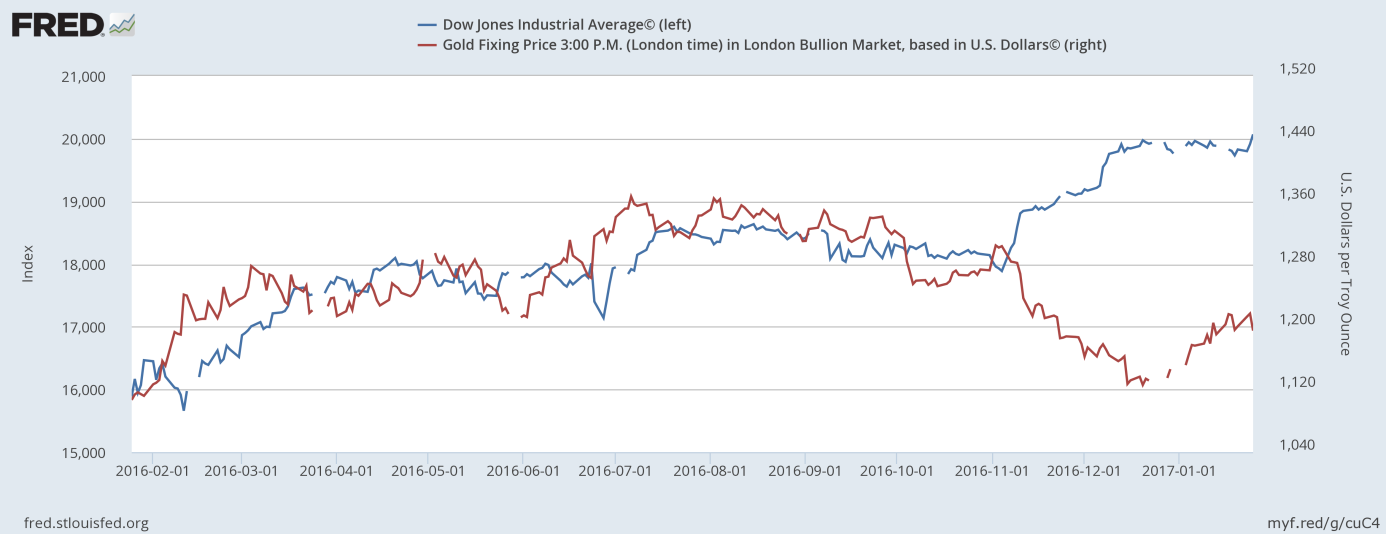
Hence, the chart indicates that further increases in equities should be negative for gold prices. It’s too early to trump the end of the gold rally with one hundred percent certainty, but be warned!
If you enjoyed the above analysis, we invite you to check out our other services. We focus on fundamental analysis in our monthly Market Overview reports and we provide daily Gold & Silver Trading Alerts with clear buy and sell signals. If you’re not ready to subscribe yet and are not on our mailing list yet, we urge you to join our gold newsletter today. It’s free and if you don’t like it, you can easily unsubscribe.
Disclaimer: Please note that the aim of the above analysis is to discuss the likely long-term impact of the featured phenomenon on the price of gold and this analysis does not indicate (nor does it aim to do so) whether gold is likely to move higher or lower in the short- or medium term. In order to determine the latter, many additional factors need to be considered (i.e. sentiment, chart patterns, cycles, indicators, ratios, self-similar patterns and more) and we are taking them into account (and discussing the short- and medium-term outlook) in our trading alerts.
Thank you.
Arkadiusz Sieron
Sunshine Profits‘ Gold News Monitor and Market Overview Editor
Gold News Monitor
Gold Trading Alerts
Gold Market Overview
