

Briefly:
Intraday trade: Our Friday's neutral intraday outlook has proved accurate. The S&P 500 index fluctuated within a relatively narrow trading range, following Thursday's sell-off. Thursday's short intraday trade has also proved accurate. The market reached our profit target level of 2,450 and continued lower on Thursday. The S&P 500 index may fluctuate or rebound today, following last week's sell-off. Therefore, we prefer to be out of the market today, avoiding low risk/reward ratio trades.
Our intraday outlook is neutral, and our short-term outlook is bearish, as we expect downward correction. Our medium-term outlook is bearish:
Intraday outlook (next 24 hours): neutral
Short-term outlook (next 1-2 weeks): bearish
Medium-term outlook (next 1-3 months): bearish
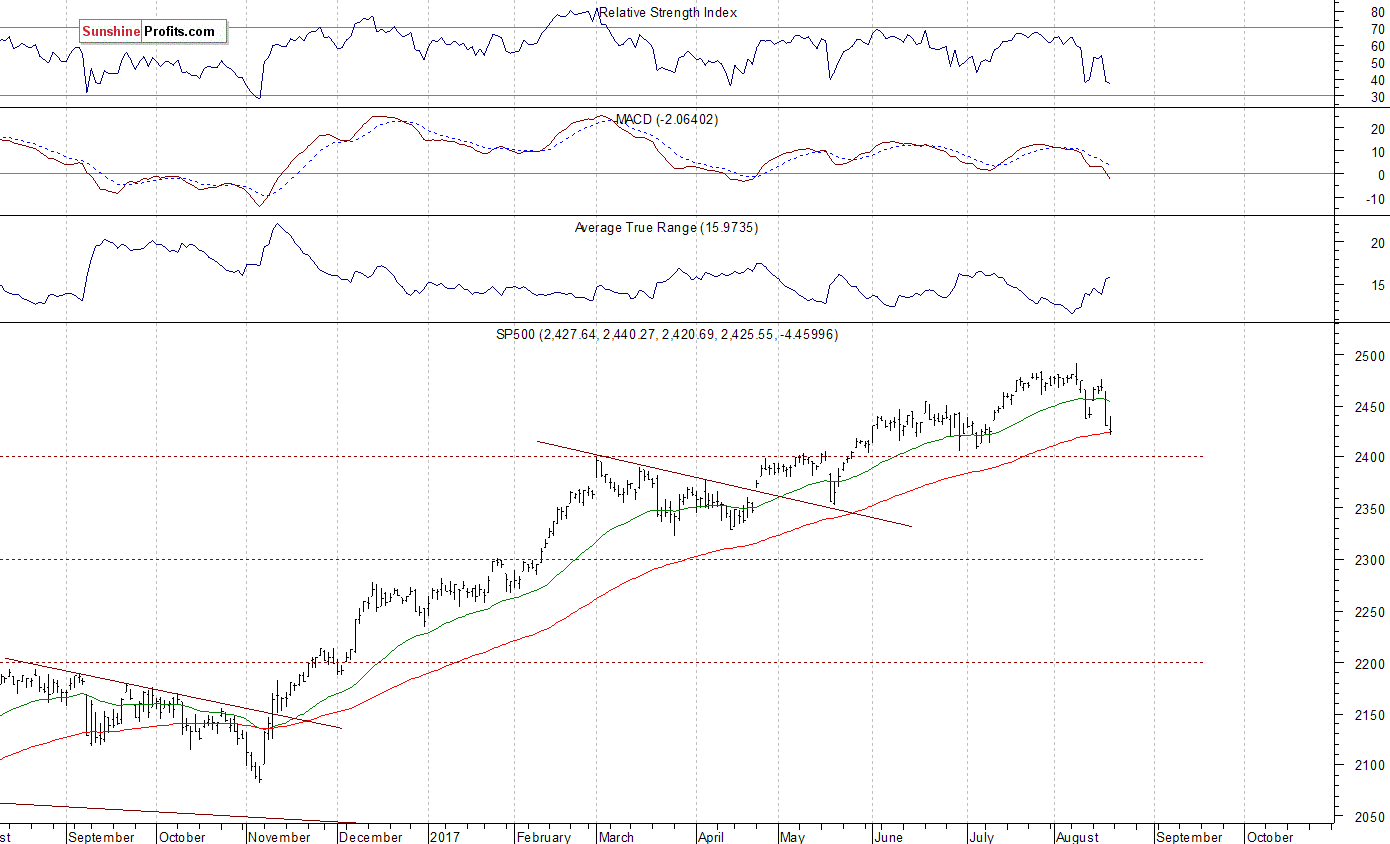
The U.S. stock market indexes lost between 0.1% and 0.4% on Friday, as investors hesitated following Thursday's sell-off. The S&P 500 index extended its short-term downtrend off the August 8 all-time high at 2,490.87. It is now trading 2.6% below that record high. Will the downtrend continue? Or is this just quick downward correction before another leg up? The Dow Jones Industrial Average trades below the level of 21,700, and the technology Nasdaq Composite fell close to 6,200 mark, following a rebound off new record high level at 6,460.8. The nearest important level of resistance of the S&P 500 index is now at around 2,435-2,440, marked by recent local lows. The next resistance level is at 2,450, marked by previous level of support. The resistance level is also at 2,465-2,475, marked by previous support level and local highs. On the other hand, support level is at around 2,400-2,420, marked by some previous local lows, among others. The market extended its downward correction following April - August uptrend. There have been no confirmed negative signals so far. Will this short-term downtrend continue? We still can see negative technical divergences:
Will Stocks Rebound?
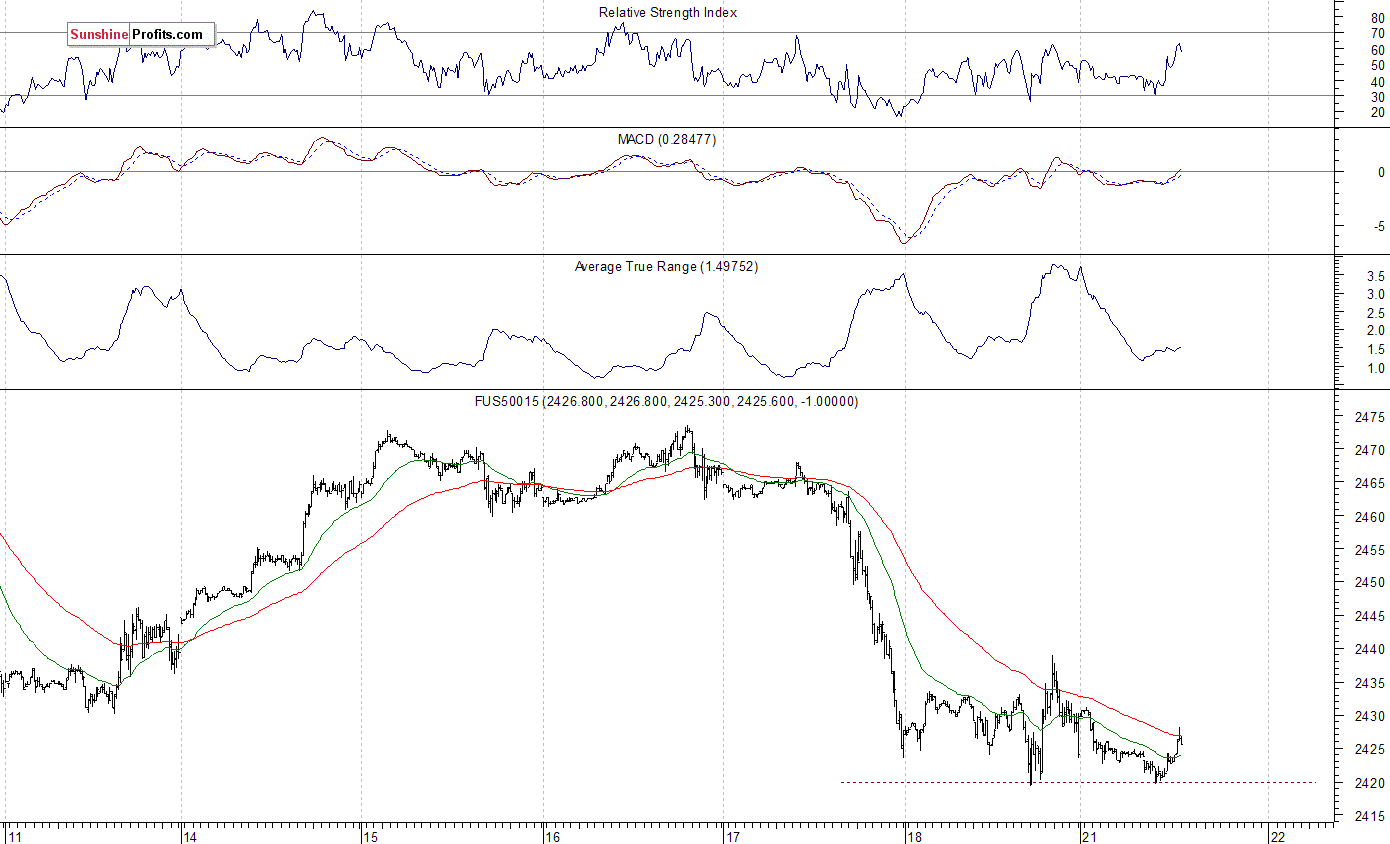
Expectations before the opening of today's trading session are virtually flat, with index futures currently between -0.1% and 0.0% vs. their Friday's closing prices. The European stock market indexes have been mixed so far. There will be no new important economic data announcements today. The S&P 500 futures contract trades within an intraday consolidation, as it extends Friday's fluctuations along the level of 2,420. The nearest important level of support is at around 2,415-2,420, marked by local lows. On the other hand, resistance level remains at around 2,440, marked by an overnight local high. Is this a bottoming pattern before upward reversal or just relatively flat correction within a downtrend? The futures contract fluctuates following Friday's sell-off, as we can see on the 15-minute chart:
Nasdaq Fluctuates
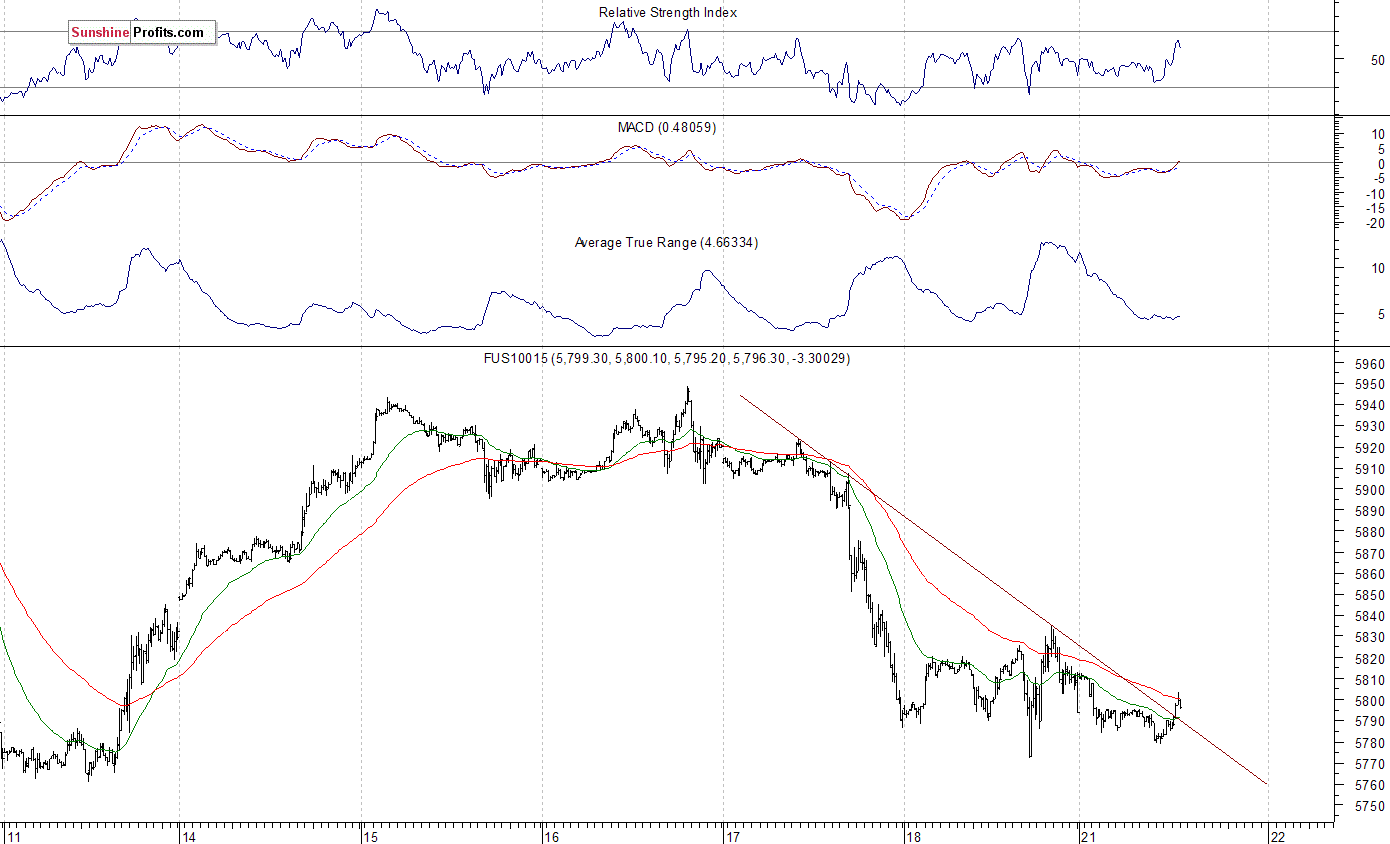
The technology Nasdaq 100 futures contract trades within a similar intraday consolidation, as it bounces after an overnight decline. The nearest important level of support is at around 5,770-5,780, marked by local lows. On the other hand, resistance level is at 5,820-5,850. The next level of resistance is at 5,900. There have been no confirmed positive signals so far. However, we can see some short-term oversold conditions:
Concluding, the S&P 500 index slightly extended its short-term downtrend on Friday, as it got close to late June - early July local lows along the level of 2,400-2,420. Will it continue lower? Or is this just downward correction? There have been no confirmed positive signals so far. We still can see medium-term overbought conditions along with negative technical divergences.
If you enjoyed the above analysis and would like to receive free follow-ups, we encourage you to sign up for our daily newsletter – it’s free and if you don’t like it, you can unsubscribe with just 2 clicks. If you sign up today, you’ll also get 7 days of free access to our premium daily Gold & Silver Trading Alerts. Sign up today!.
Thank you.
Paul Rejczak
Stock Trading Strategist
Stock Trading Alerts
