

Forex Trading Alert originally sent to subscribers on December 1, 2015, 9:33 AM.
Earlier this week, The Reserve Bank of Australia kept its benchmark cash rate at 2%, which supported the Australian dollar. As a result, AUD/USD bounced off the previously-broken long-term line, verifying the breakout. How high could the pair go?
In our opinion the following forex trading positions are justified - summary:
EUR/USD
Yesterday, we wrote the following:
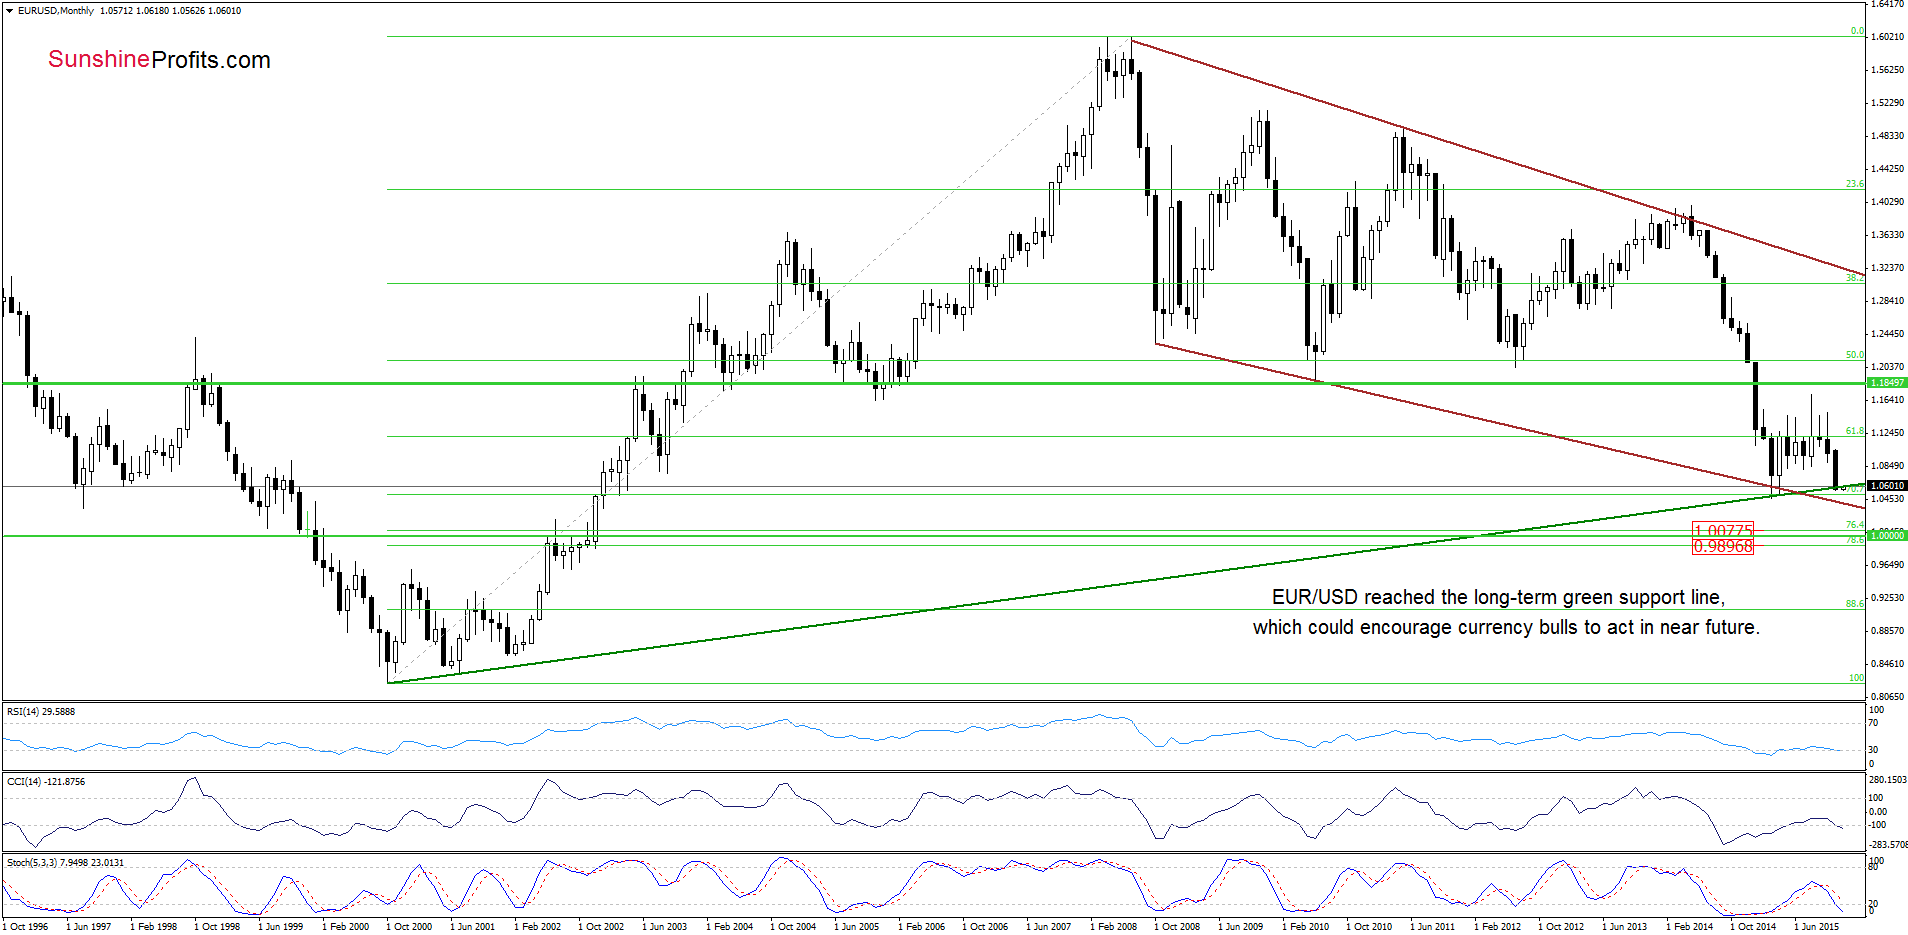
(…) the exchange rate declined to our next downside target earlier today. With this downward move, EUR/USD also reached the long-term green support line (….) this important support line was strong enough to stop further declines in March, which suggests that we may see a similar price action in the coming day(s).
On top of that, the current situation in USD Index increases the probability of a reversal. (…) the USD Index reached the red resistance zone on Friday (earlier today, the index almost touched the March high) and approached another cyclical turning point, which suggests that reversal is just around the corner. Additionally, the Stochastic Oscillator generated a sell signal and there are negative divergences between the RSI, CCI and the index, which could encourage currency bears to act in near future.
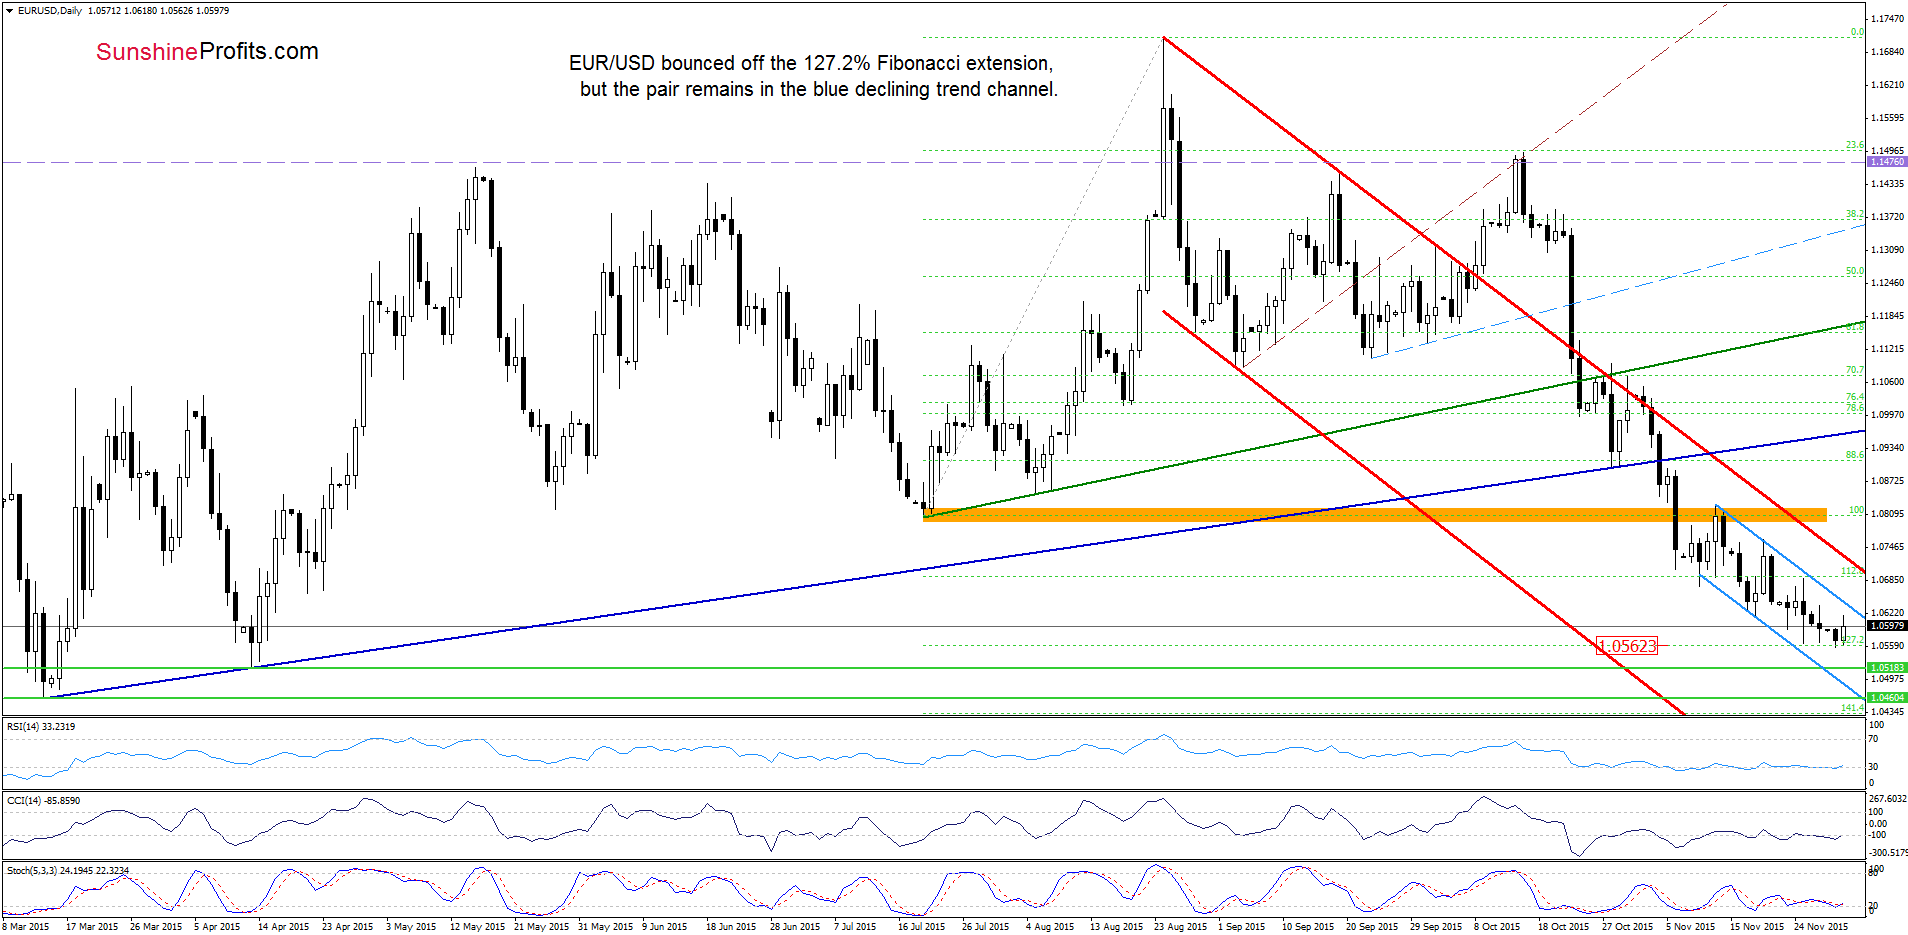
Looking at the above charts, we see that all the above-mentioned factors encouraged currency bulls to act (as we had expected), which resulted in a rebound earlier today. Despite this small move (it is tiny compared to the size of earlier declines), the pair remains in the blue declining trend channel, which means that as long as there is no breakout above the upper border of the formation sizable upward move is not likely to be seen and another test of the 127.2% Fibonacci extension can’t be ruled out.
Very short-term outlook: mixed
Short-term outlook: mixed
MT outlook: mixed
LT outlook: mixed
Trading position (short-term; our opinion): No positions are justified from the risk/reward perspective at the moment. We will keep you informed should anything change, or should we see a confirmation/invalidation of the above.
USD/JPY
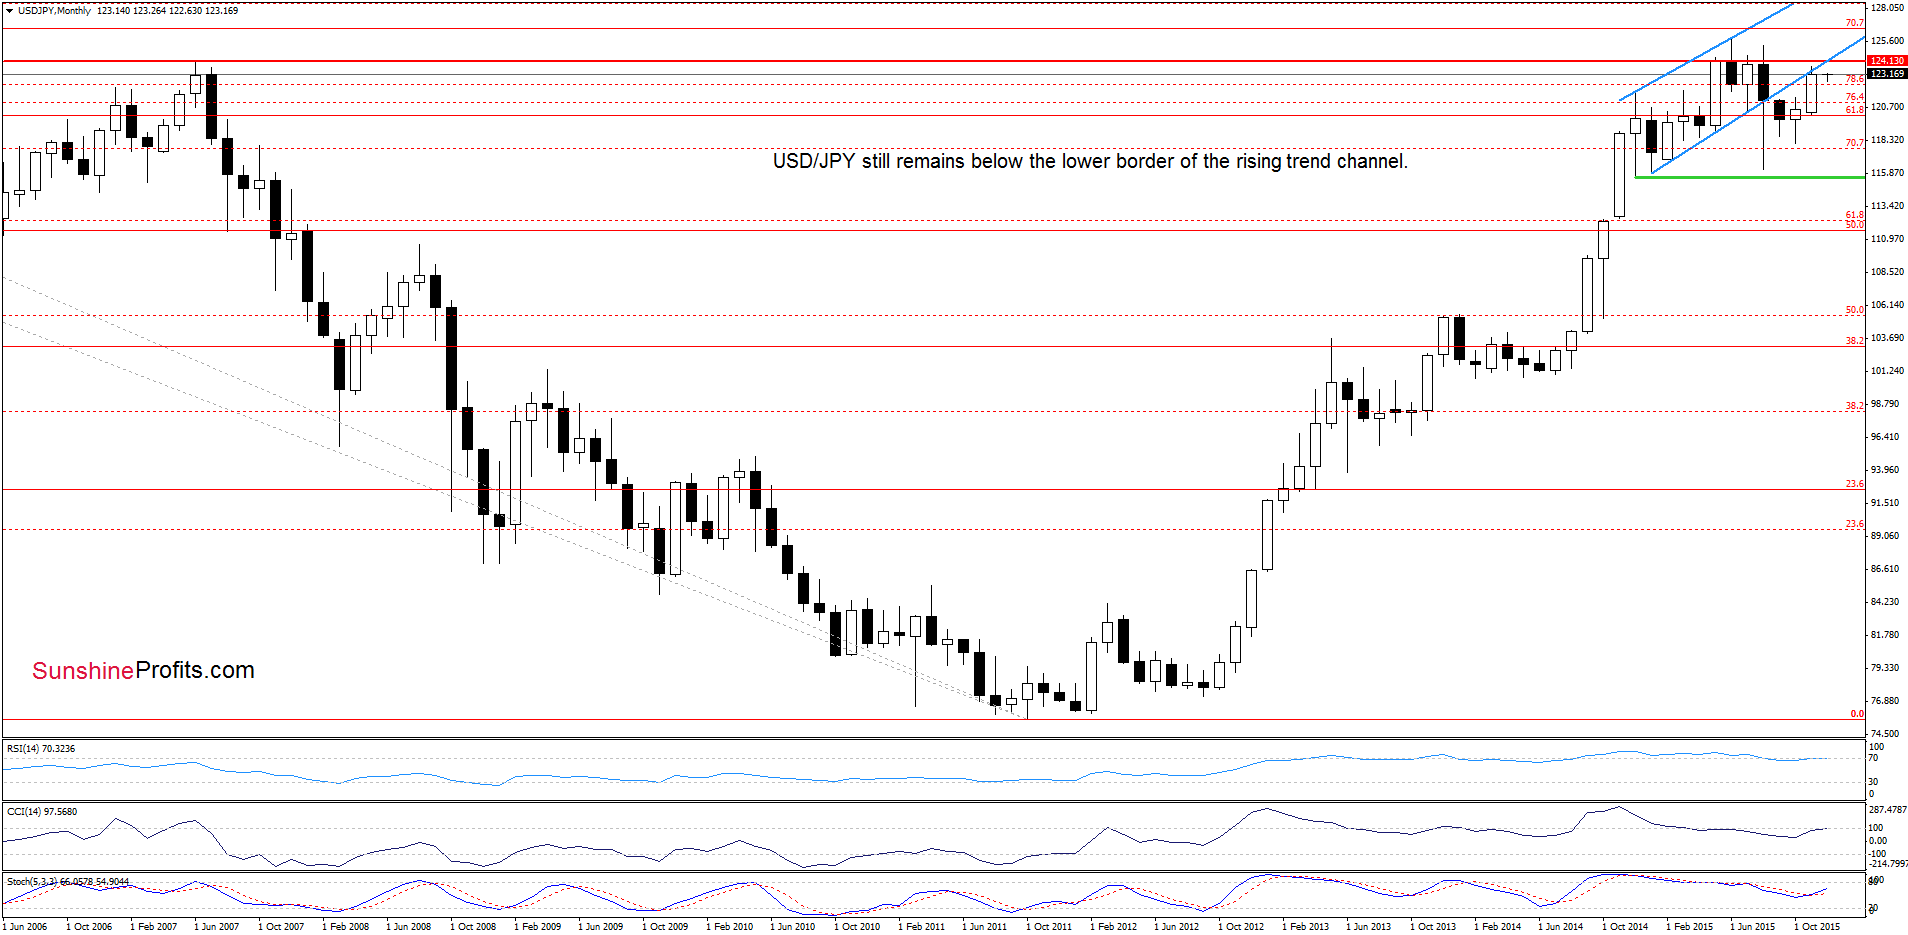
On the above chart, we see that USD/JPY is still trading under the lower border of the blue rising trend channel, which means that as long as there is no comeback above this key resistance line a sizable upward move is not likely to be seen and another downswing is likely.
Will the very short-term chart confirm this pro bearish scenario? Let’s check.
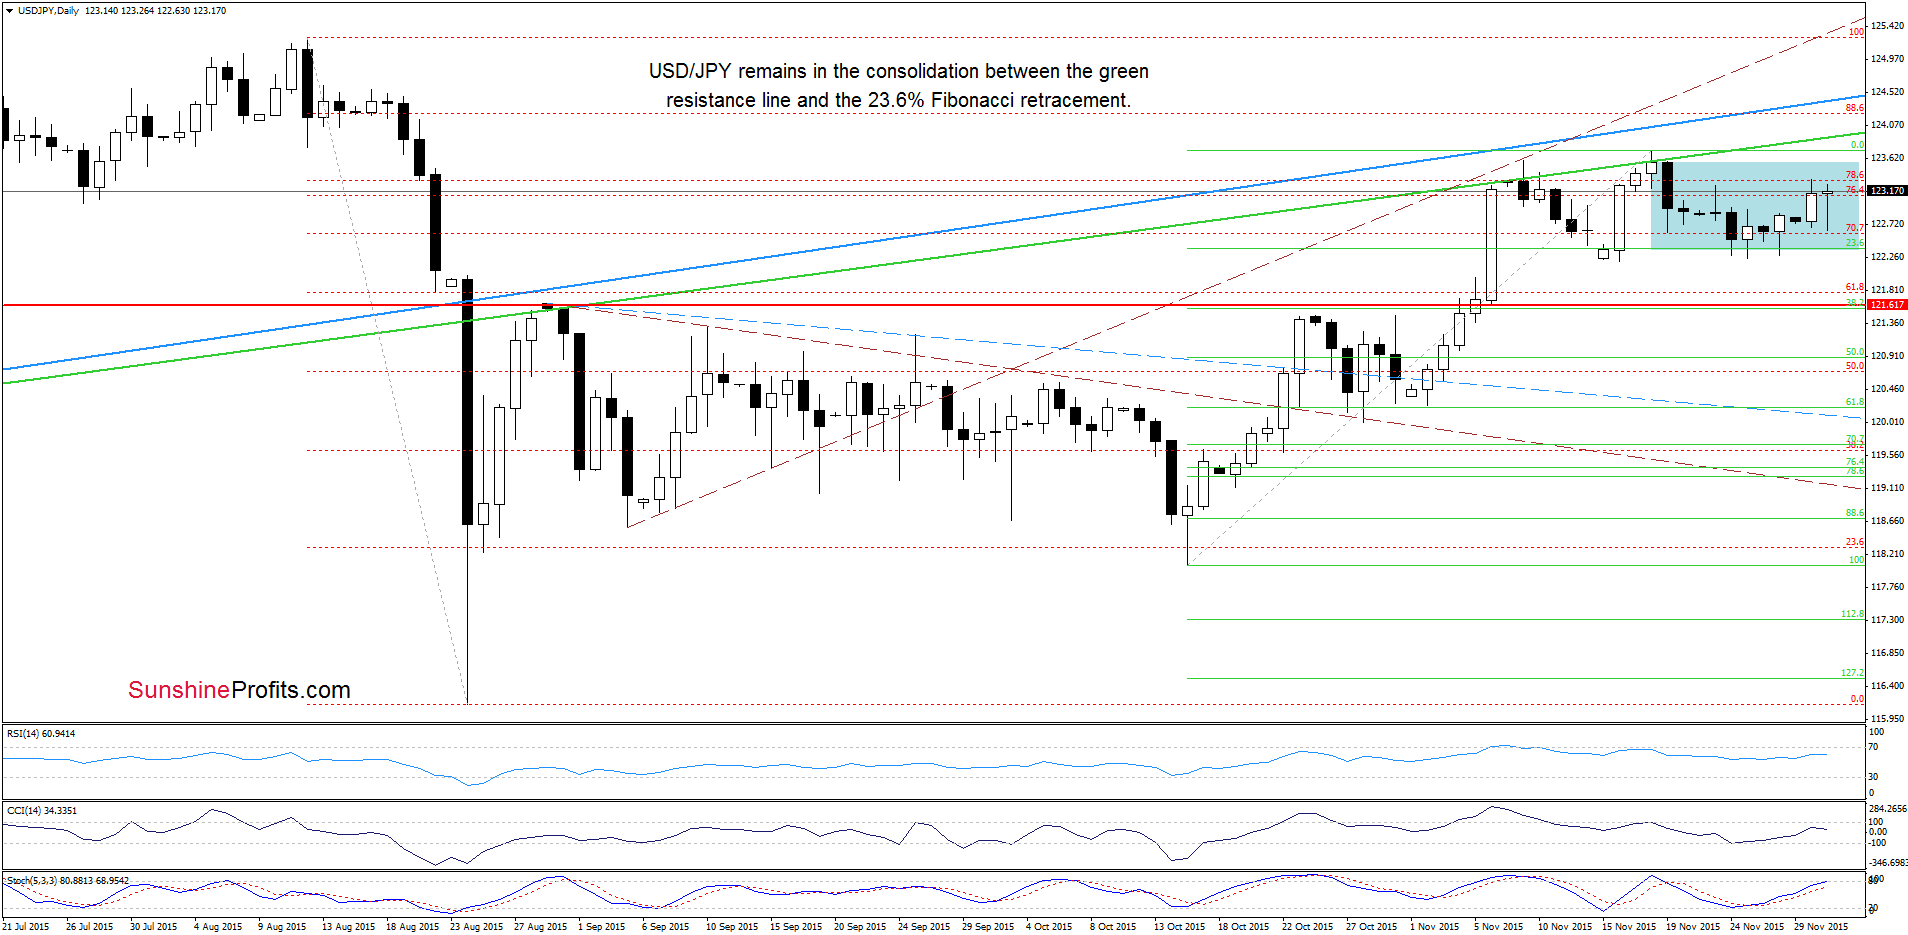
From this perspective we see the very short-term picture hasn’t changed much since our last commentary was posted as USD/JPY is consolidating between the green resistance line and the 23.6% Fibonacci retracement, which makes the situation a bit unclear. Nevertheless, taking into account the broader perspective, the current position of the indicators and the fact that two previous attempts to break above the green line failed, we think that the next move will be to the downside. However, further deterioration will be more likely if we see a breakdown under the recent lows. If we see such price action and the pair extends losses the initial downside target would be around 121.61, where the red horizontal support line based on the Aug high is.
Very short-term outlook: mixed with bearish bias
Short-term outlook: mixed
MT outlook: mixed
LT outlook: mixed
Trading position (short-term; our opinion): No positions are justified from the risk/reward perspective at the moment. We will keep you informed should anything change, or should we see a confirmation/invalidation of the above.
AUD/USD
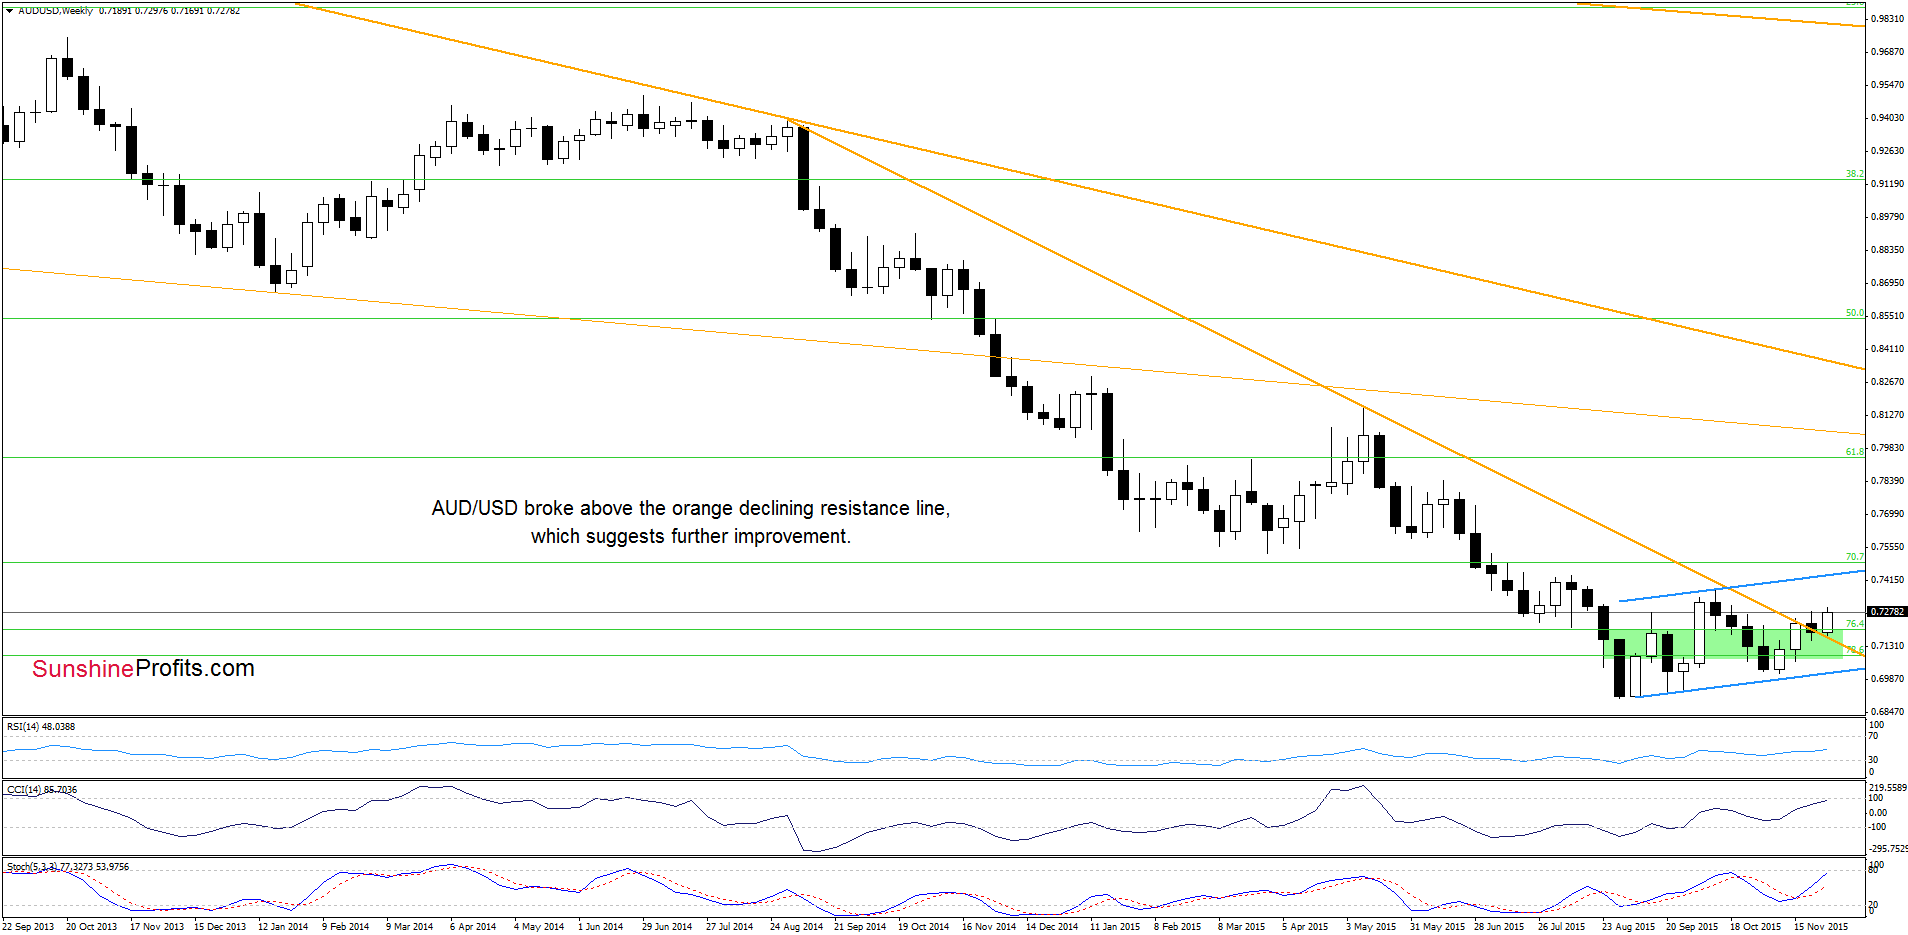
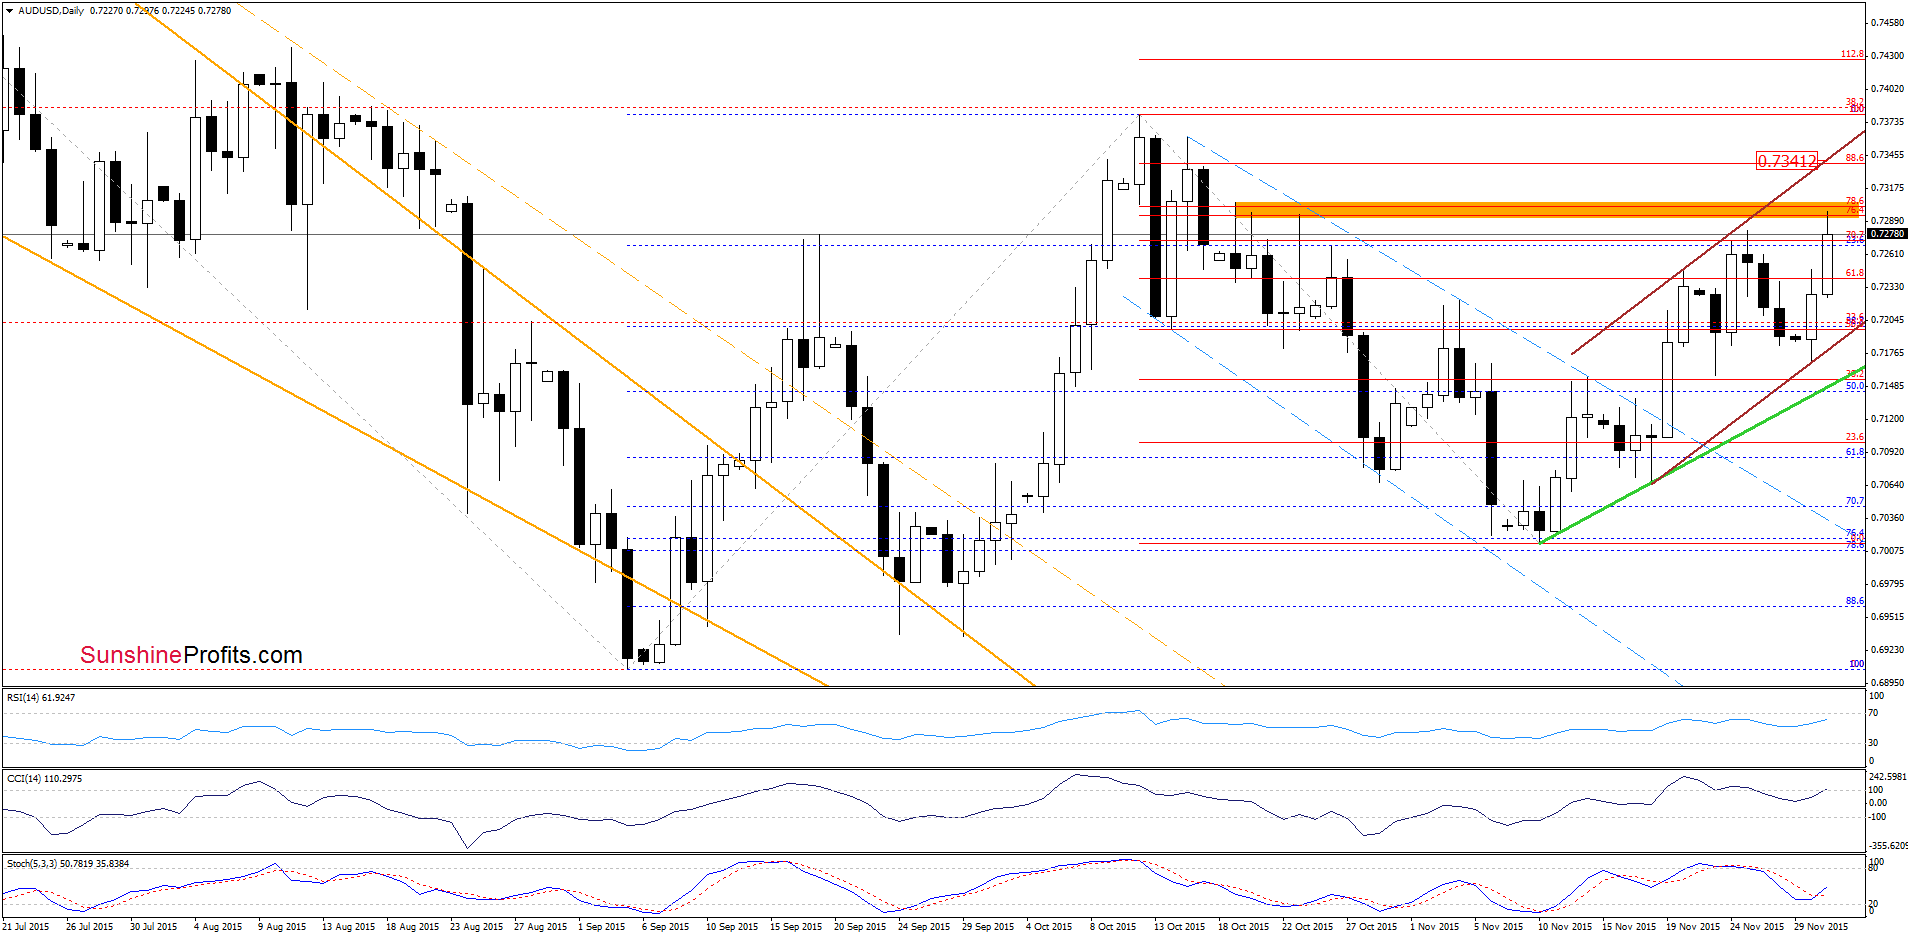
Looking at the above charts, we see that although AUD/USD moved lower earlier this week, the previously-broken long-term orange declining line (marked on the weekly chart) stopped further deterioration, triggering a sharp rebound. This suggests that the exchange rate verified earlier breakout, which is a positive signal. Nevertheless, in our opinion further rally will be more likely if the pair breaks above the orange resistance zone (created by the Fibonacci retracements, the Oct 19, Oct 20 and Oct 23 highs). If we see such price action, the next target for currency bulls would be the Oct high of 0.7380.
Very short-term outlook: mixed with bullish bias
Short-term outlook: mixed
MT outlook: mixed
LT outlook: mixed
Trading position (short-term; our opinion): No positions are justified from the risk/reward perspective at the moment. We will keep you informed should anything change, or should we see a confirmation/invalidation of the above.
Thank you.
Nadia Simmons
Forex & Oil Trading Strategist
Przemyslaw Radomski, CFA
Founder, Editor-in-chief
Gold & Silver Trading Alerts
Forex Trading Alerts
Oil Investment Updates
Oil Trading Alerts
