

Forex Trading Alert originally sent to subscribers on September 1, 2015, 10:11 AM.
Earlier today, official data showed that Chinese manufacturing PMI dropped to 49.7 in the previous month, which was the lowest reading since August 2012. As a result, investors’ appetite for riskier assets waned, pushing the USD Index lower. In this environment, USD/CAD slipped to the lower border of the consolidation, but will we see a breakdown in the coming days?
In our opinion the following forex trading positions are justified - summary:
- EUR/USD: short (a stop-loss order at 1.1445; the downside target around 1.0938)
- GBP/USD: none
- USD/JPY: none
- USD/CAD: none
- USD/CHF: none
- AUD/USD: none
EUR/USD
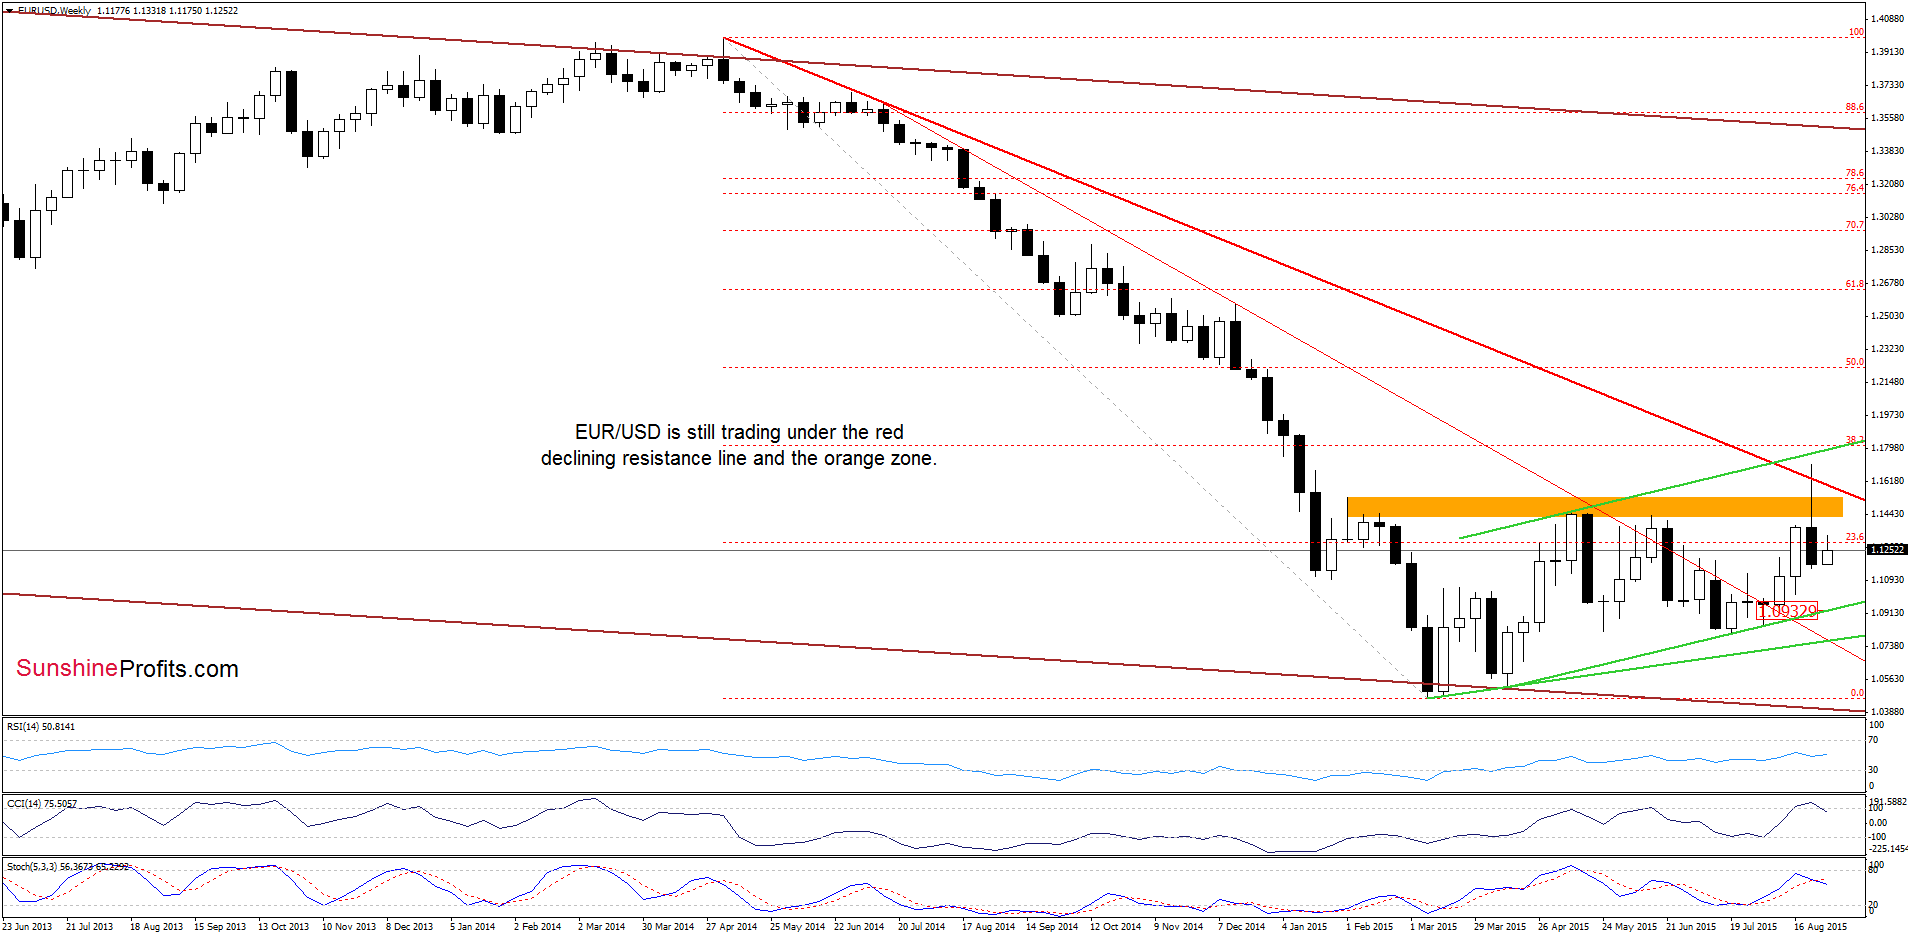
From the medium-term perspective we see that although EUR/USD moved slightly higher, the exchange rate is still trading well below the long-term red line and the previously-broken orange resistance zone, which suggests lower values of the exchange rate in the coming week (especially when we factor in sell signals generated by the indicators).
Having said that, let’s focus on the very short-term picture.
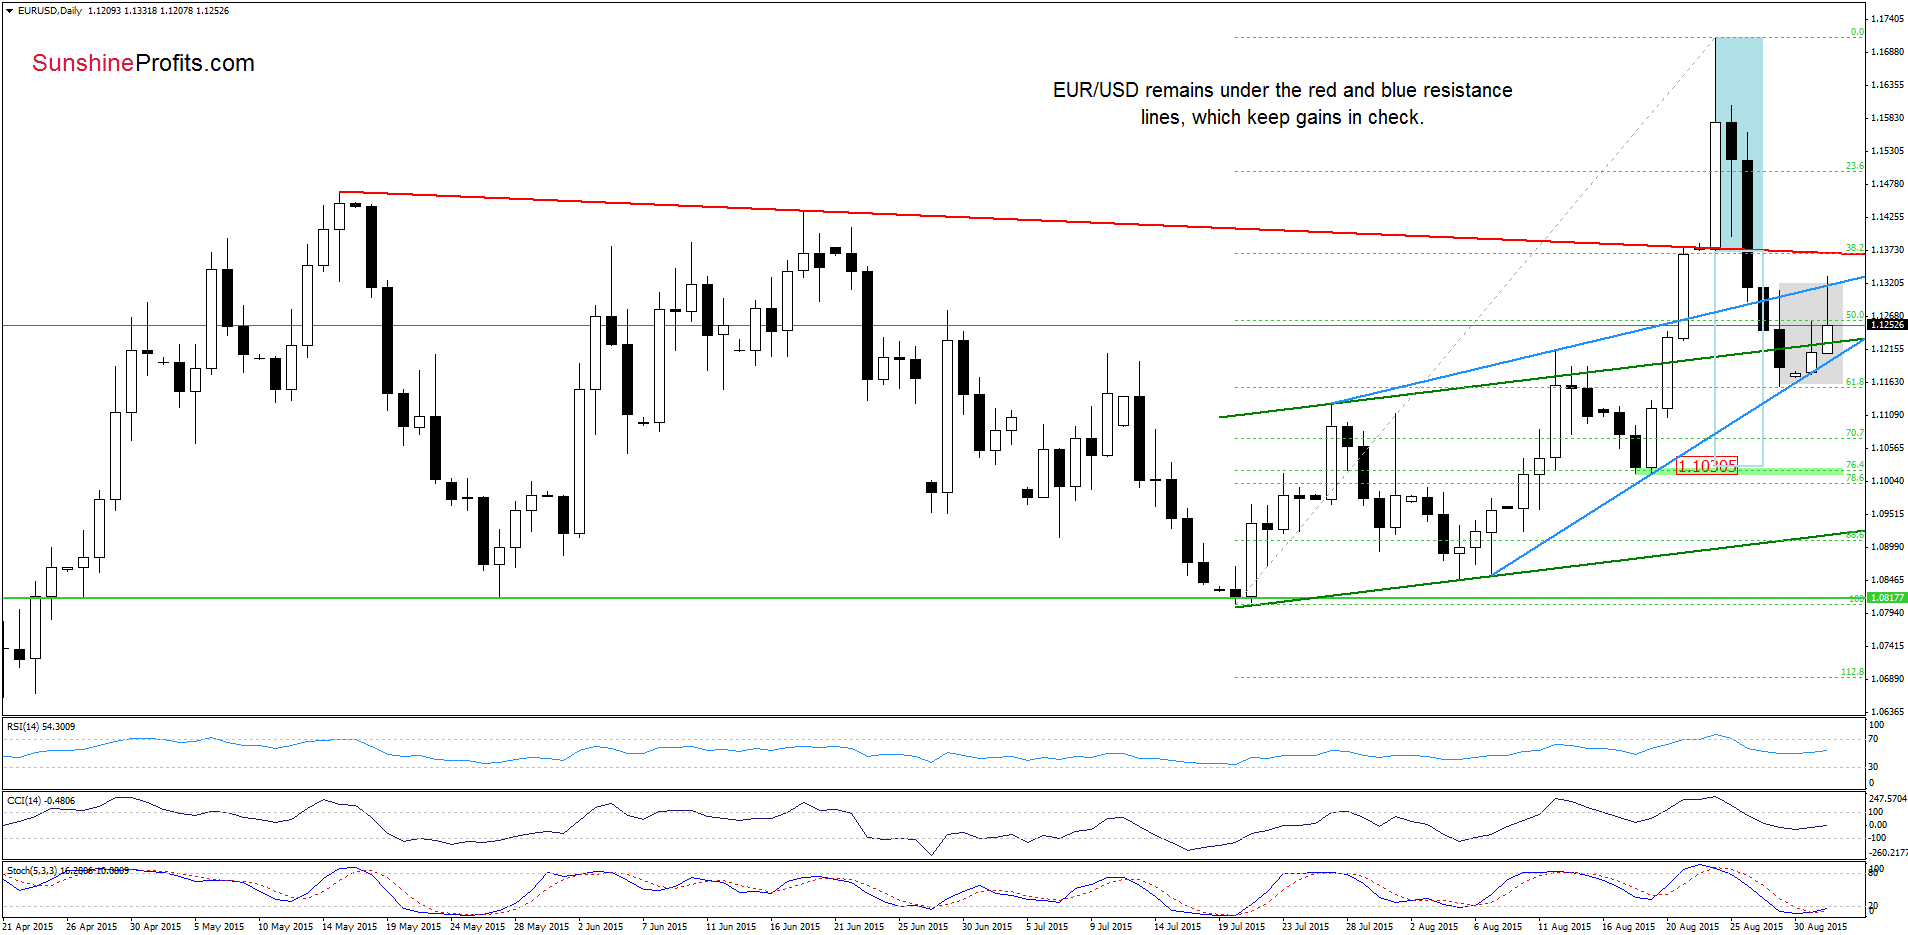
As you see on the daily chart, EUR/USD moved higher once again, but the combination of the blue resistance line (the upper border of the rising wedge) and the upper line of the grey consolidation stopped currency bulls triggering a pullback. Additionally, we should keep in mind that the exchange rate is still trading under the red declining resistance line, which together suggests that as long as there is no invalidation of the breakdown under all these lines another attempt to move lower is more likely than not. In our opinion, if the pair drops under the lower line of the rising wedge (marked with blue), the next downside target would be around 1.1030, where the size of the downward move will correspond to the height of the blue consolidation and where the mid-Aug lows are.
Very short-term outlook: bearish
Short-term outlook: bearish
MT outlook: mixed with bearish bias
LT outlook: mixed
Trading position (short-term; our opinion): Short positions with a stop-loss order at 1.1445 are justified from the risk/reward perspective. The downside target around 1.0938. We will keep you informed should anything change, or should we see a confirmation/invalidation of the above.
USD/JPY
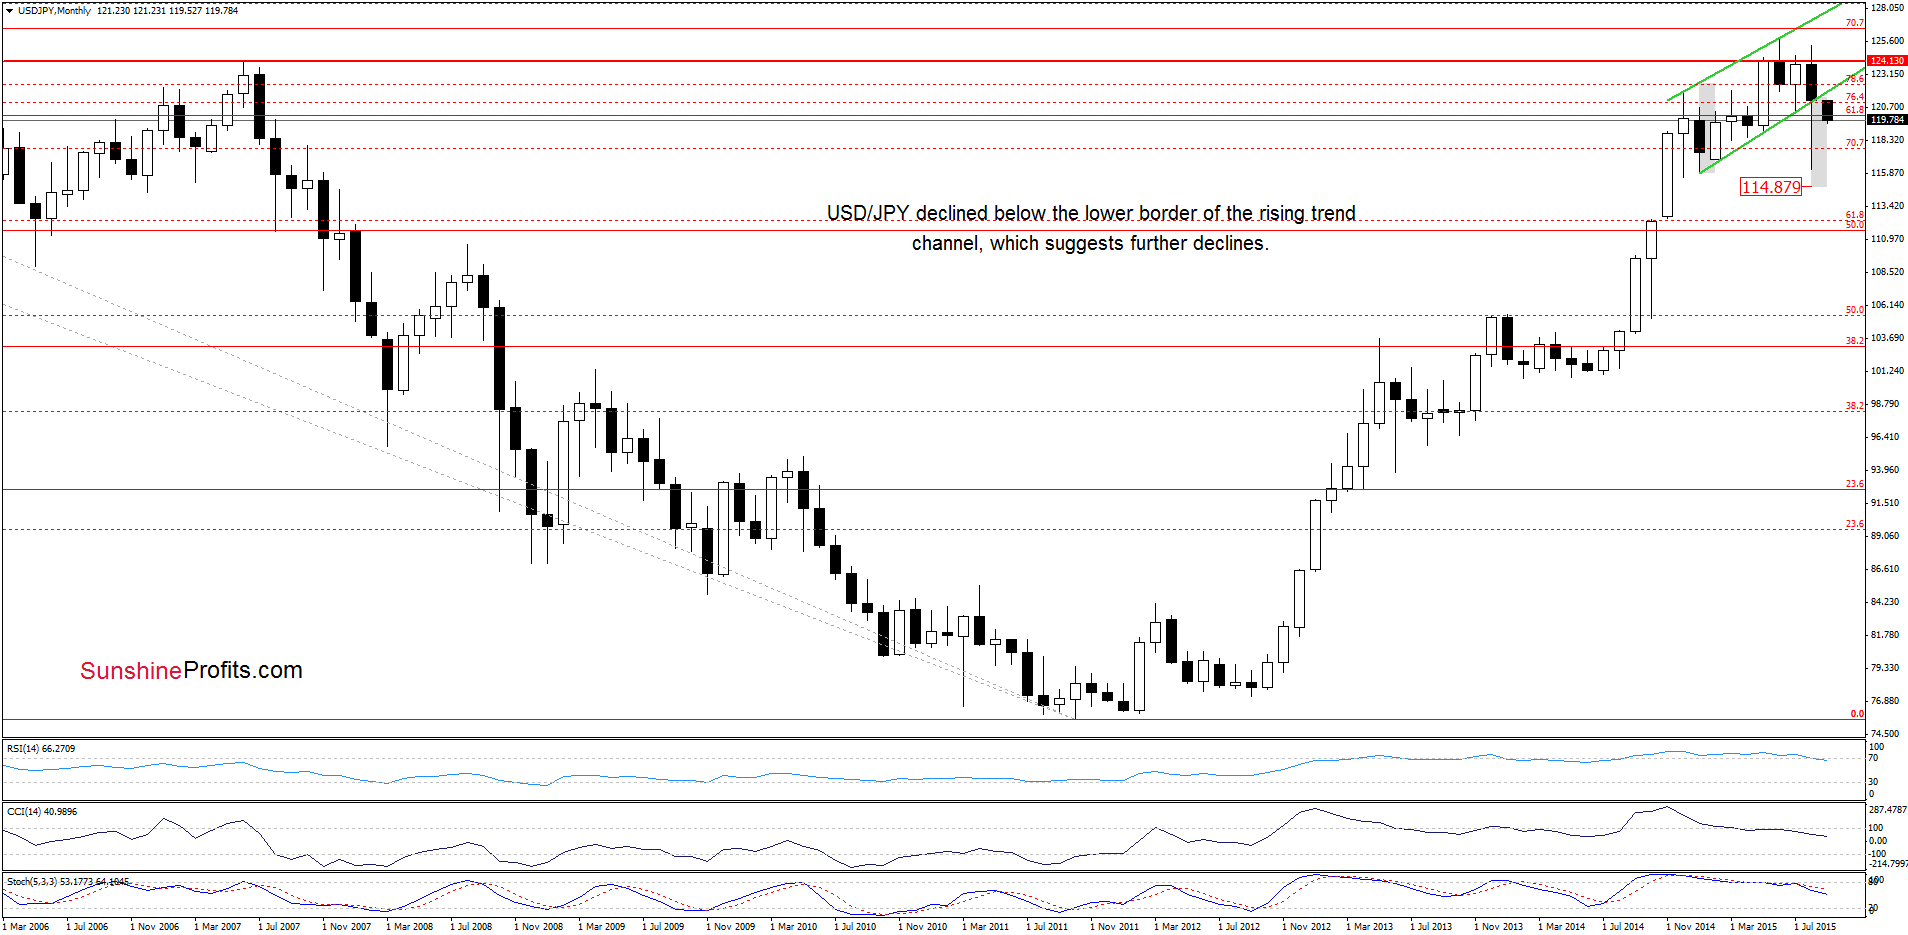
The situation in the medium-term has deteriorated after USD/JPY extended losses and declined under the lower border of the rising trend channel. This is a negative signal, which suggests lower values of the exchange rate in near future.
What impact did this price action have on the very short-term picture? Let’s check.
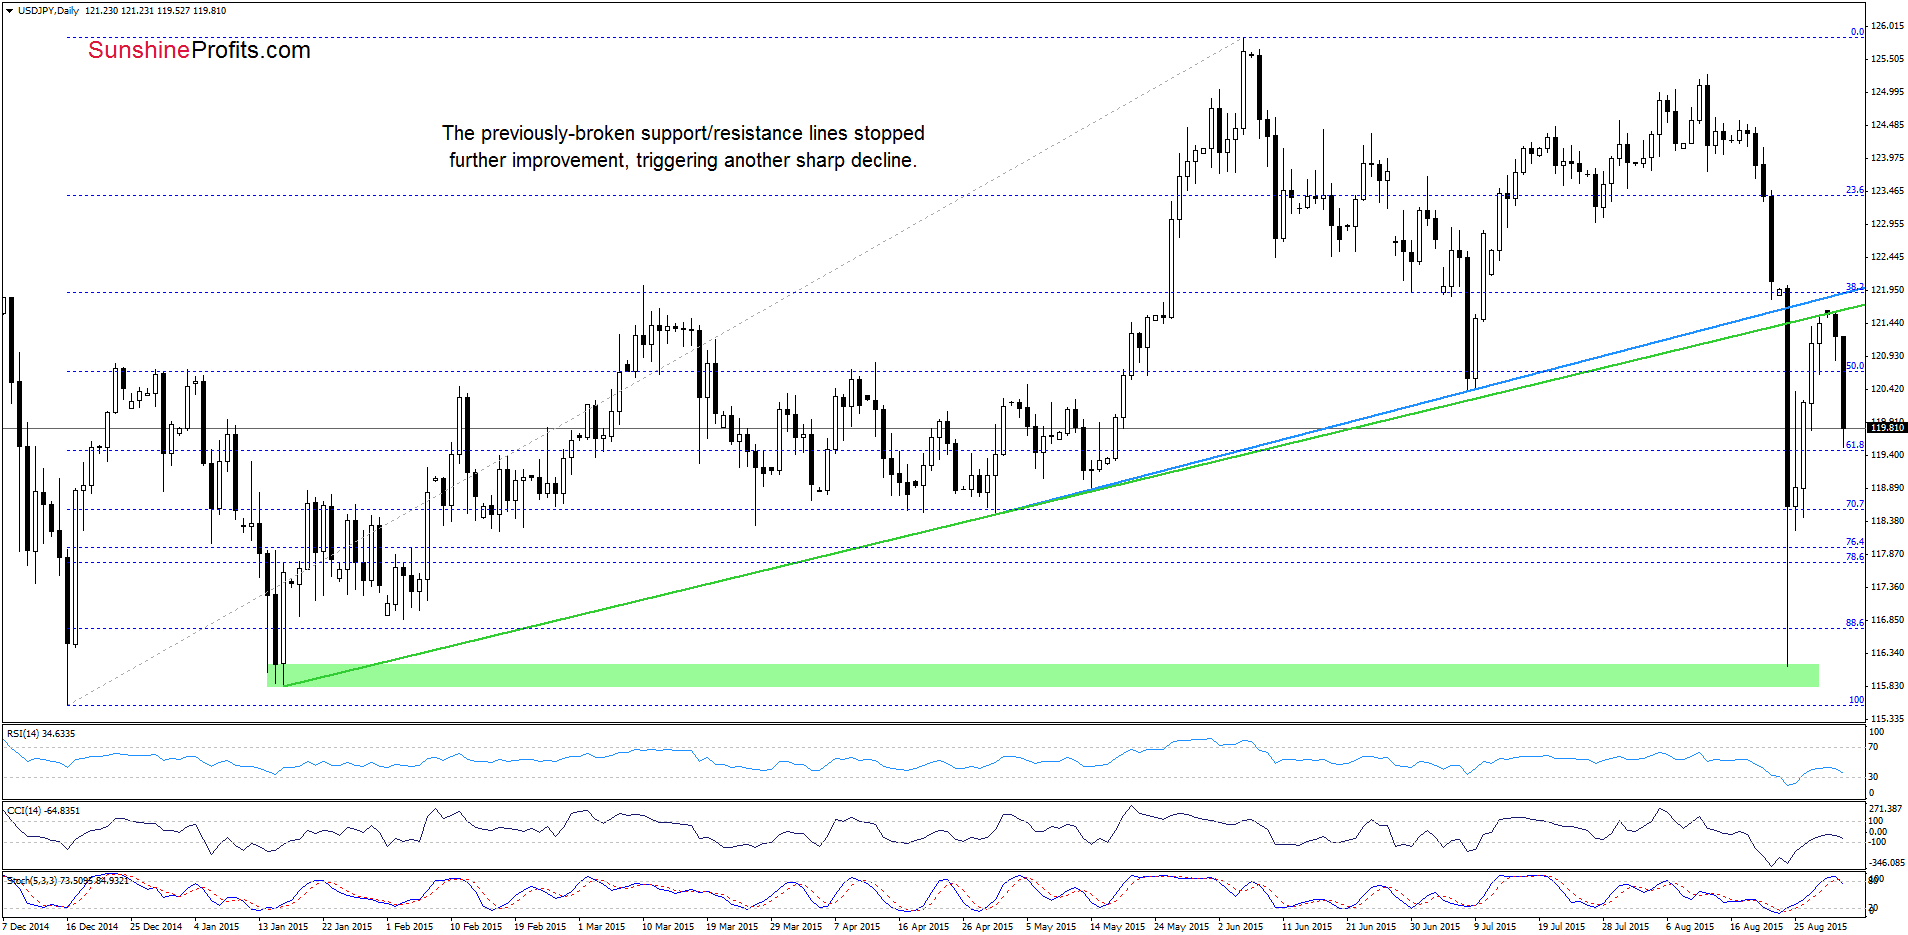
From this perspective we that the previously-broken blue and green support lines encouraged currency bears to act, which resulted in a sharp decline earlier today. With this downswing, the pair reached the 38.2% Fibonacci retracement (based on the late Aug rally), which suggests that we may see a rebound from here (and even a comeback to the key resistance lines) in the coming day(s). Nevertheless, taking into account the medium-term picture and the current position of the Stochastic Oscillator, it seems that another downswing is just around the corner. However, this scenario would be more reliable if we see a daily close below the above-mentioned Fibonacci retracement (at 119.54).
Very short-term outlook: mixed
Short-term outlook: mixed
MT outlook: mixed
LT outlook: mixed
Trading position (short-term; our opinion): No positions are justified from the risk/reward perspective at the moment. We will keep you informed should anything change, or should we see a confirmation/invalidation of the above.
USD/CAD
The medium-term picture hasn’t changed much as USD/CAD is trading above the 2008 high. Today, we’ll focus on the very short-term changes.
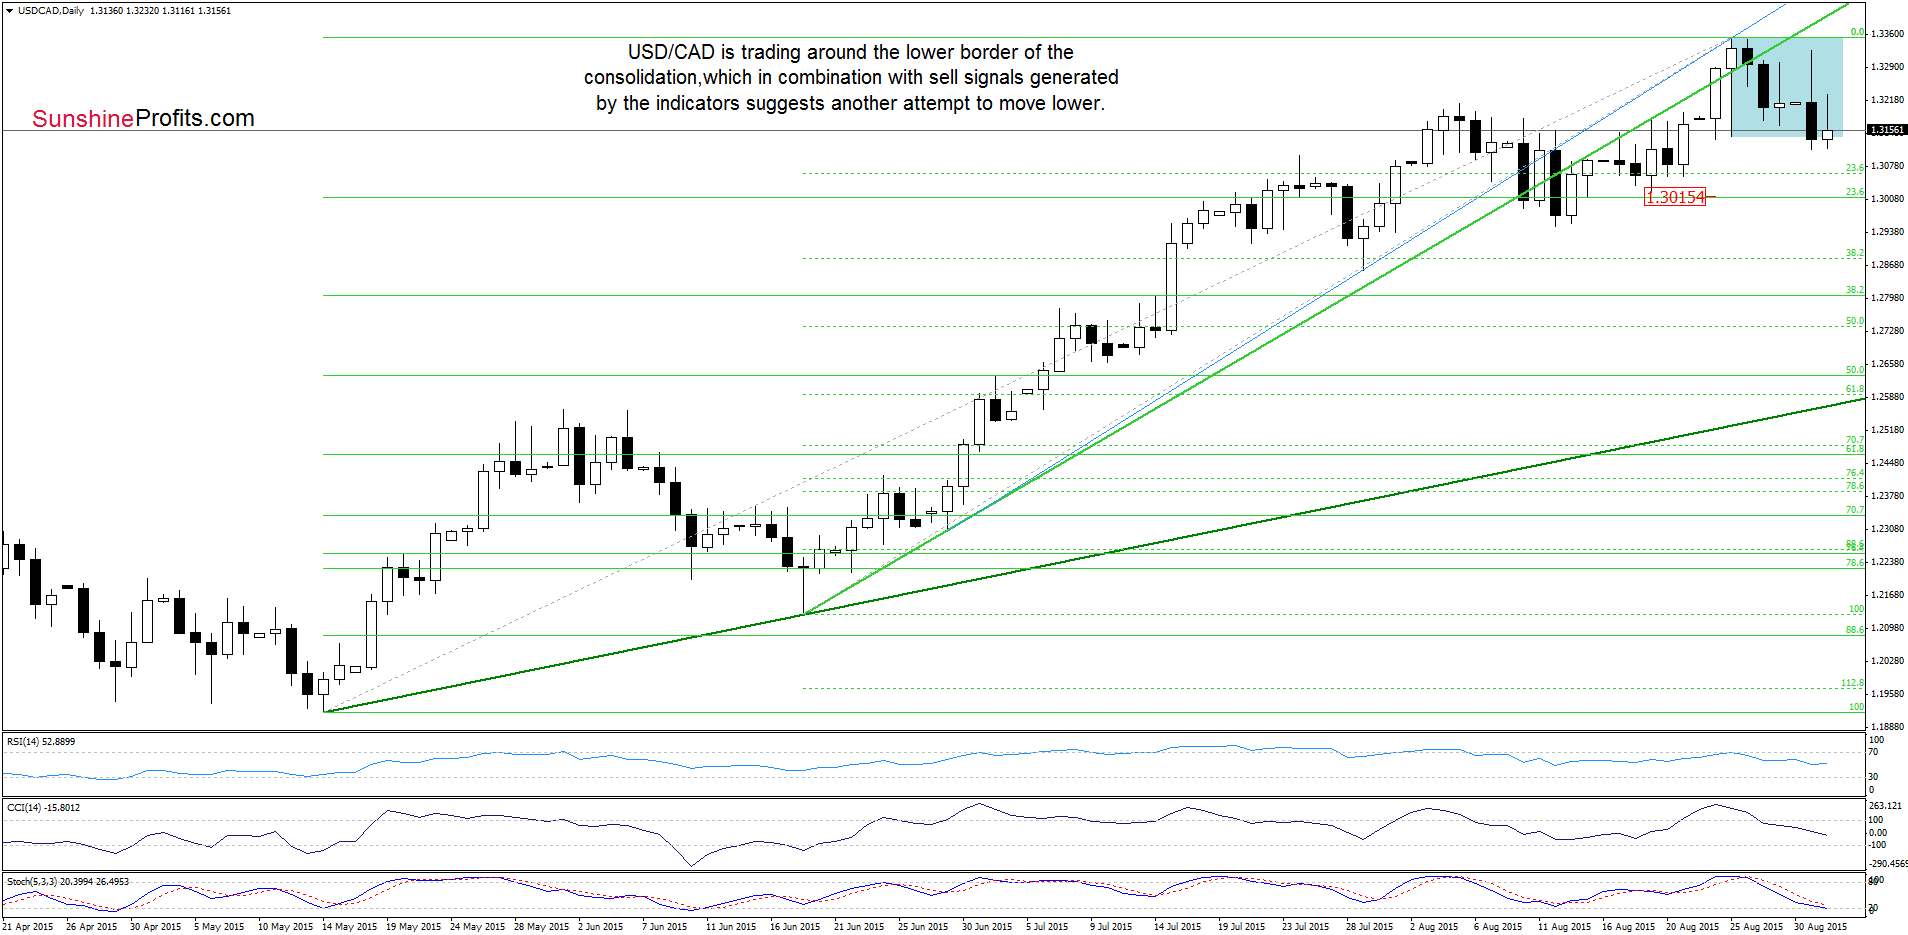
The first thing that catches the eye on the daily chart is decline to the lower border of the blue consolidation. Although USD/CAD bounced off this area earlier today, it seems to us that sell signals generated by the indicators will encourage currency bears to act in the coming day(s). If this is the case, and the pair closes another day under the lower line of the formation, the initial downside target would be around 1.2950-1.3015, where the bottom of the previous pullback and the 23.6% Fibonacci retracement (based on the entire May-Aug rally) are.
Very short-term outlook: mixed with bearish bias
Short-term outlook: mixed
MT outlook: mixed
LT outlook: mixed
Trading position (short-term; our opinion): No positions are justified from the risk/reward perspective at the moment. We will keep you informed should anything change, or should we see a confirmation/invalidation of the above.
Thank you.
Nadia Simmons
Forex & Oil Trading Strategist
Przemyslaw Radomski, CFA
Founder, Editor-in-chief
Gold & Silver Trading Alerts
Forex Trading Alerts
Oil Investment Updates
Oil Trading Alerts
