

The Fed doubled down on its dovish stance. What card will gold play now?
Fed Remains Patient
Yesterday, the FOMC published the monetary policy statement from its latest meeting that took place on March 19-20th. In line with the expectations, the US central bank unanimously kept its interest rates unchanged. The federal funds rate remained at the target range of 2.25 to 2.50 percent:
The Committee seeks to foster maximum employment and price stability. In support of these goals, the Committee decided to maintain the target range for the federal funds rate at 2-1/4 to 2-1/2 percent.
The inaction reflected the new patient approach adopted by the Fed in January. The US central bank also noted the slowdown in the US economic growth and some other indicators:
Information received since the Federal Open Market Committee met in January indicates that (…) growth of economic activity has slowed from its solid rate in the fourth quarter. (…) Recent indicators point to slower growth of household spending and business fixed investment in the first quarter.
Apart from these changes, the statement was virtually kept the same as it was in January. So, it should not significantly affect the gold market. However, it was accompanied by the new details about the balance sheet normalization, and the dot plot. Let’s now analyze them.
Slowdown in Balance Sheet’s Normalization
As a result of its previous discussions, the Fed published Balance Sheet Normalization Principles and Plans. The key changes are as follows:
- first, the US central banks slows down the pace of the decline in its holdings of Treasury securities over coming quarters, by reducing the cap on monthly redemptions from the current level of $30 billion to $15 billion beginning in May 2019;
- second, the Fed will end its balance sheet normalization as early as in September 2019;
- third, since October 2019, the Committee will reinvest principal payments received from agency debt and agency MBS in Treasury securities, subject to a maximum amount of $20 billion per month
All these changes mean that the Fed will soften its quantitative tightening. Apparently, the US central bank took heed of all the complaints about the Fed draining liquidity. The party in the risky assets will, thus, go on, which may be bad news for the yellow metal. On the other hand, gold may appreciate in tandem with the stock market. Moreover, more dovish Fed and weaker upward pressure on the interest rates should support gold.
Dramatic Shift in Dot Plot
The second biggest dovish surprise, next to the new Fed’s balance sheet policy, were the fresh Fed’s economic projections. The forecasts for GDP and inflation were slightly down, while that for the unemployment rate slightly up. But the real change was the dramatic shift in the dot plot. The median assessment of appropriate level of the federal funds rate was slashed from 2.9 to 2.4 percent in 2019, and from 3.1 to 2.6 percent in both 2020 and 2021. It means that now the Fed sees no hike this year and only one hike next year. It’s a really remarkable turn, as in just six months, the US central bank has gone from an outlook with interest rates in restrictive territory to a more neutral (some might even say accommodative) positioning. After such abrupt revisions, what kind of credibility does the Fed’s dot plot have left?
Implications for Gold
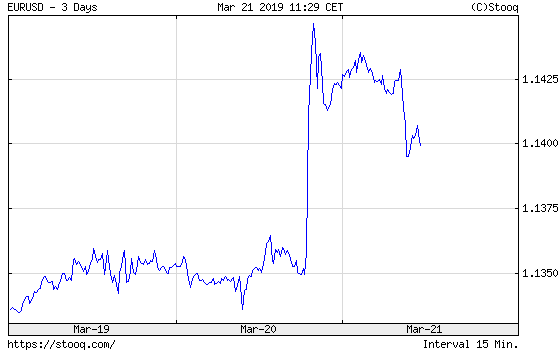
What does it all mean for gold? Well, the Fed surprised investors on a dovish side. The markets made their moves. While the bond yields declined, the US dollar predictably plunged against both the euro and the Japanese yen, as the charts below show.
Chart 1: USD/JPY exchange rate from March 19 to March 21, 2019
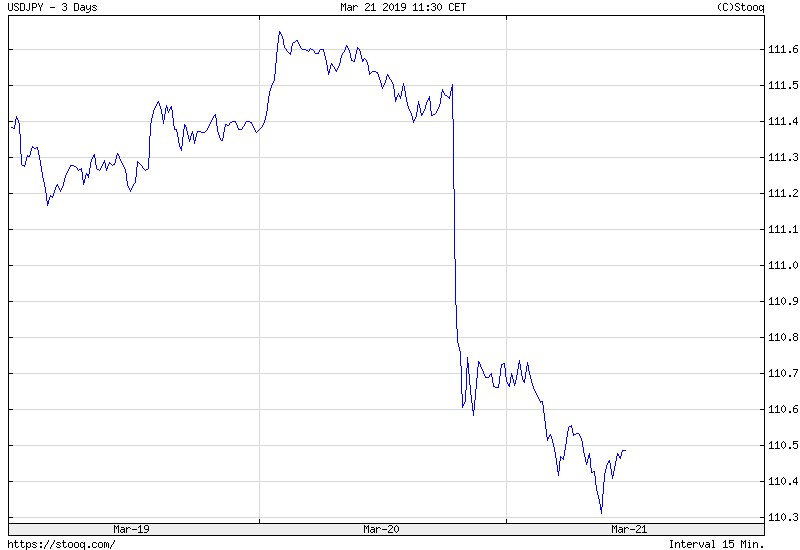
Chart 2: EUR/USD exchange rate from March 19 to March 21, 2019
So, the price of gold jumped. As one can see in the chart below, the yellow metal moved yesterday above $1,315.
Chart 3: Gold prices from March 19 to March 21, 2019.
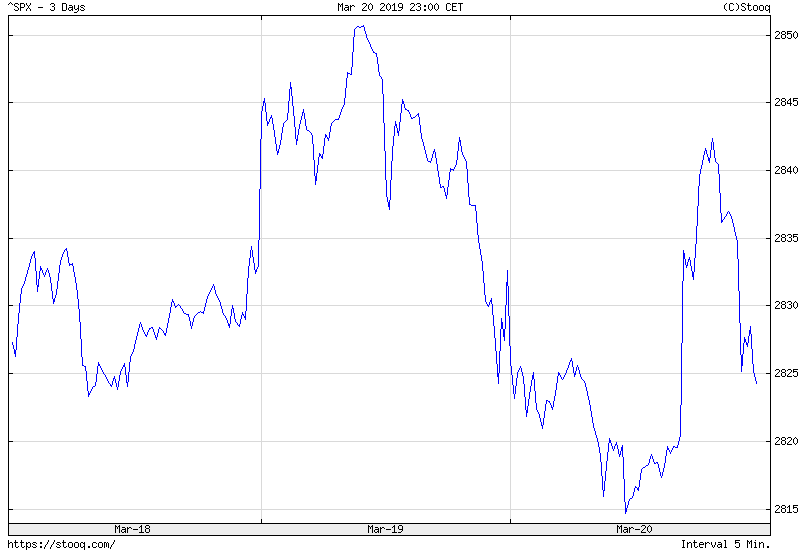
More dovish Fed is a fundamental tailwind for the gold market. We have been repeating for a long time that the US monetary policy has reached its hawkish peak in 2018 and that this is why 2019 should not be as harsh to the precious metals as 2018 was. There is always a risk in repricing of the Fed’s interest rate path, but unless inflation significantly jumps, we consider it as low. Another risk is that the dovish Fed will support the stock market at the expense of the precious metals market. However, the reaction of the S&P 500 is far from euphoric, as the chart below clearly shows.
Chart 4: S&P 500 Index from March 18 to March 20, 2019.
It may suggest that the Fed’s bold reaction frightened investors. After all, it might be the case that if the US central bank doubles down on a dovish side, when the economy seems solid, it must know something disturbing about the economy the mere mortal does not know. The conclusion is that appeal of holding gold should not decrease – and it may even increase thanks to the lower bond yields and weaker greenback.
If you enjoyed the above analysis, we invite you to check out our other services. We provide detailed fundamental analyses of the gold market in our monthly Market Overview reports and we provide daily Gold & Silver Trading Alerts with clear buy and sell signals. If you’re not ready to subscribe yet and are not on our gold mailing list yet, we urge you to sign up. It’s free and if you don’t like it, you can easily unsubscribe. Sign up today!
Disclaimer: Please note that the aim of the above analysis is to discuss the likely long-term impact of the featured phenomenon on the price of gold and this analysis does not indicate (nor does it aim to do so) whether gold is likely to move higher or lower in the short- or medium term. In order to determine the latter, many additional factors need to be considered (i.e. sentiment, chart patterns, cycles, indicators, ratios, self-similar patterns and more) and we are taking them into account (and discussing the short- and medium-term outlook) in our trading alerts.
Thank you.
Arkadiusz Sieron, Ph.D.
Sunshine Profits‘ Gold News Monitor and Market Overview Editor
