

Although the British pound extended gains against the greenback in the previous week, two very important resistances stopped currency bulls, triggering a pullback. How did this drop affect the technical picture of GBP/USD?
In our opinion the following forex trading positions are justified - summary:
- EUR/USD: none
- GBP/USD: short (a stop-loss order at 1.3272; the initial downside target at 1.2375)
- USD/JPY: none
- USD/CAD: none
- USD/CHF: none
- AUD/USD: none
EUR/USD
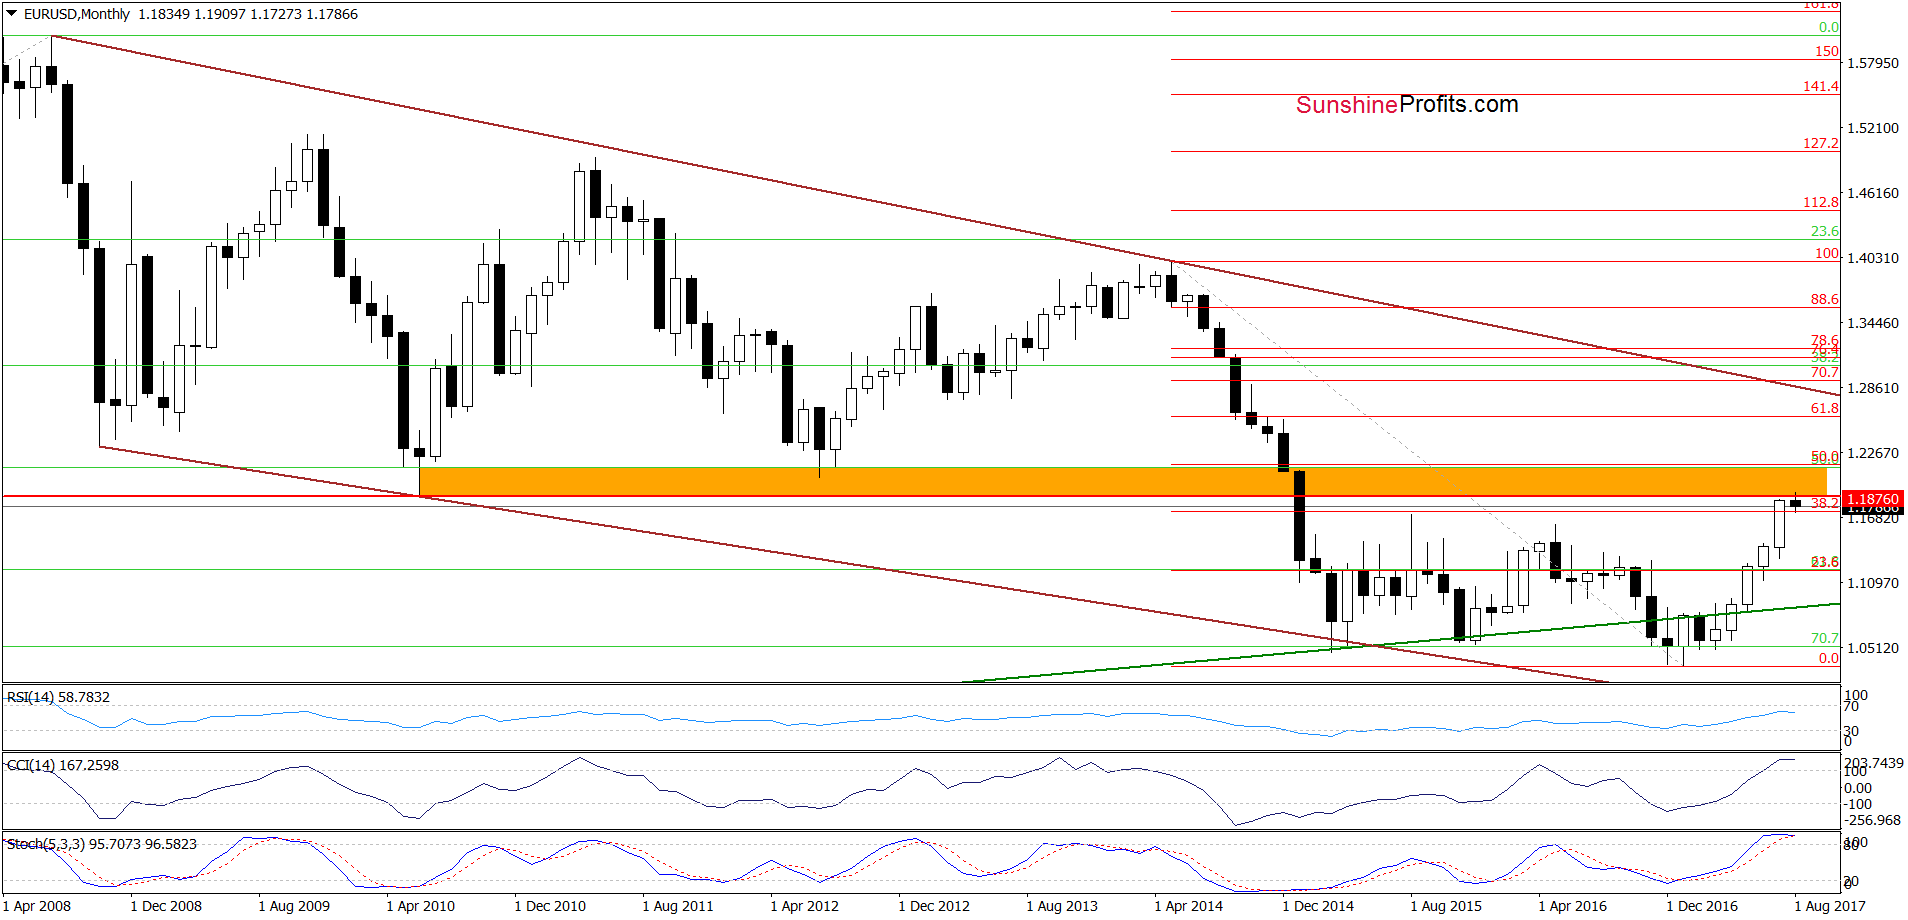
Looking at the chart from the long-term perspective, we see that EUR/USD extended gains, which resulted in a test of the orange resistance zone.
How did this increase affect the medium-term picture? Let’s check.
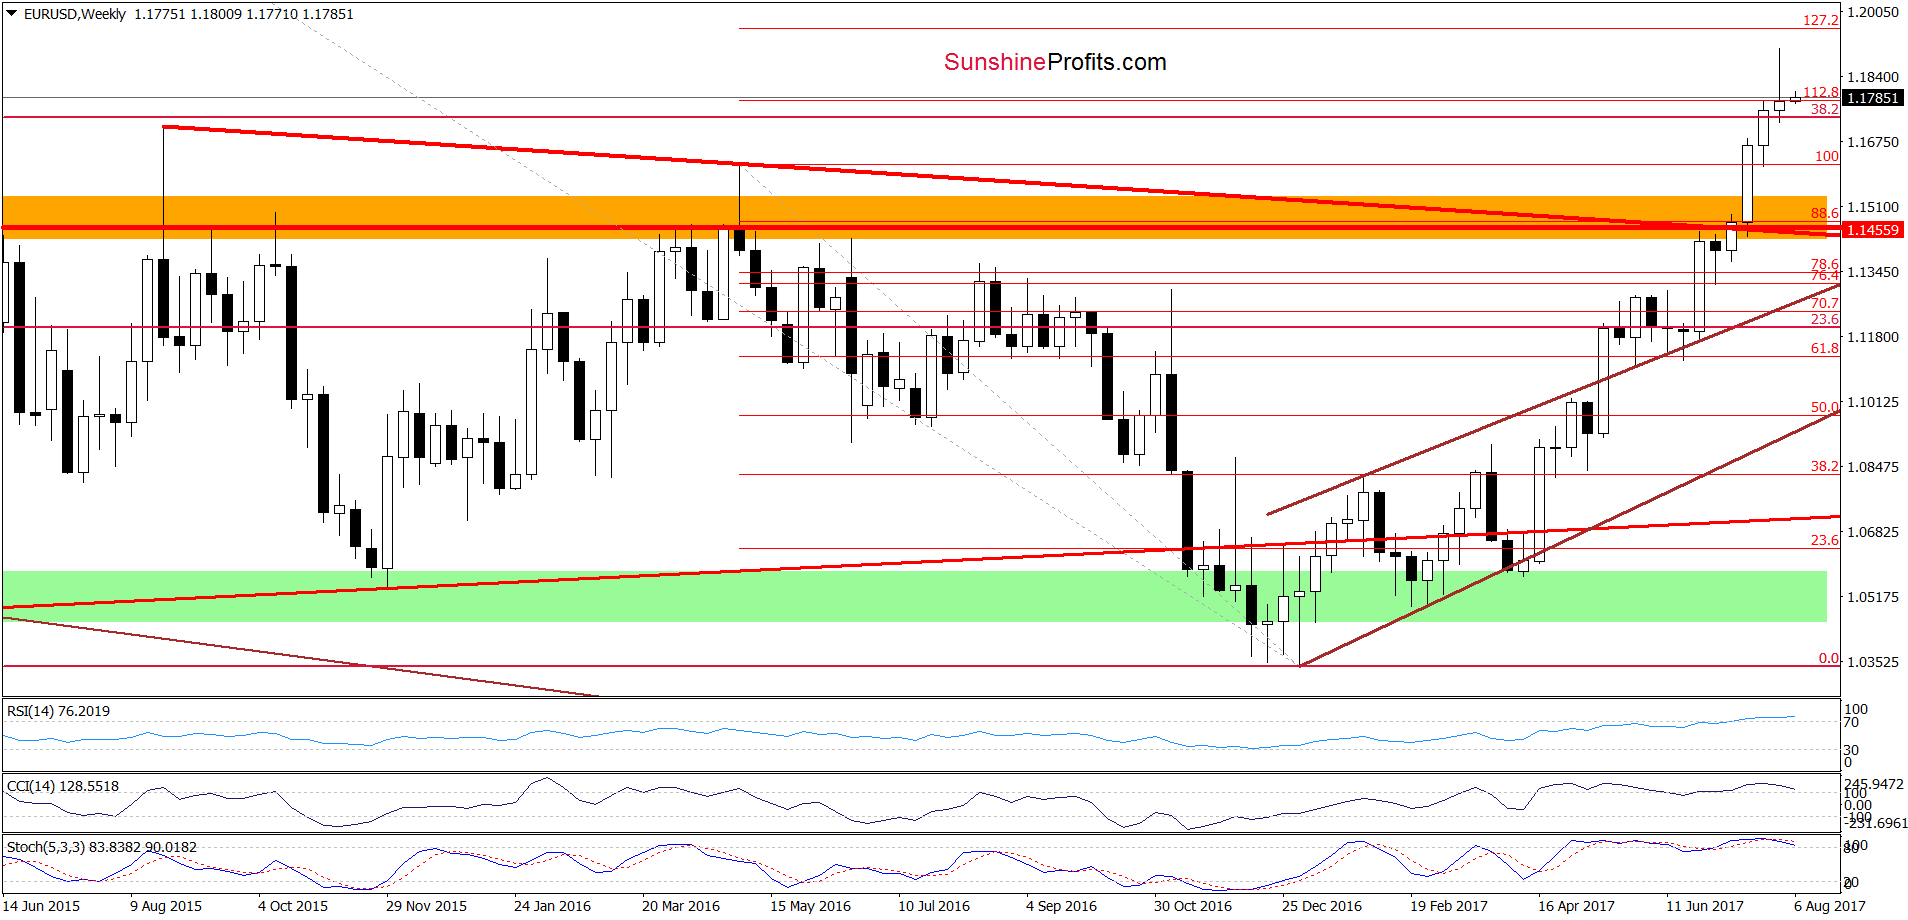
Although monthly and weekly indicators are overbought, currency bulls pushed EUR/USD higher in the previous week, which resulted in a breakout above the 38.2% Fibonacci retracement based on the entire May 2014-January 2017 downward move (the retracement is more visible on the long-term chart) and the 112.8% Fibonacci extension (based on the May 2016- January 2017 downward move).
What does it mean for the exchange rate? In our opinion, such price action suggests that as long as there are no sell signals generated by the indicators, another attempt to move higher can’t be ruled out. Therefore, if the pair moves higher from current levels, the initial upside target will be around 1.1960, where the 127.2% Fibonacci extension is.
Very short-term outlook: mixed with bullish bias
Short-term outlook: mixed
MT outlook: mixed
LT outlook: mixed
Trading position (short-term; our opinion): No positions are justified from the risk/reward perspective. Nevertheless, if we see reliable bearish factors on the horizon, we’ll consider opening short positions. We will keep you informed should anything change, or should we see a confirmation/invalidation of the above.
GBP/USD
Quoting our last commentary on this currency pair:
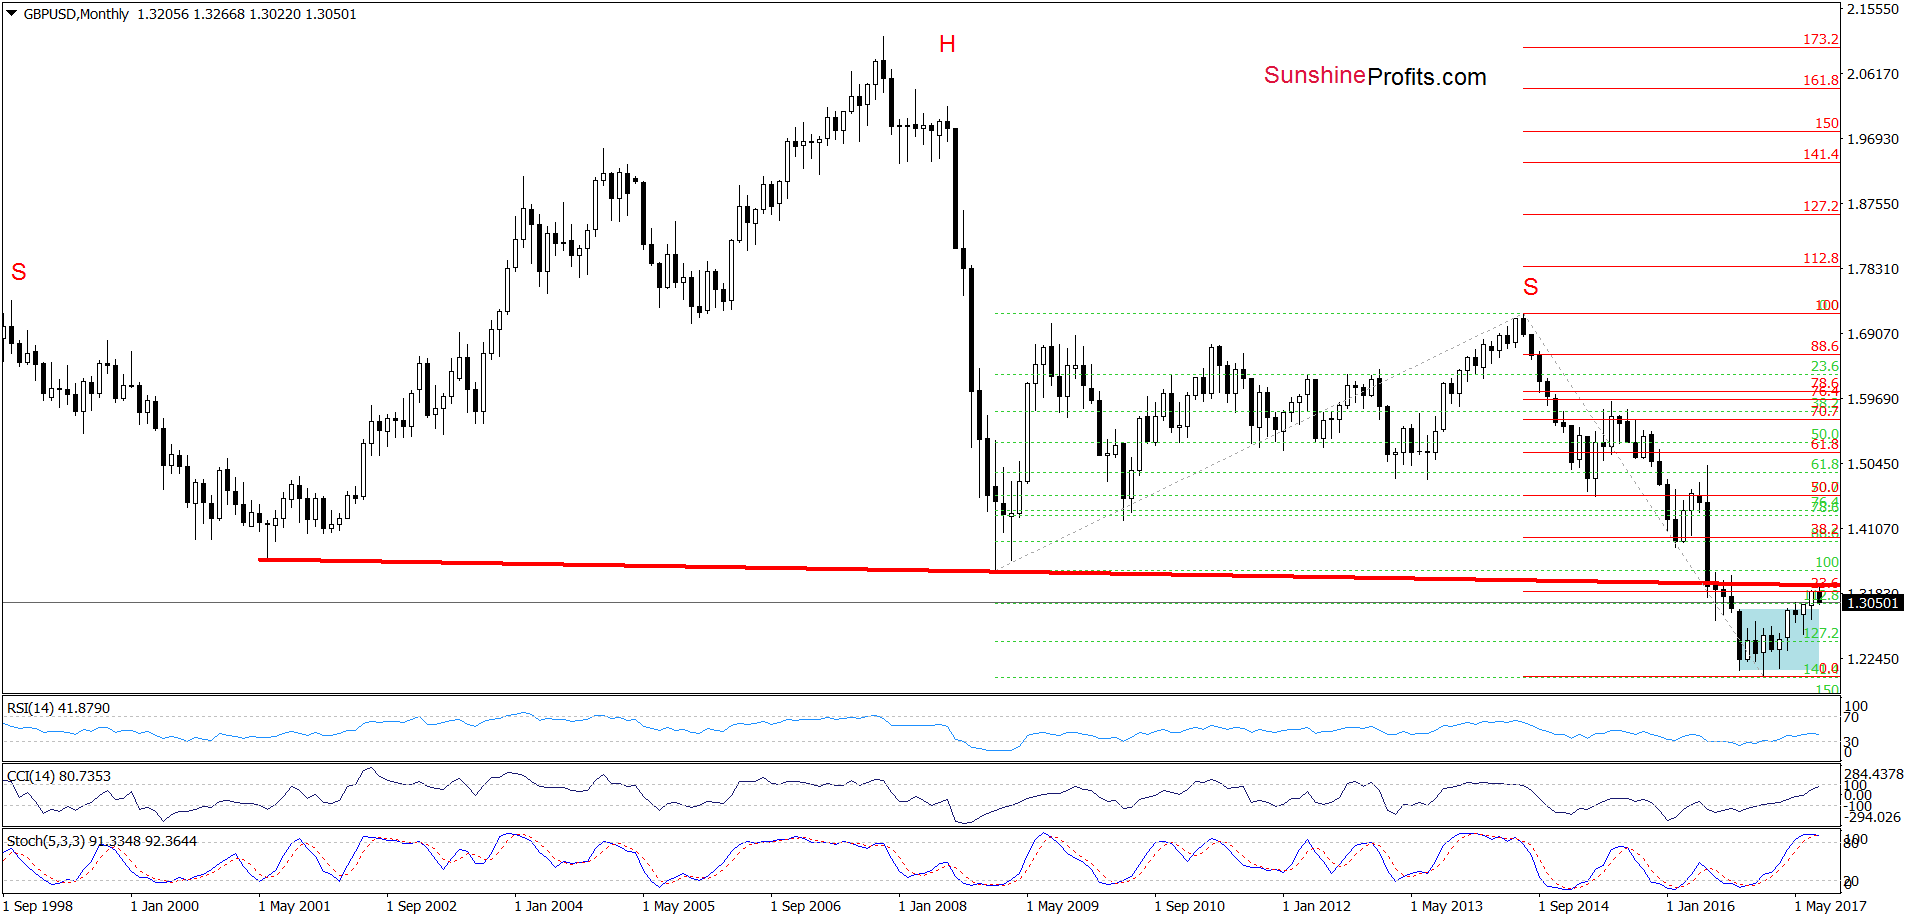
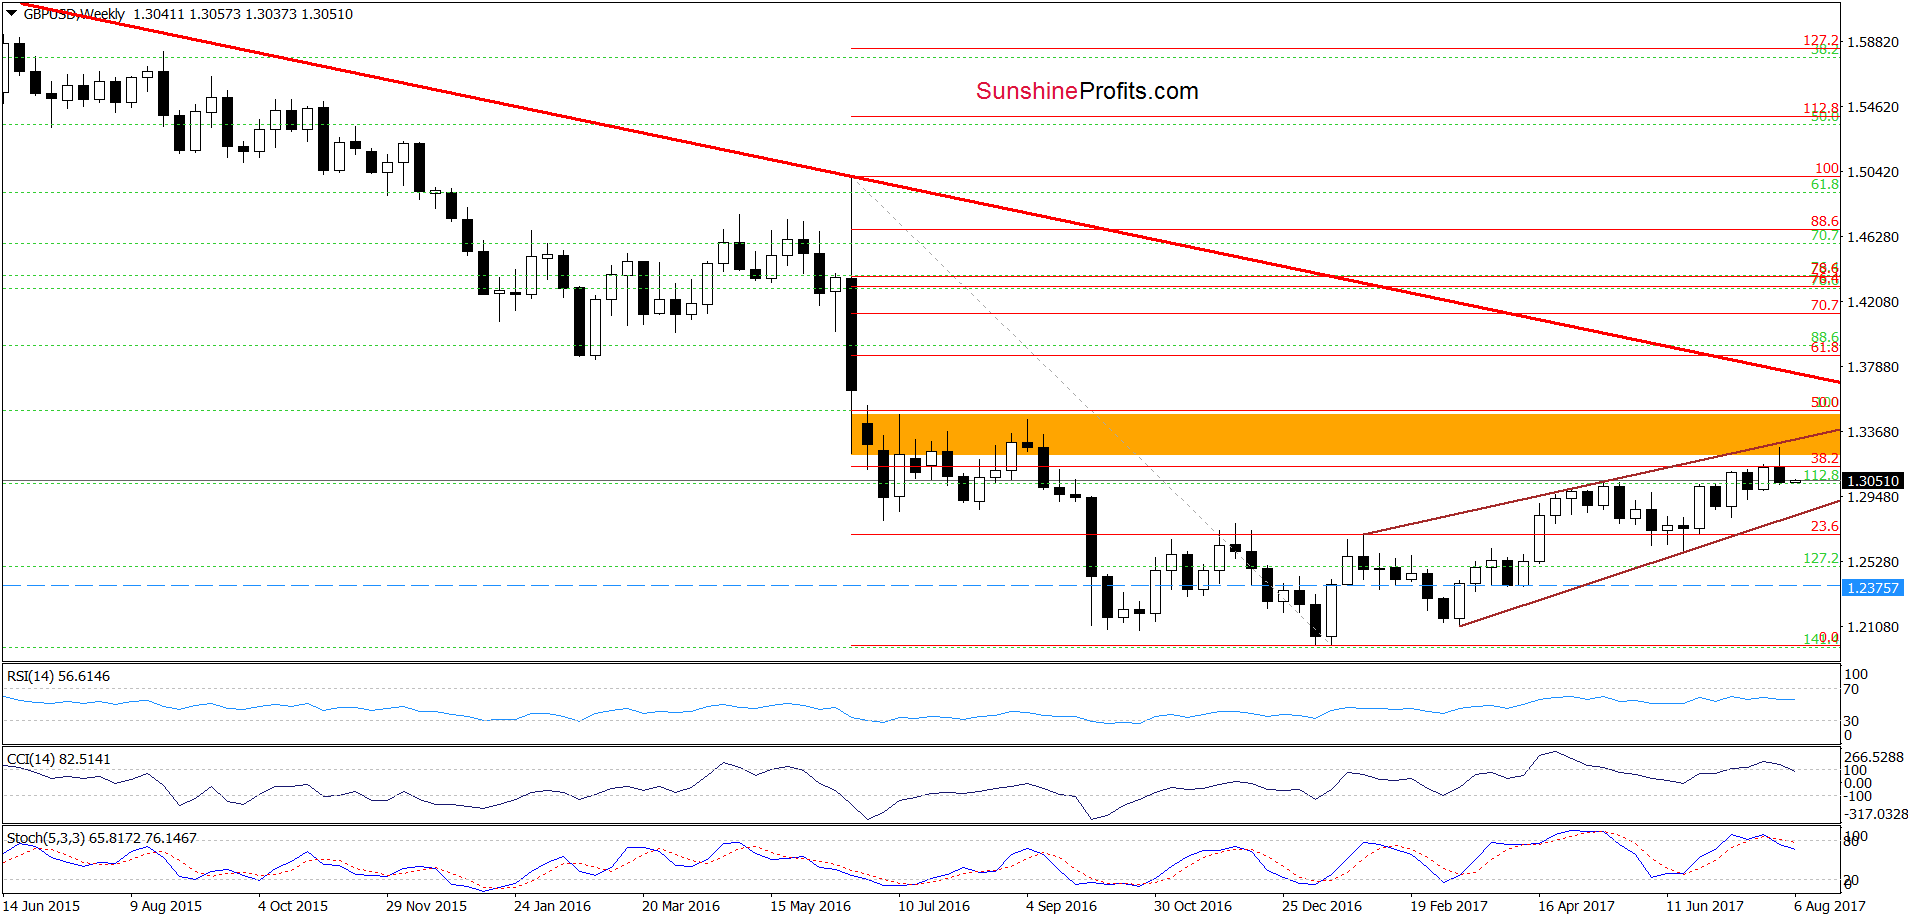
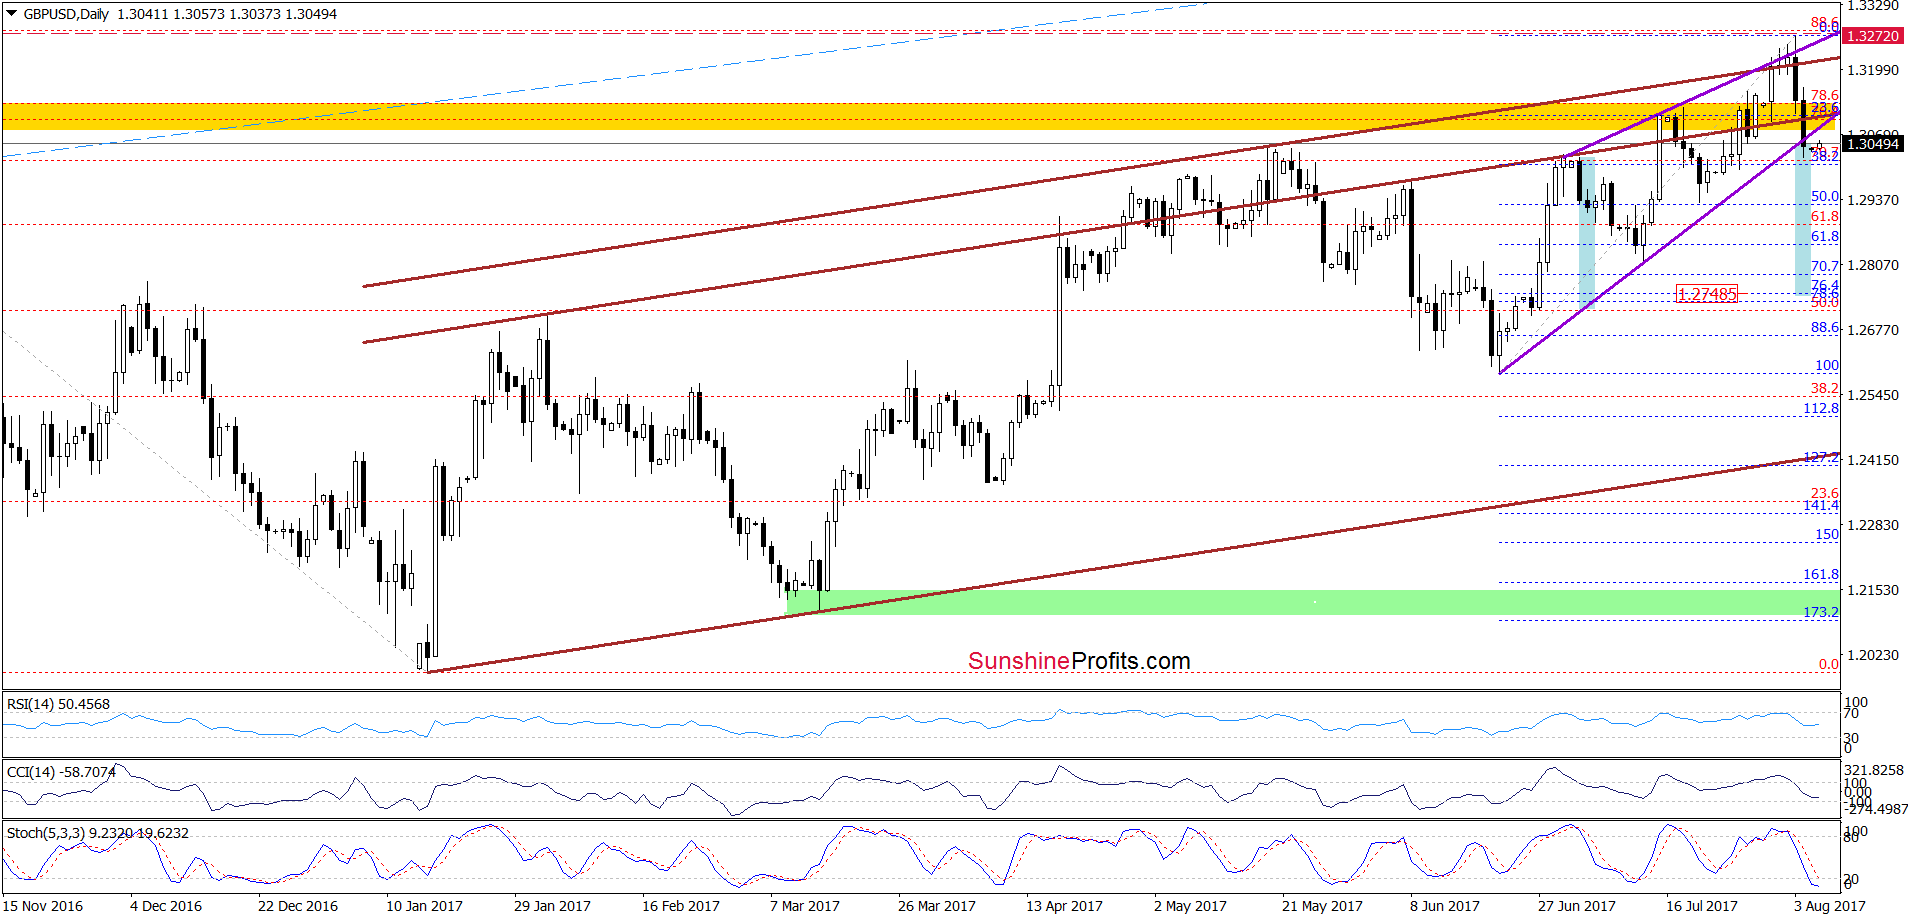
(…) Thanks to the recent upward move the exchange rate approached two very important resistances – the neck line of the long-term head and shoulders formation (marked on the chart above) and the upper border of the brown rising wedge (…), which together increase significantly the probability of reversal and declines in the coming days (or even weeks).
Why? Because if GBP/USD declines from current levels, we’ll likely see a verification of the breakdown under the neck line of the long-term head and shoulders formation, which should encourage currency bears to act (…)
From today’s point of view, we see that the situation developed in line with the above scenario and currency bears pushed GBP/USD lower after the exchange rate approached the above-mentioned resistance levels. Additionally, weekly indicators generated the sell signals increasing the probability of further declines in the coming week(s).
What impact did this drop have on the very short-term chart? Let’s zoom in our picture and find out.
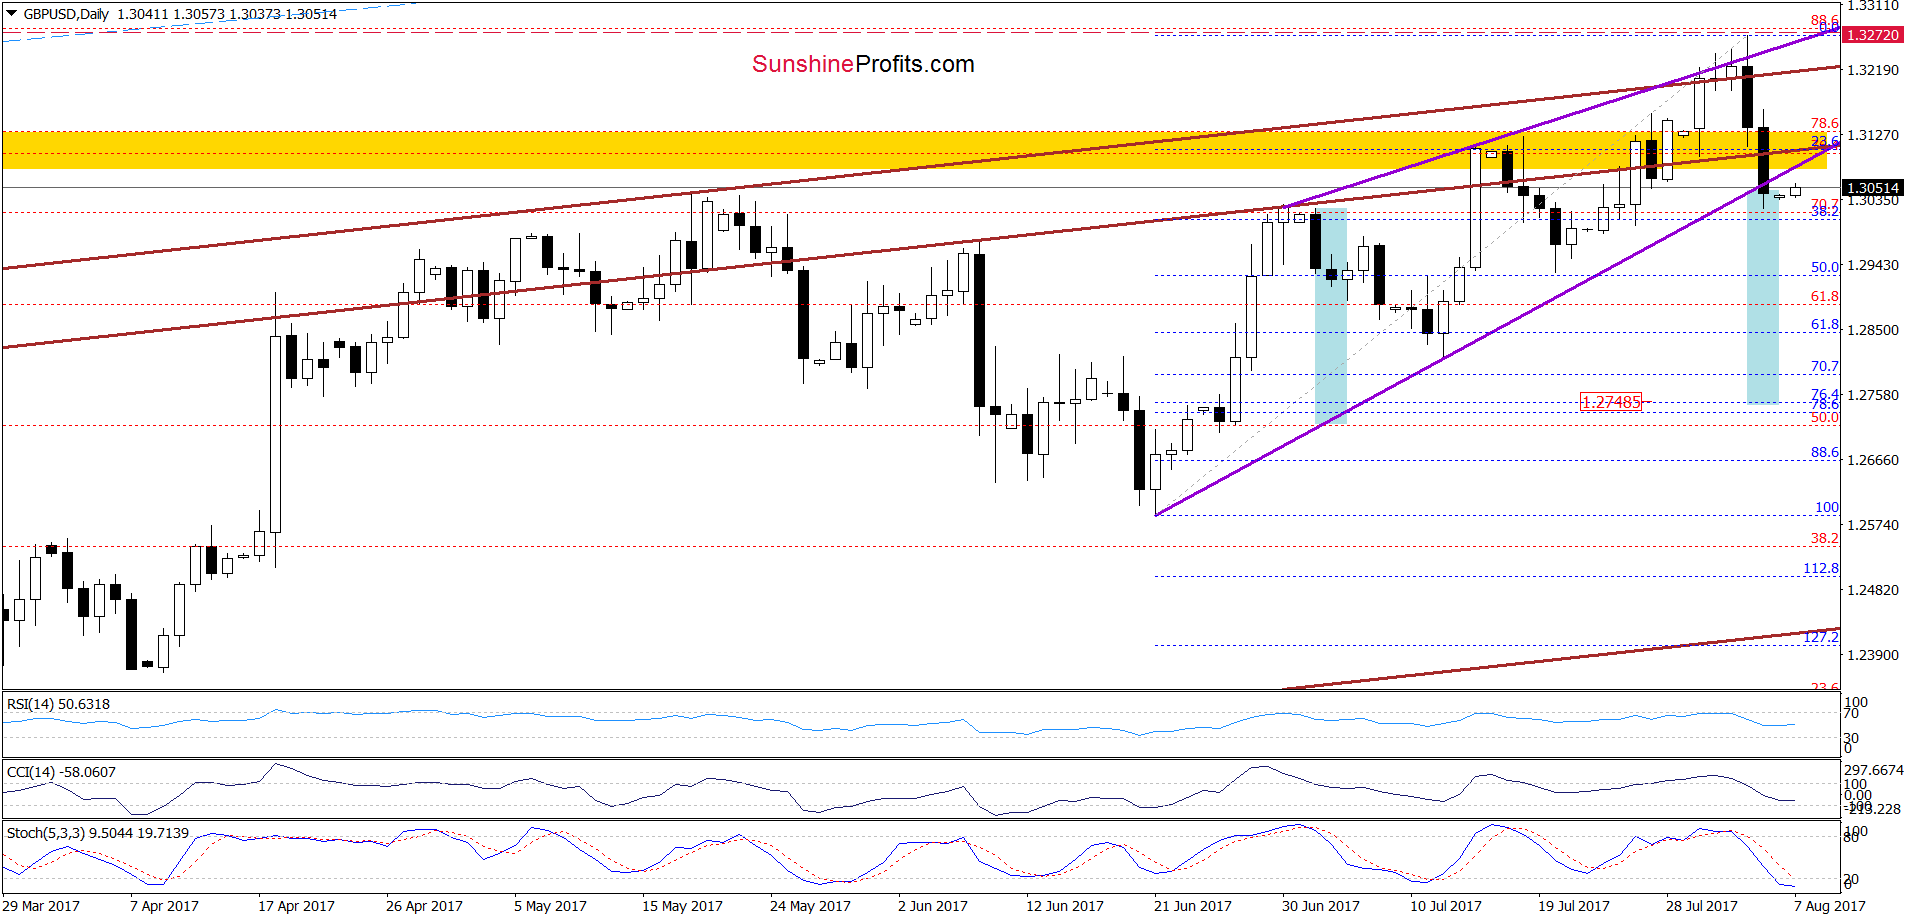
On the daily chart, we see that the last week downward move took GBP/USD not only below the upper border of the purple rising wedge but also under both brown resistance lines and the yellow resistance zone, which resulted in an invalidation of the breakouts above all these levels. On top of that, the exchange rate closed the previous week below the lower border of the purple rising wedge, which opened the way to lower levels. Therefore, if GBP/USD extends declines from current levels, we’ll see a drop to (at least) 1.2748, where the size of the downward move will correspond to the height of the rising wedge and where the 76.4% and 78.6% Fibonacci retracements are.
Very short-term outlook: bearish
Short-term outlook: mixed with bearish bias
MT outlook: mixed with bearish bias
LT outlook: mixed
Trading position (short-term; our opinion): Short positions (with a stop-loss order at 1.3272 and the initial downside target at 1.2375) are justified from the risk/reward perspective. We will keep you informed should anything change, or should we see a confirmation/invalidation of the above.
USD/JPY
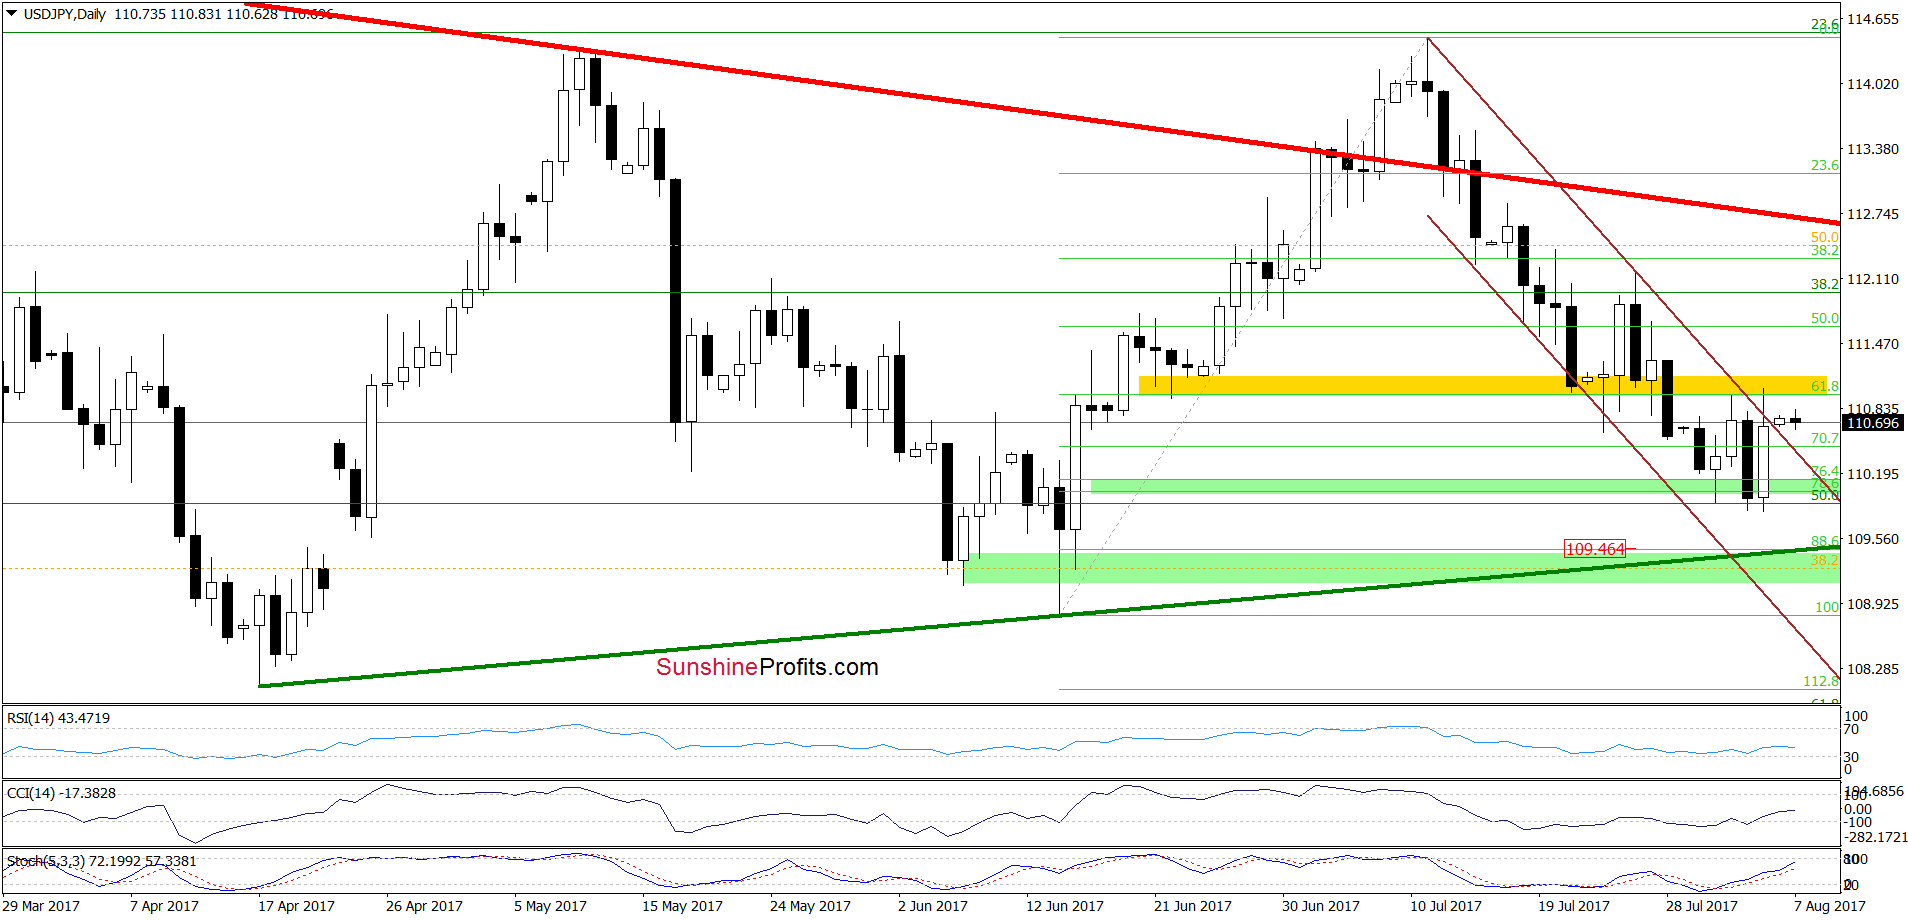
On the daily chart, we see that the situation has improved as USD/JPY bounced off the green support zone created by the 76.4% and 78.6% Fibonacci retracements and broke above the upper border of the brown declining trend channel. Despite this move, the breakout is not confirmed and the exchange rate remains below the yellow resistance zone created by the 61.8% Fibonacci retracement and late June lows. Therefore, in our opinion, another bigger move to the upside will be more likely and reliable if we see a breakout above this area. Until this time waiting at the sidelines is justified from the risk/reward perspective.
Very short-term outlook: mixed
Short-term outlook: mixed
MT outlook: mixed
LT outlook: mixed
Trading position (short-term; our opinion): No positions are justified from the risk/reward perspective at the moment. We will keep you informed should anything change, or should we see a confirmation/invalidation of the above.
Thank you.
Nadia Simmons
Forex & Oil Trading Strategist
Przemyslaw Radomski, CFA
Founder, Editor-in-chief, Gold & Silver Fund Manager
Gold & Silver Trading Alerts
Forex Trading Alerts
Oil Investment Updates
Oil Trading Alerts

