

In the previous week, the U.S. dollar moved lower against the Swiss franc, which took USD/CHF to the long-term line and the lower border of the trend channel. Will the combination of these supports be strong enough to stop declines and trigger a rebound in the coming week?
In our opinion the following forex trading positions are justified - summary:
- EUR/USD: short (a stop-loss order at 1.1402; the initial downside target at 1.1009)
- GBP/USD: short (a stop-loss order at 1.3232; the initial downside target at 1.2375)
- USD/JPY: long (a stop-loss order at 107.62; the initial upside target at 113.08)
- USD/CAD: long (a stop-loss order at 1.2931; the initial upside target at 1.3436)
- USD/CHF: none
- AUD/USD: short (a stop-loss order at 0.7683; the initial downside target at 0.7444)
EUR/USD
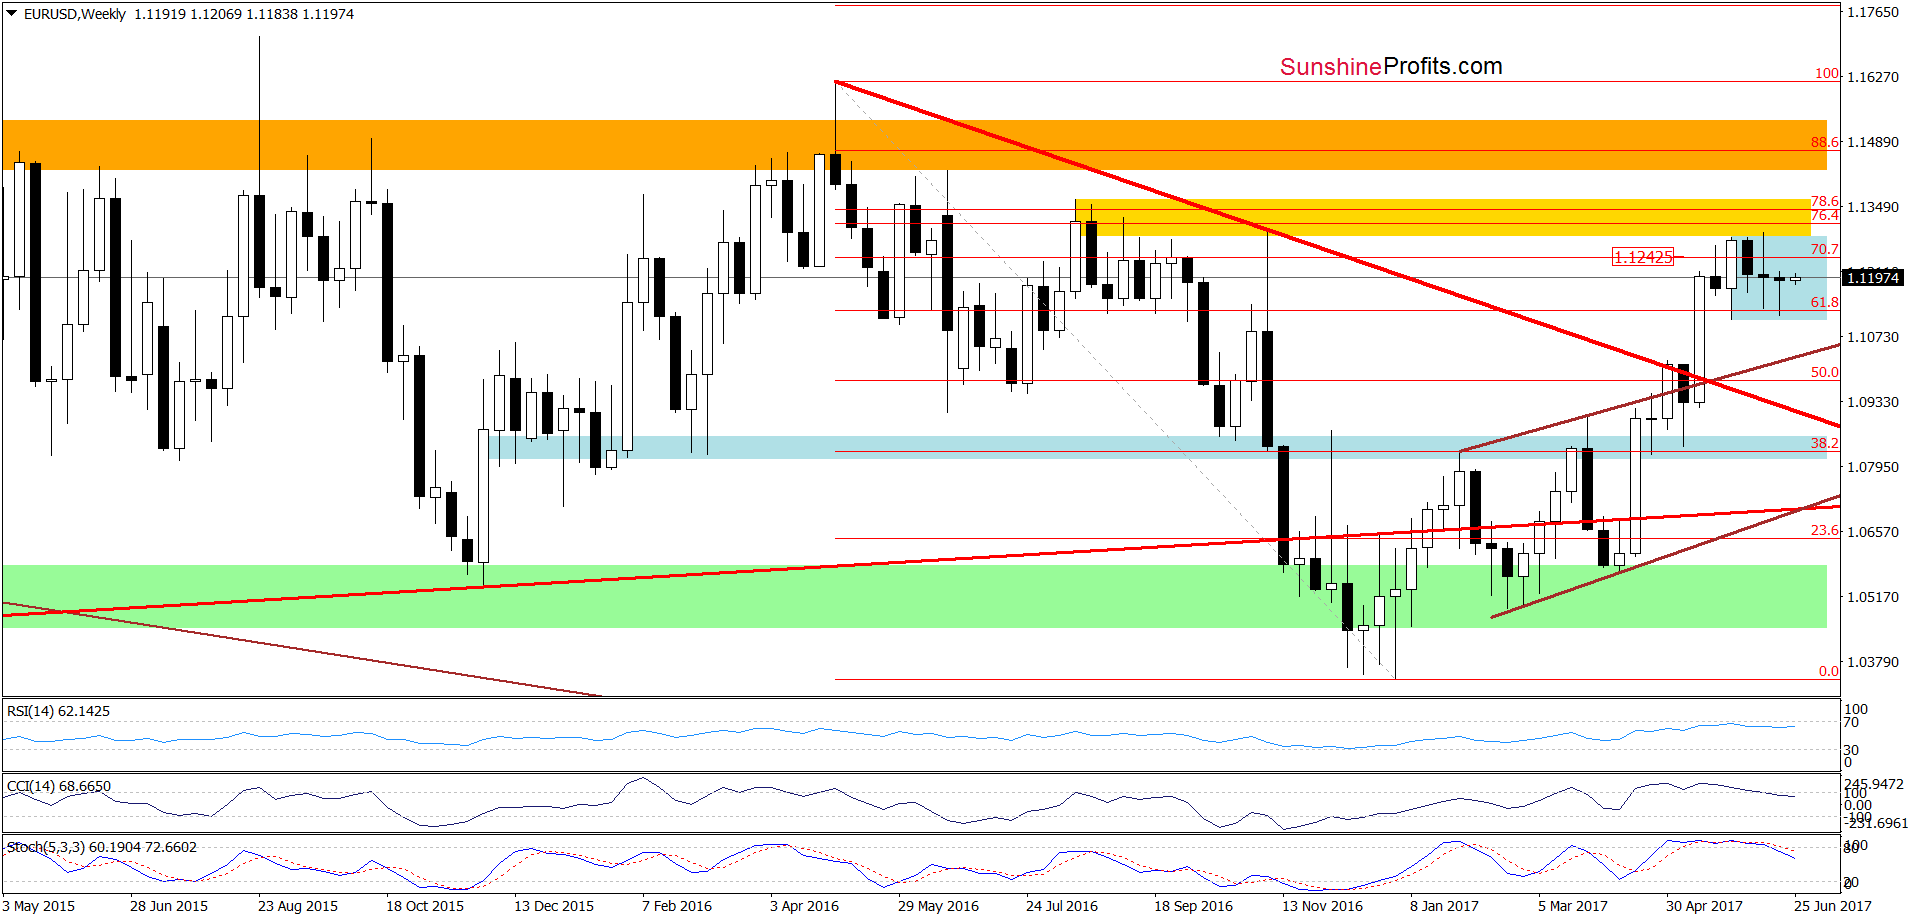
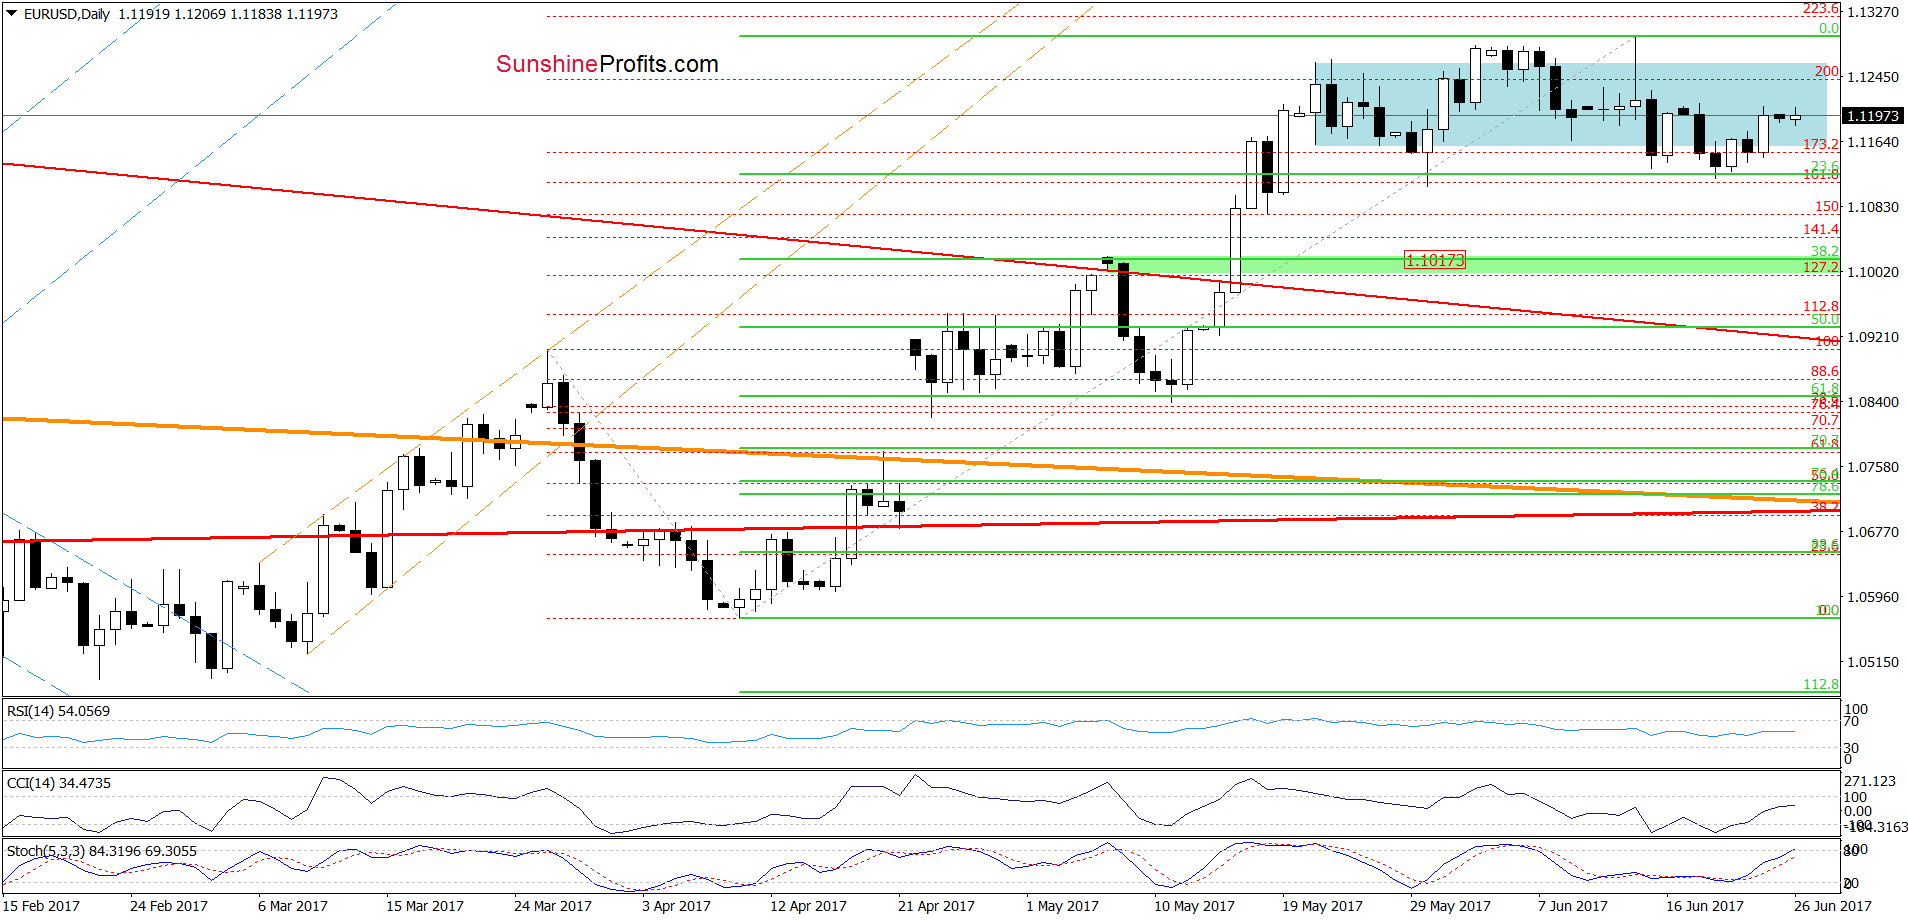
Looking at the above charts, we see that the overall situation hasn’t changed much as EUR/USD remains in the blue consolidation under the yellow resistance zone. Nevertheless, the sell signals generated by the weekly indicators are still in play, supporting currency bears and lower values of EUR/USD. Therefore, we think that another attempt to move lower may be just around the corner. If this is the case and the pair extends declines from current levels, the initial downside target will be around 1.1017, where the 38.2% Fibonacci retracement and the green support zone (marked on the daily chart) are.
Very short-term outlook: bearish
Short-term outlook: mixed with bearish bias
MT outlook: mixed
LT outlook: mixed
Trading position (short-term; our opinion): Short positions with a stop-loss order at 1.1402 and the initial downside target at 1.1009) are justified from the risk/reward perspective. We will keep you informed should anything change, or should we see a confirmation/invalidation of the above.
GBP/USD
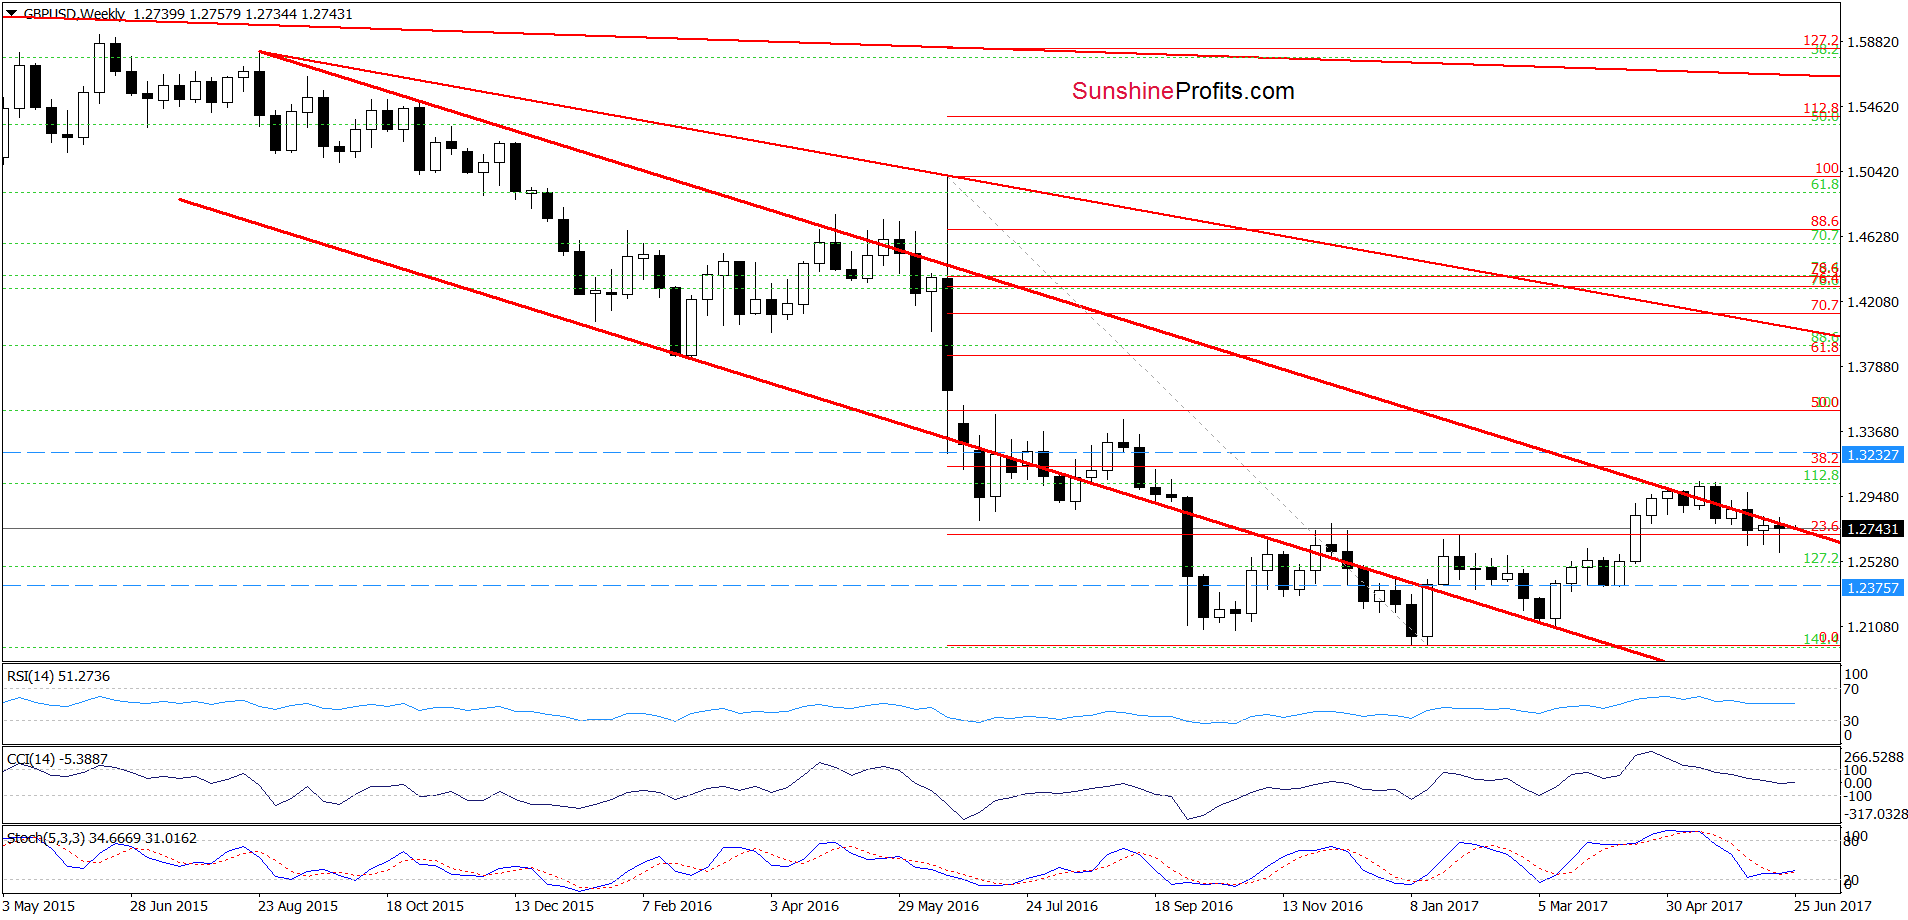
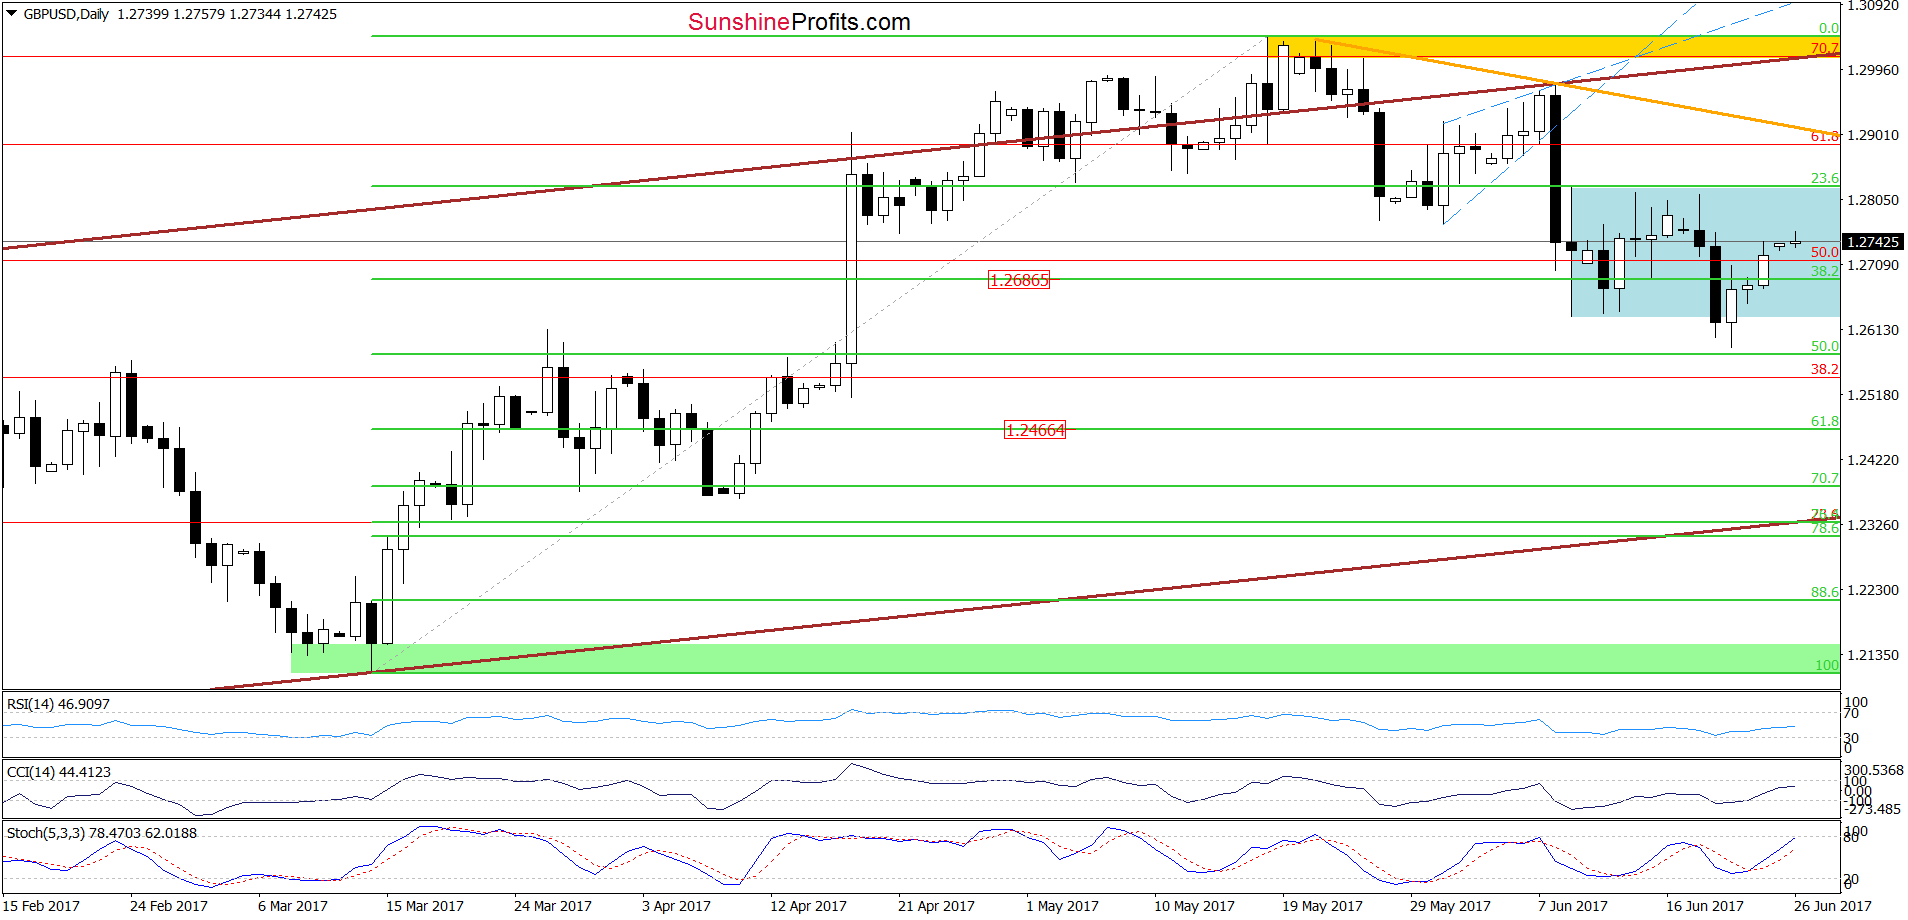
On the above charts, we see that GBP/USD remains in the blue consolidation under the long-term red declining resistance line marked on the weekly chart. Although the exchange rate rebounded in the previous week, the pair is still trading below the last week’s highs, which suggests that as long as there is no breakout above this area another downswing is likely. If this is the case and GBP/USD declines from current levels, we’ll likely see a test of the 50% or even 61.8% Fibonacci retracement (at 1.2466) in the coming week.
Very short-term outlook: bearish
Short-term outlook: mixed with bearish bias
MT outlook: mixed with bearish bias
LT outlook: mixed
Trading position (short-term; our opinion): Short positions (with a stop-loss order at 1.3232 and the initial downside target at 1.2375) are justified from the risk/reward perspective. We will keep you informed should anything change, or should we see a confirmation/invalidation of the above.
USD/CHF
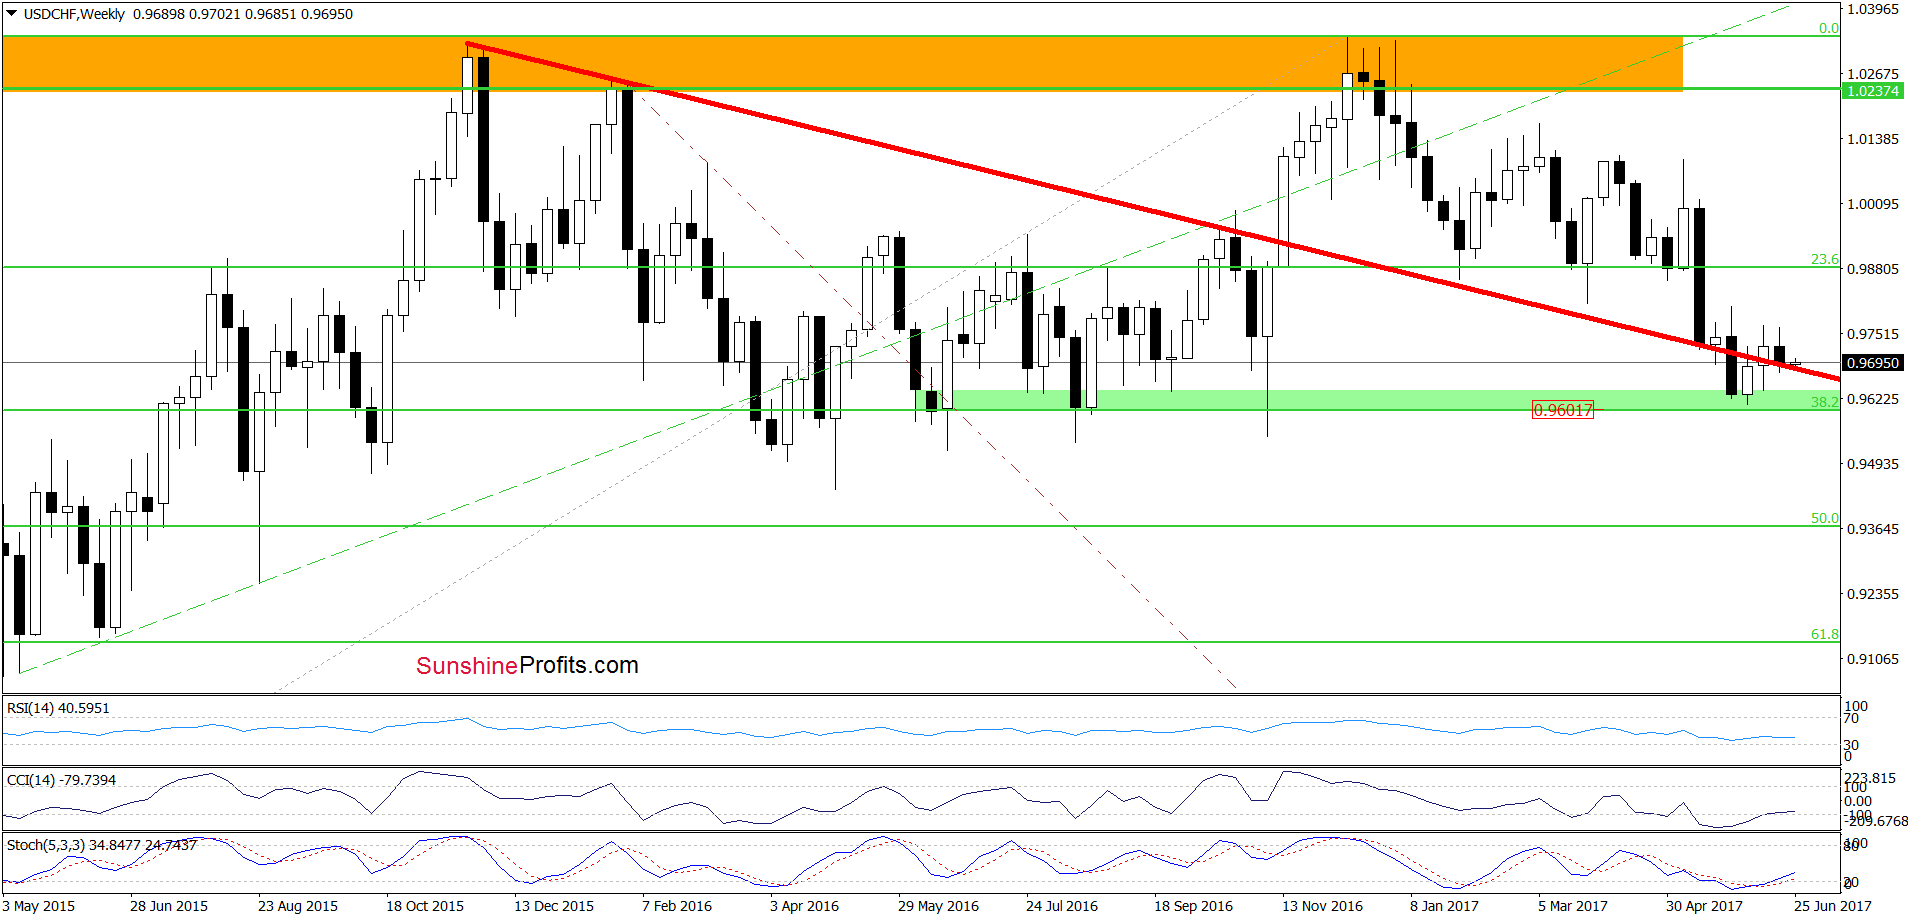
From the medium-term perspective, we see that although USD/CHF moved lower last week, the previously-broken red declining line (which serves as the nearest support at the moment) stopped currency bears. Additionally, the current position of the daily indictors suggests that reversal and higher values of USD/CHF in the coming week should not surprise us.
Having said that, let’s examine the daily chart.
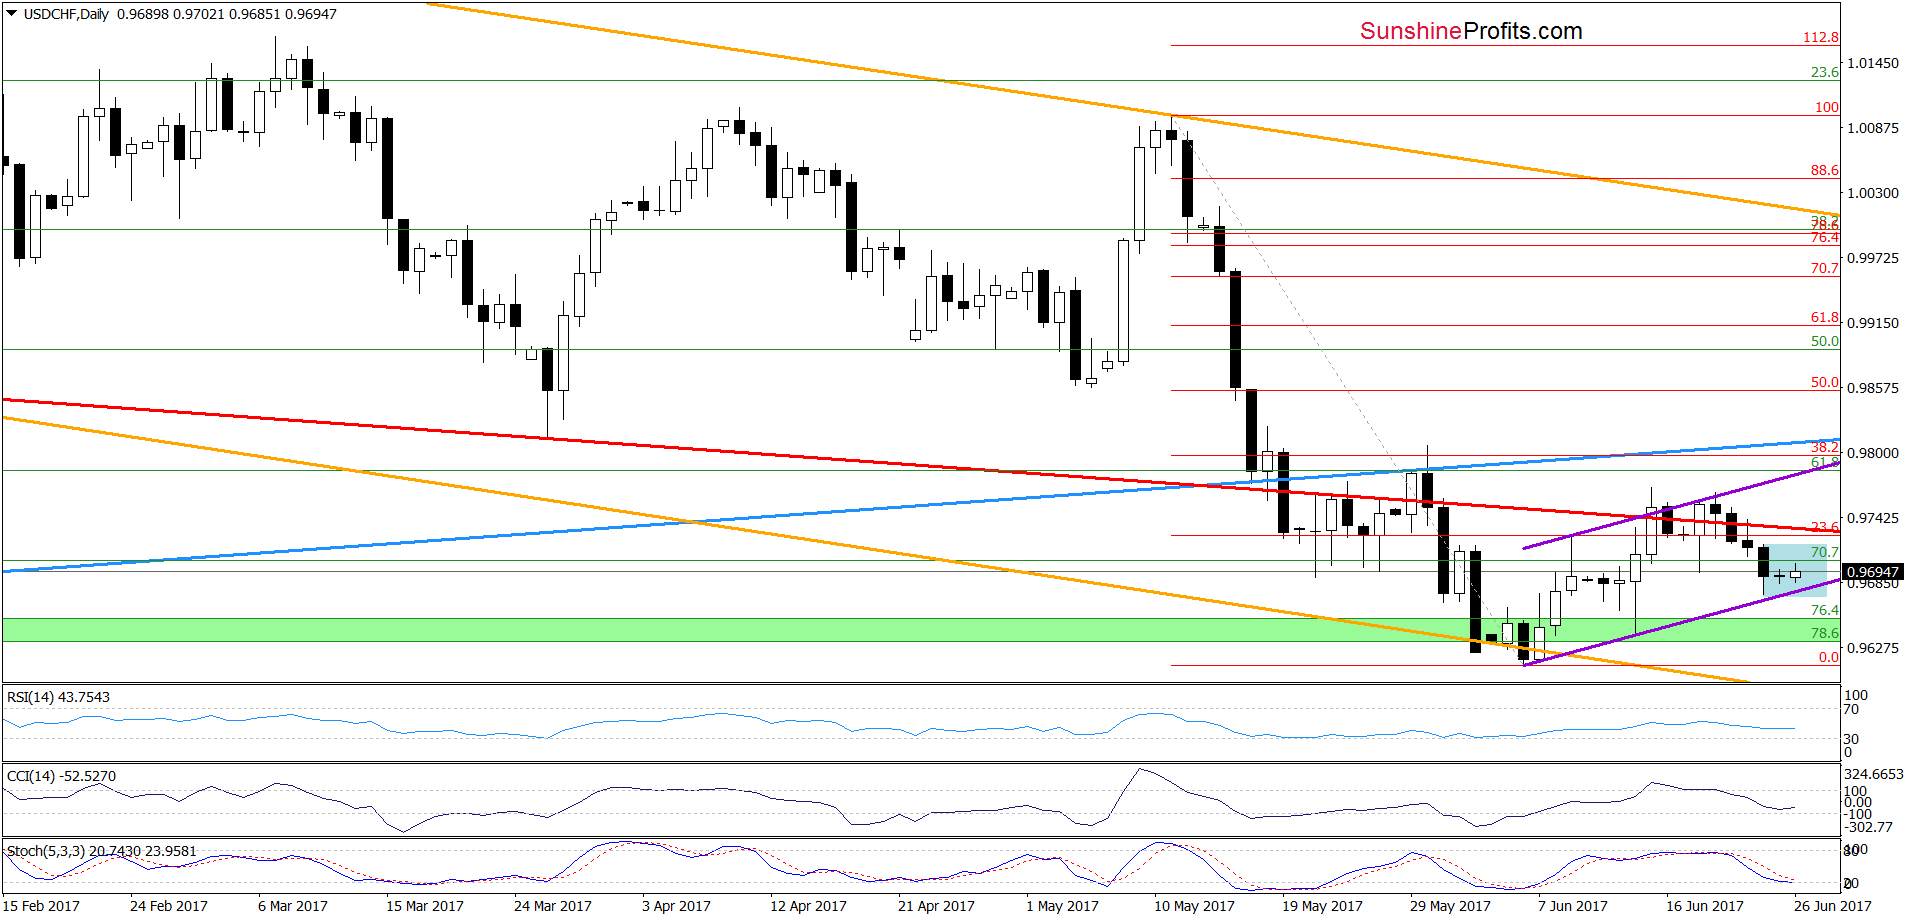
Quoting our last commentary on this currency pair:
(…) USD/CHF closed yesterday’s session under the red line (…) the indicators generated the sell signals, which could result in a test of the red support line (marked on the weekly chart) or even the lower border of the purple rising trend channel (marked on the daily chart) in the coming days.
From today’s point of view, we see that the situation developed in line with the above scenario and USD/CHF slipped to our downside targets. What’s next? Taking into account the medium-term picture and the proximity to the lower border of the purple rising trend channel, we think that rebound in the coming days is very likely. Therefore, if the exchange rate breaks above the upper line of the blue consolidation and the red declining line seen on the daily chart, we’ll likely see a test of the upper border of the purple rising trend channel.
Very short-term outlook: mixed with bullish bias
Short-term outlook: mixed with bullish bias
MT outlook: mixed
LT outlook: mixed
Trading position (short-term; our opinion): No positions are justified from the risk/reward perspective. We will keep you informed should anything change, or should we see a confirmation/invalidation of the above.
Thank you.
Nadia Simmons
Forex & Oil Trading Strategist
Przemyslaw Radomski, CFA
Founder, Editor-in-chief, Gold & Silver Fund Manager
Gold & Silver Trading Alerts
Forex Trading Alerts
Oil Investment Updates
Oil Trading Alerts

