

Earlier this week, the U.S. dollar moved higher against its Canadian counterpart, which resulted in an invalidation of the breakdown under the lower border of the trend channel. What impact could this event have on USD/CAD future moves?
In our opinion the following forex trading positions are justified - summary:
- EUR/USD: short (a stop-loss order at 1.1402; the initial downside target at 1.1009)
- GBP/USD: short (a stop-loss order at 1.3232; the initial downside target at 1.2375)
- USD/JPY: long (a stop-loss order at 107.62; the initial upside target at 113.08)
- USD/CAD: long (a stop-loss order at 1.2931; the initial upside target at 1.3436)
- USD/CHF: none
- AUD/USD: short (a stop-loss order at 0.7683; the initial downside target at 0.7444)
EUR/USD
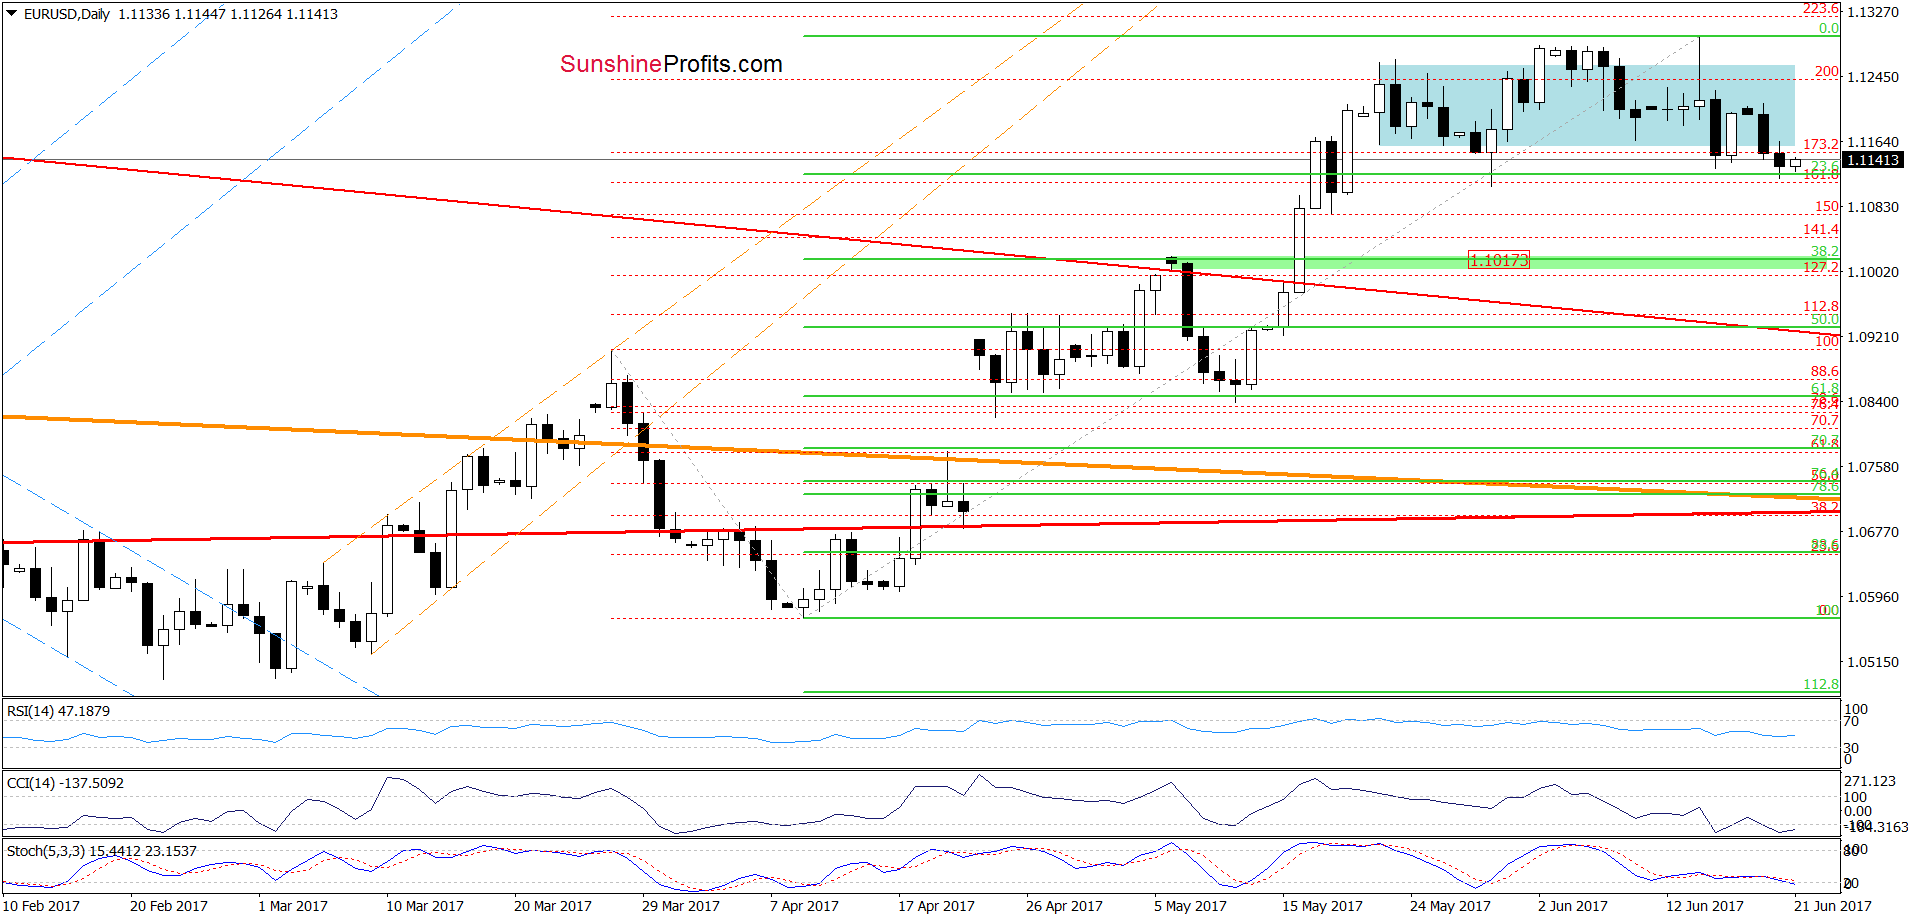
On the daily chart, we see that EUR/USD extended losses yesterday, which resulted in another daily closure below the lower border of the blue consolidation. Therefore, we think that our Monday’s commentary is up-to-date also today:
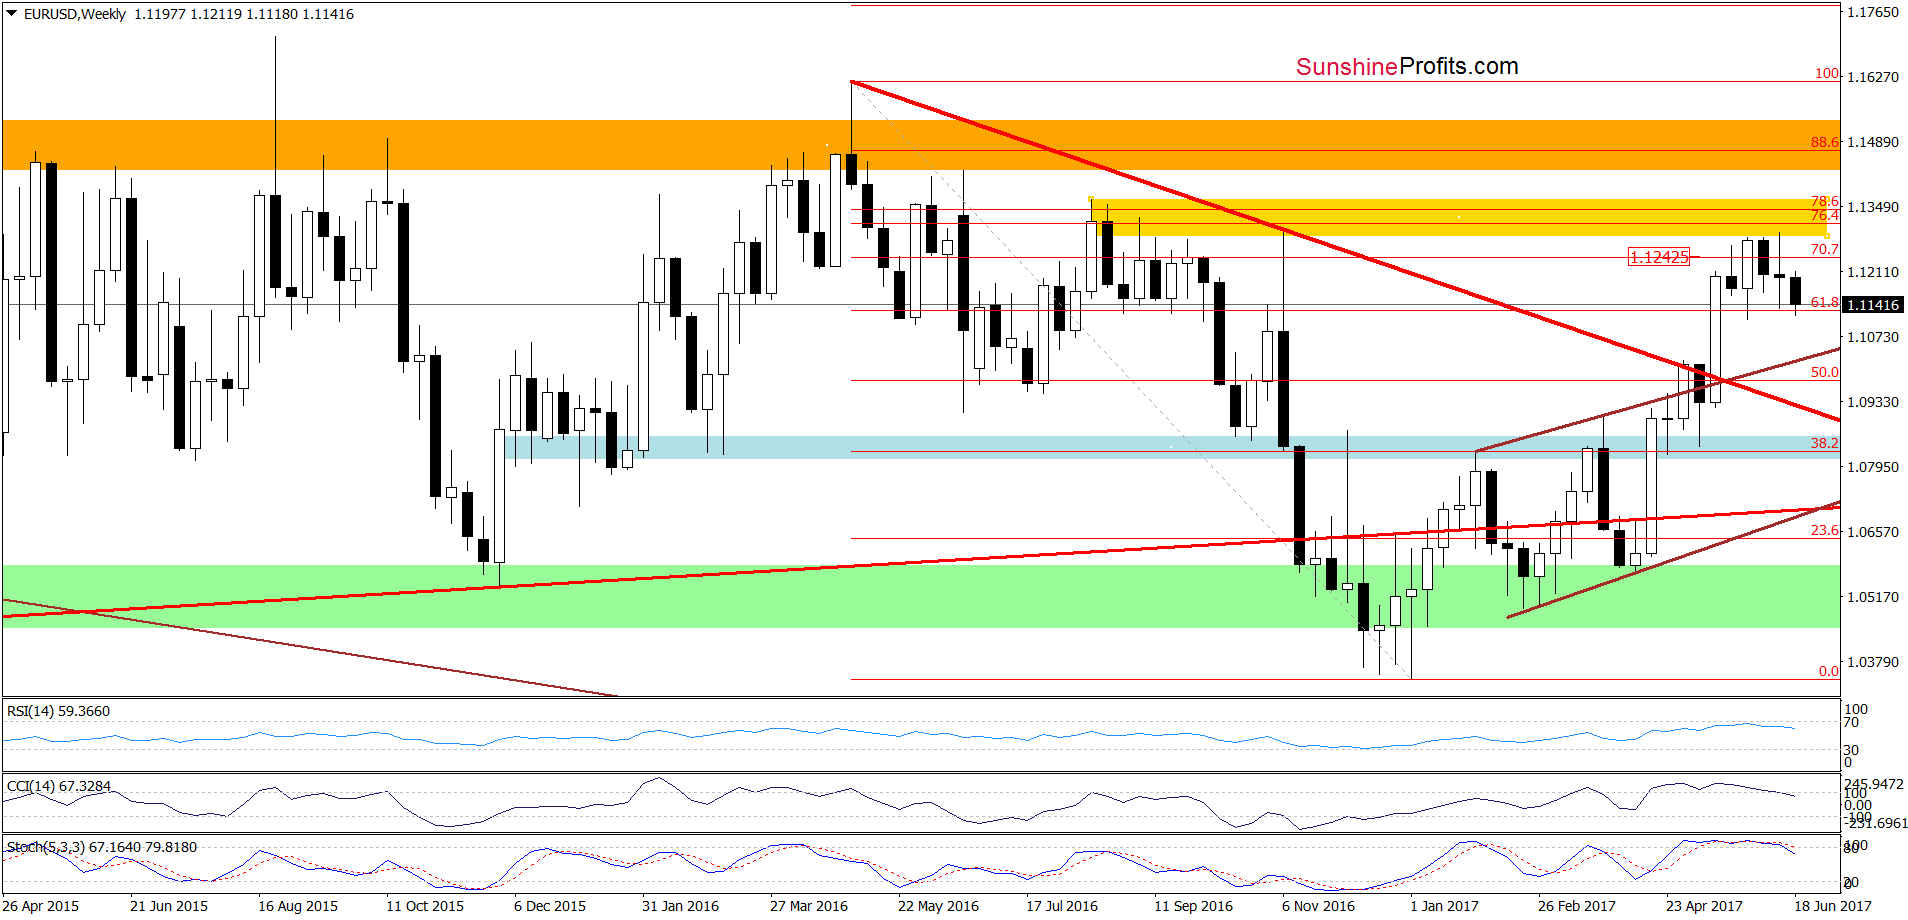
(…) the yellow resistance zone marked on the weekly chart continues to keep gains in check, which suggests that another downswing may be just around the corner. If this is the case and the pair extends declines from current levels, the initial downside target will be around 1.1017, where the 38.2% Fibonacci retracement and the green support zone (marked on the daily chart) are.
Very short-term outlook: bearish
Short-term outlook: mixed with bearish bias
MT outlook: mixed
LT outlook: mixed
Trading position (short-term; our opinion): Short positions with a stop-loss order at 1.1402 and the initial downside target at 1.1009) are justified from the risk/reward perspective. We will keep you informed should anything change, or should we see a confirmation/invalidation of the above.
USD/CAD
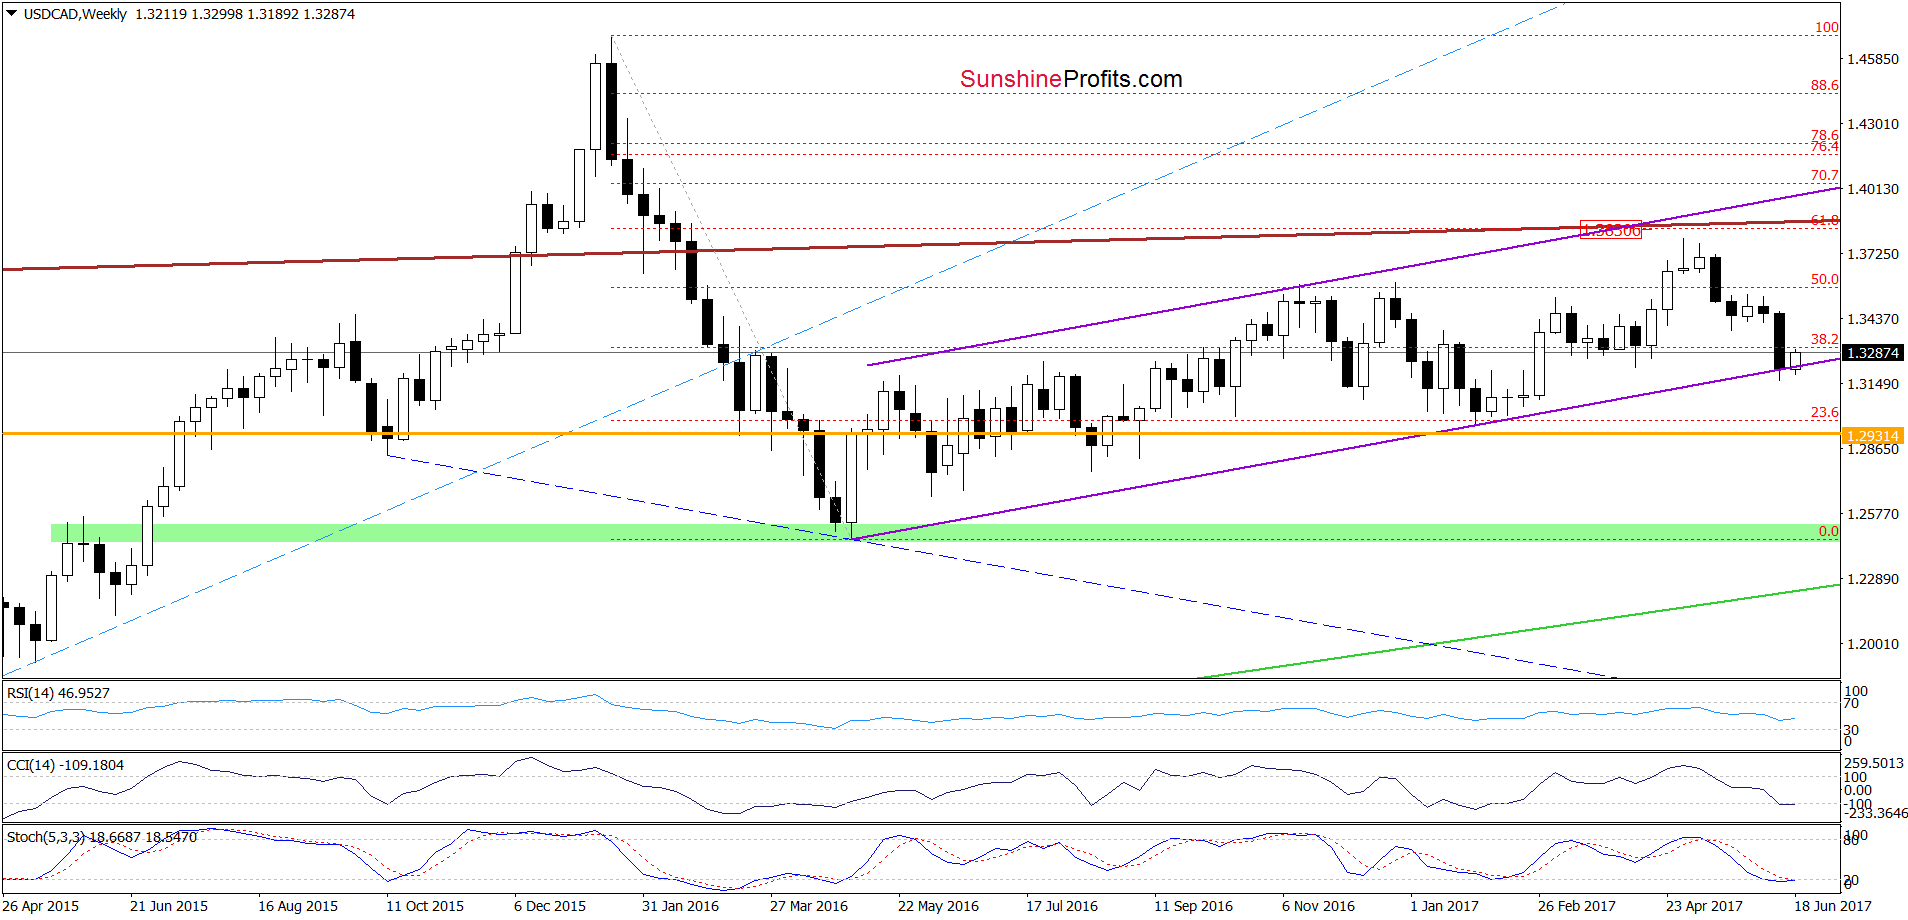
On the medium-term chart, we see that USD/CAD moved visibly higher and invalidated the earlier tiny breakdown under the lower border of the purple rising trend channel, which is a positive development – especially when we factor in the current position of the indicators (the CCI and Stochastic Oscillator are very close to generating buy signals).
What impact did this increase have on the very short-term chart? Let’s check.
On Monday, we wrote the following:
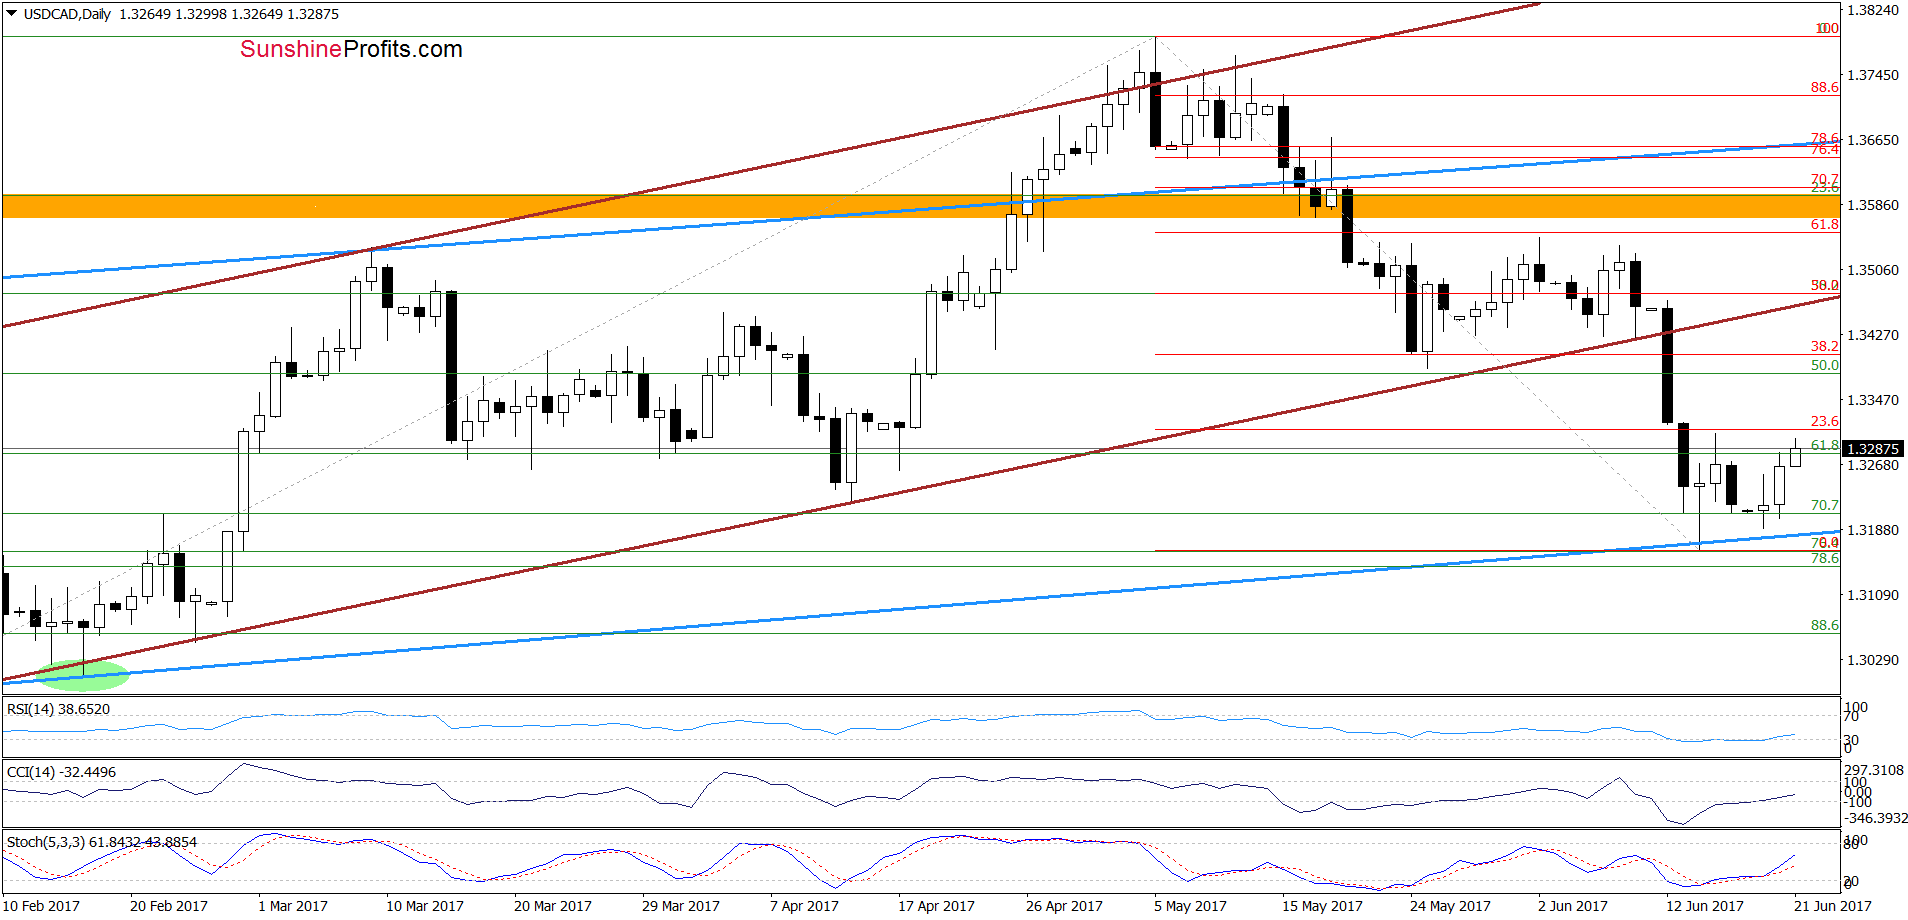
(…) the lower border of the purple rising trend channel (marked on the weekly chart) stopped currency bears. Additionally, the buy signals generated by the CCI and the Stochastic Oscillator are still in play, supporting another attempt to move higher in the coming week. If this is the case, and we see an increase from current levels, the initial upside target will be around 1.3452, where the previously-broken lower border of the brown rising trend channel (seen on the daily chart) is.
From today’s point of view, we see that currency bulls pushed USD/CAD higher (as we had expected), which together with the buy signals and the medium-term picture suggests that further improvement is just around the corner – especially if the exchange rate breaks above the last week’s high. In this case, we’ll see an increase to the 38.2% Fibonacci retracement (based on the entire May-June downward move) around 1.3402 or even a test of the previously-broken lower border of the brown rising trend channel.
Very short-term outlook: bullish
Short-term outlook: mixed with bullish bias
MT outlook: mixed
LT outlook: mixed
Trading position (short-term; our opinion): Long positions with a stop-loss order at 1.2931 and the initial upside target at 1.3436 are justified from the risk/reward perspective at the moment. We will keep you informed should anything change, or should we see a confirmation/invalidation of the above.
AUD/USD
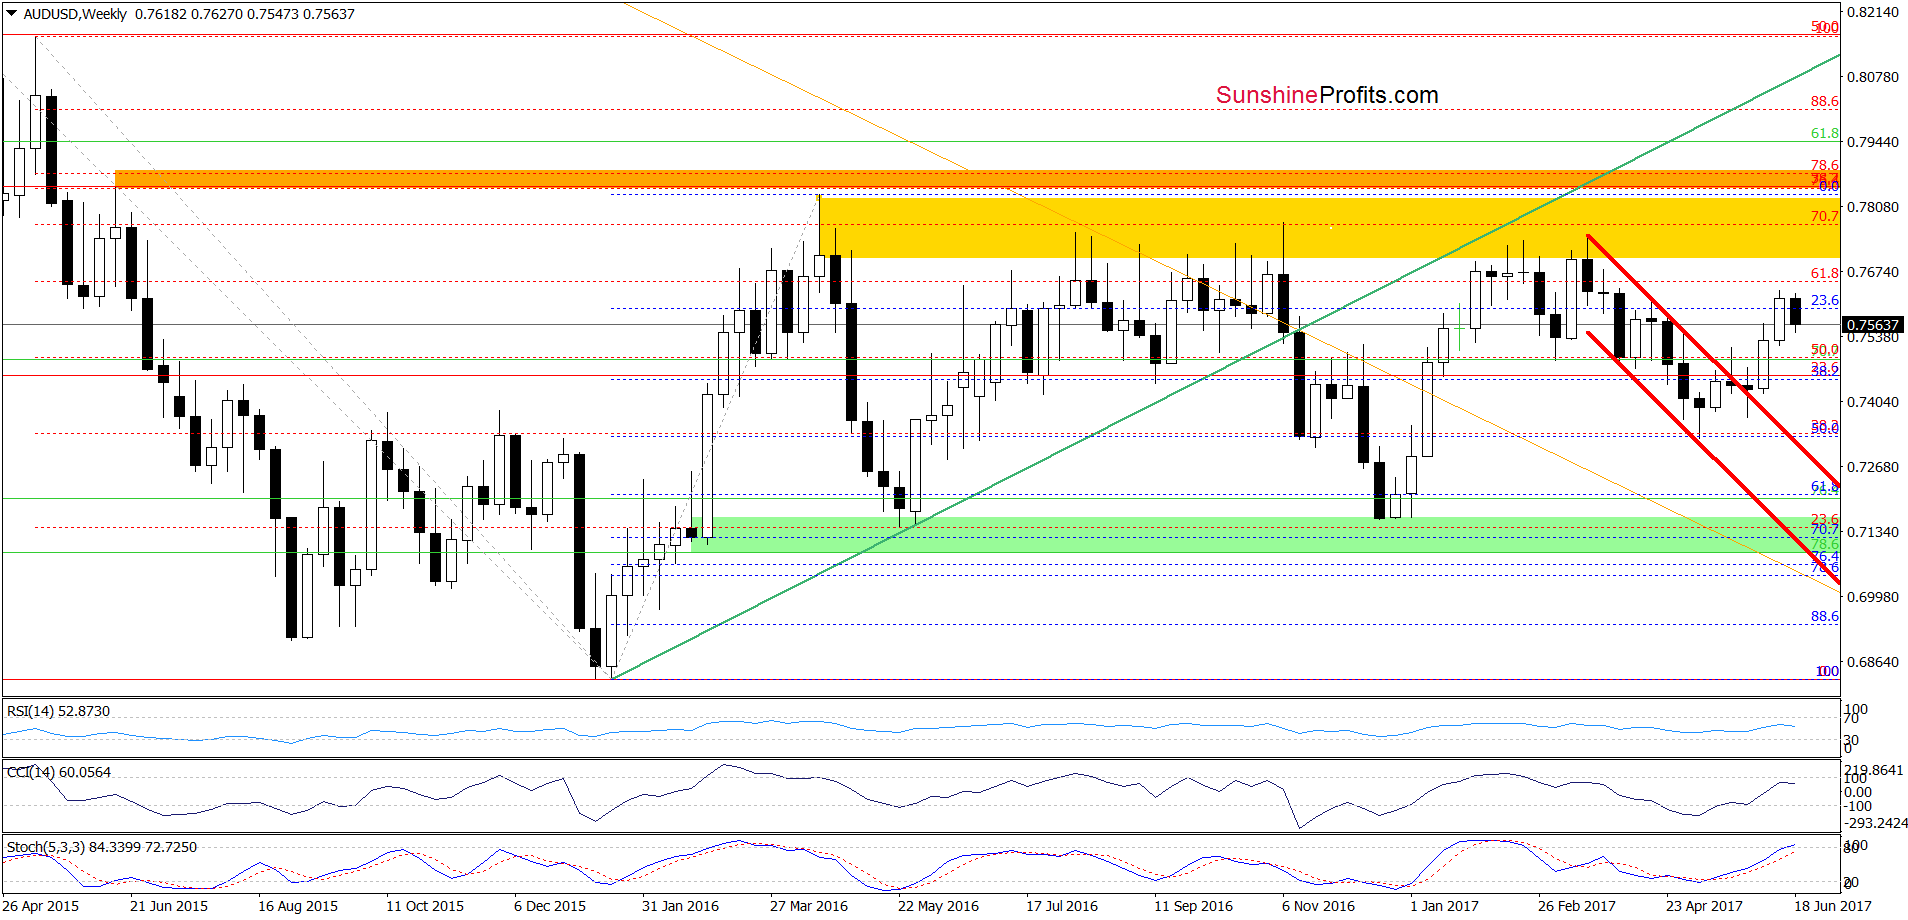
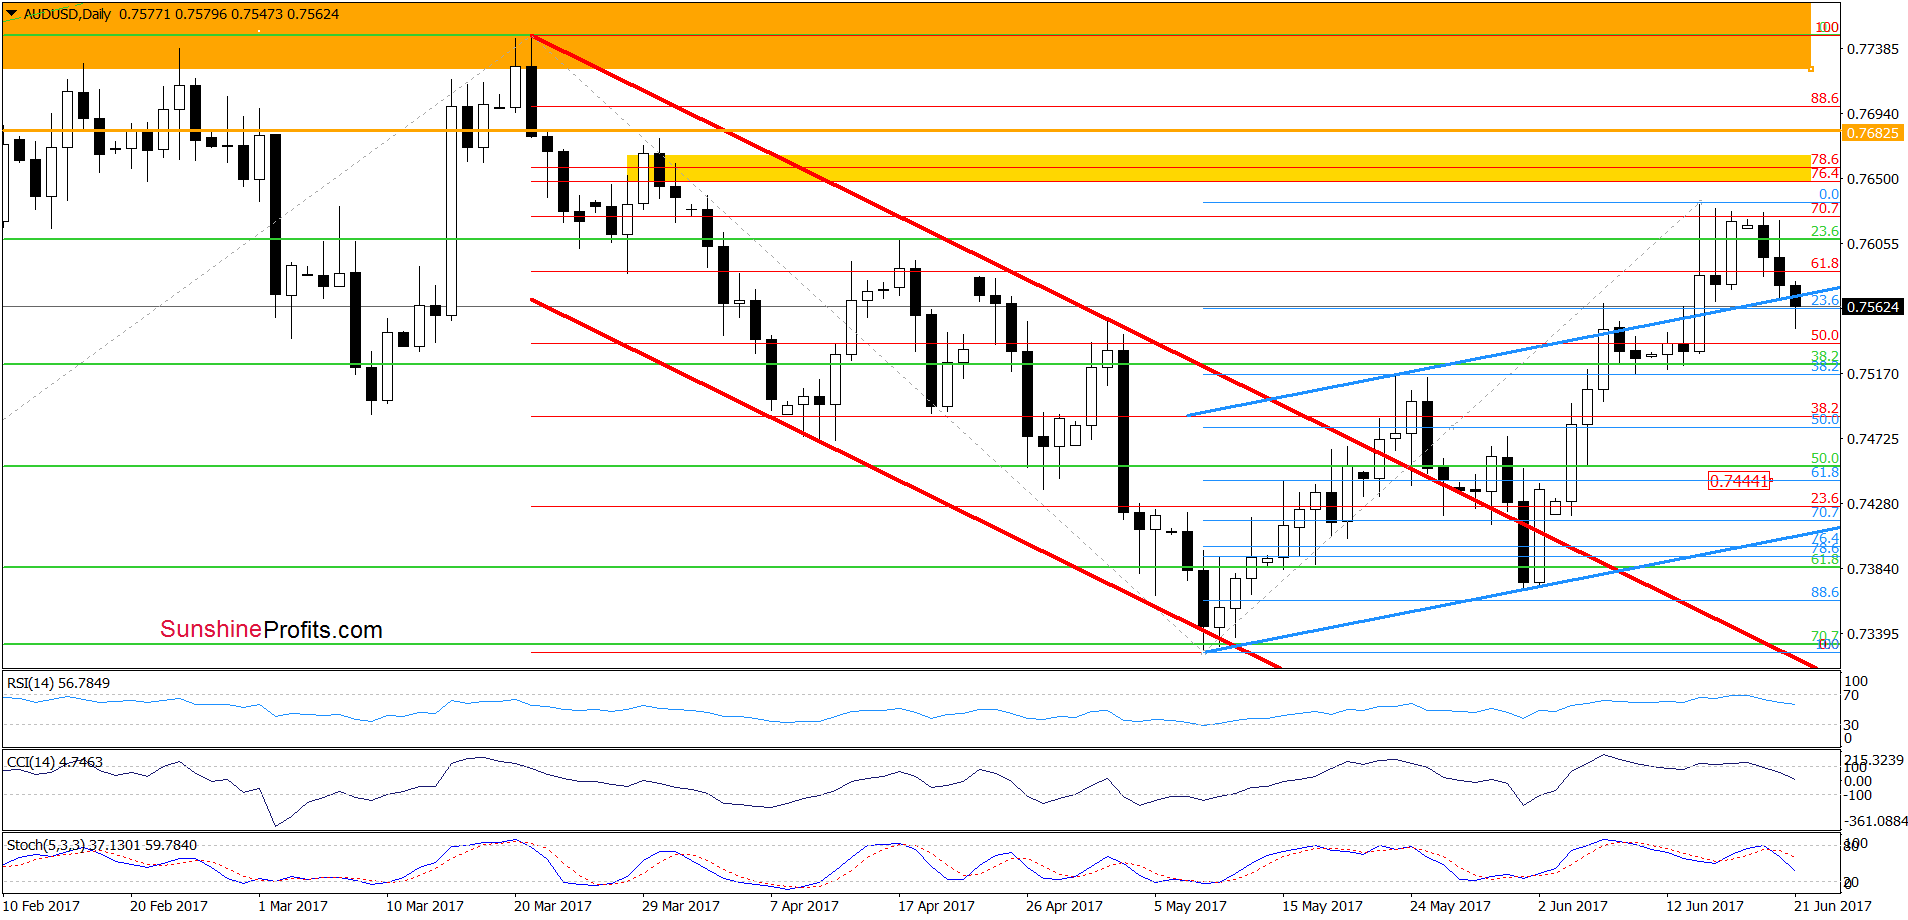
Looking at the daily chart, we see that AUD/USD moved lower and slipped under the previously-broken upper border of the blue rising trend channel. Additionally, all indicators generated the sell signals, supporting currency bears and lower values of AUD/USD. How low could the exchange rate go? In our opinion, the initial downside target will be around 0.7444, where the 61.8% Fibonacci retracement is. However, if this support is broken, the next target will be the lower border of the blue rising trend channel (currently around 0.7405). Taking all the above into account, we believe that opening short positions is justified from the risk/reward perspective.
Very short-term outlook: bearish
Short-term outlook: mixed with bearish bias
MT outlook: mixed
LT outlook: mixed
Trading position (short-term; our opinion): Short positions (with a stop-loss order at 0.7683 and the initial downside target at 0.7444) are justified from the risk/reward perspective. We will keep you informed should anything change, or should we see a confirmation/invalidation of the above.
Thank you.
Nadia Simmons
Forex & Oil Trading Strategist
Przemyslaw Radomski, CFA
Founder, Editor-in-chief, Gold & Silver Fund Manager
Gold & Silver Trading Alerts
Forex Trading Alerts
Oil Investment Updates
Oil Trading Alerts

