

Earlier today, USD/CAD broke below the 38.2% Fibonacci retracement. How low could the exchange rate go in the coming days?
In our opinion the following forex trading positions are justified - summary:
- EUR/USD: none
- GBP/USD: none
- USD/JPY: long (a stop-loss order at 107.62; the initial upside target at 111.16)
- USD/CAD: none
- USD/CHF: none
- AUD/USD: none
EUR/USD
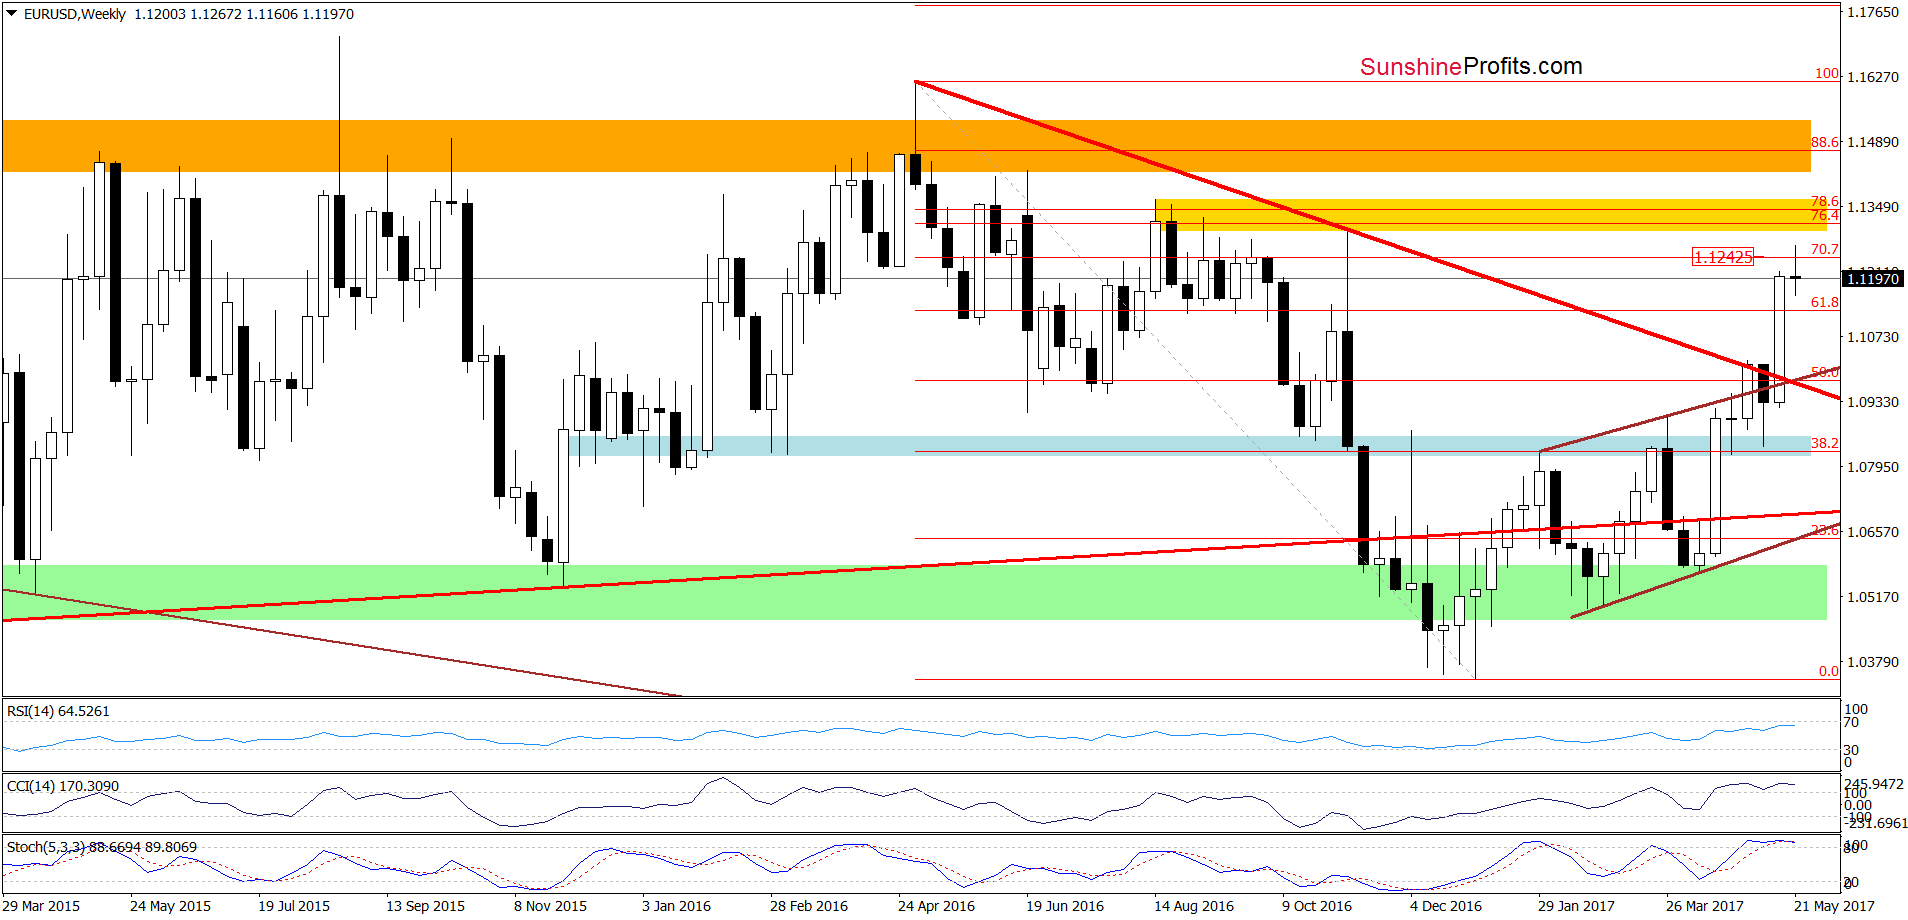
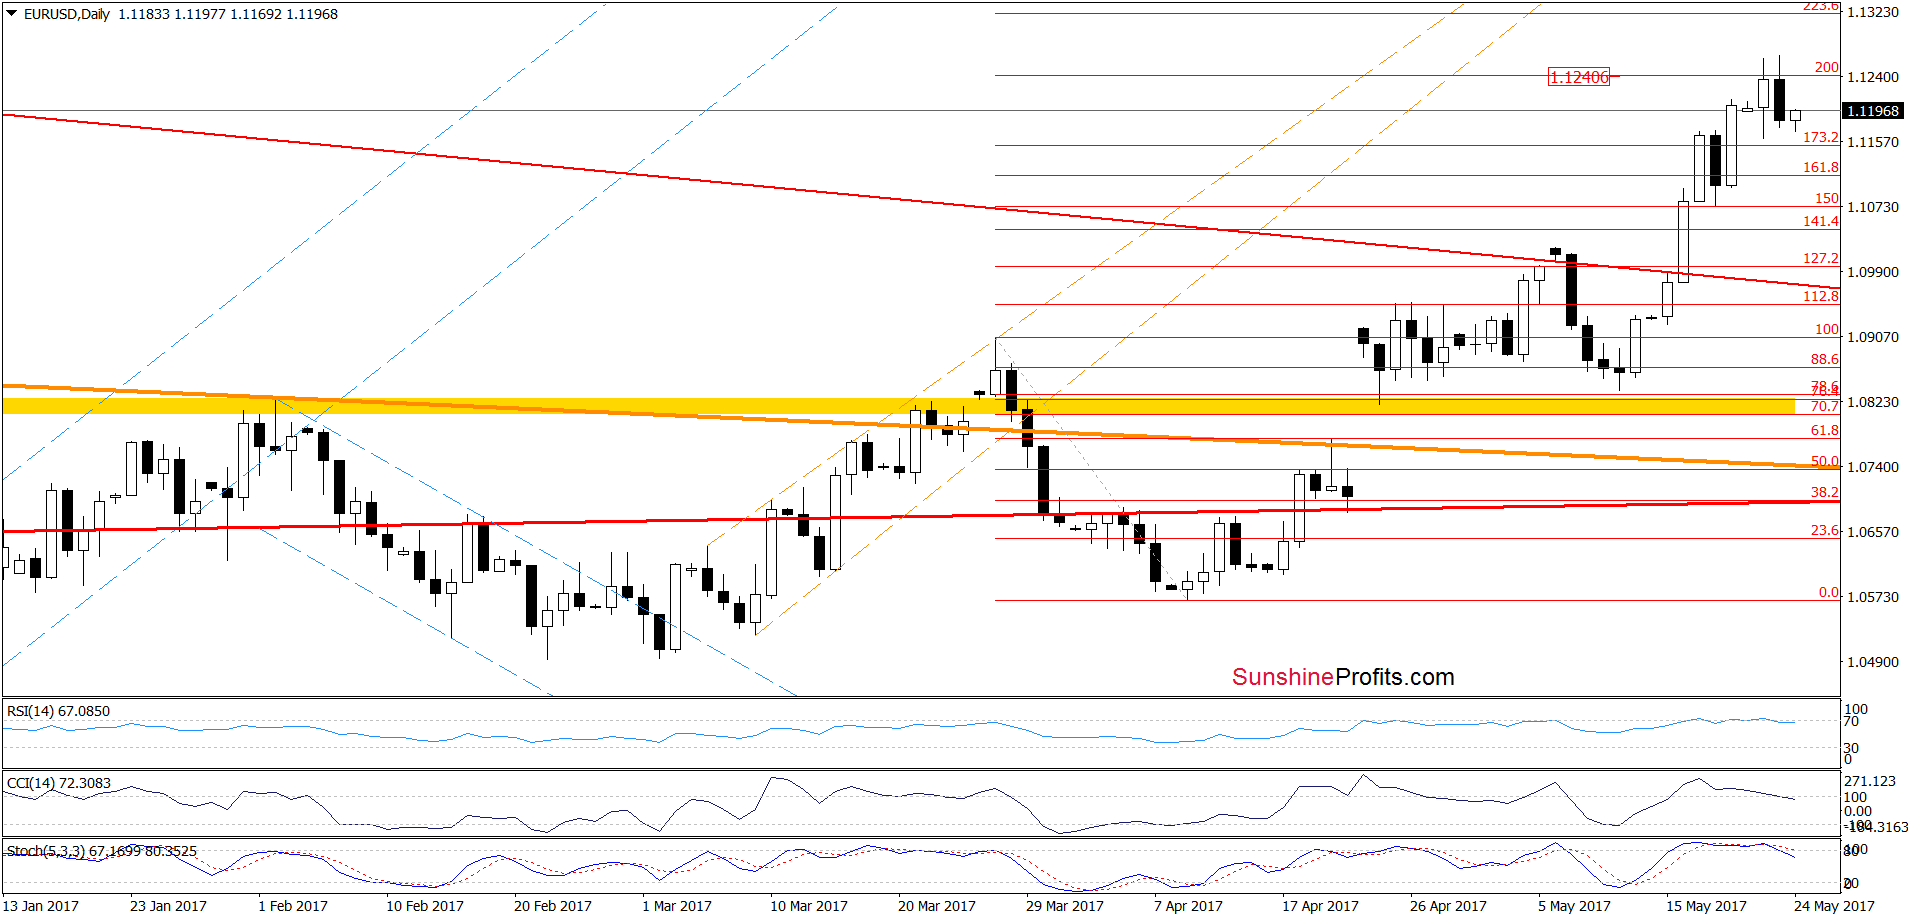
Looking at the daily chart, we see that although EUR/USD moved a bit higher earlier today, the exchange rate is still trading under 200% Fibonacci extension and the 70.7% Fibonacci retracement (marked on the weekly chart), which means that what we wrote yesterday is still valid:
(…) EUR/USD reached upside targets as we had expected. Although this is a bullish development, we should keep in mind that daily and weekly indicators are overbought and very close to generating sell signal, which increases the probability of reversal and lower values of EUR/USD in the coming days.
Very short-term outlook: mixed
Short-term outlook: mixed with bearish bias
MT outlook: mixed
LT outlook: mixed
Trading position (short-term; our opinion): No positions are justified from the risk/reward perspective. We will keep you informed should anything change, or should we see a confirmation/invalidation of the above.
GBP/USD
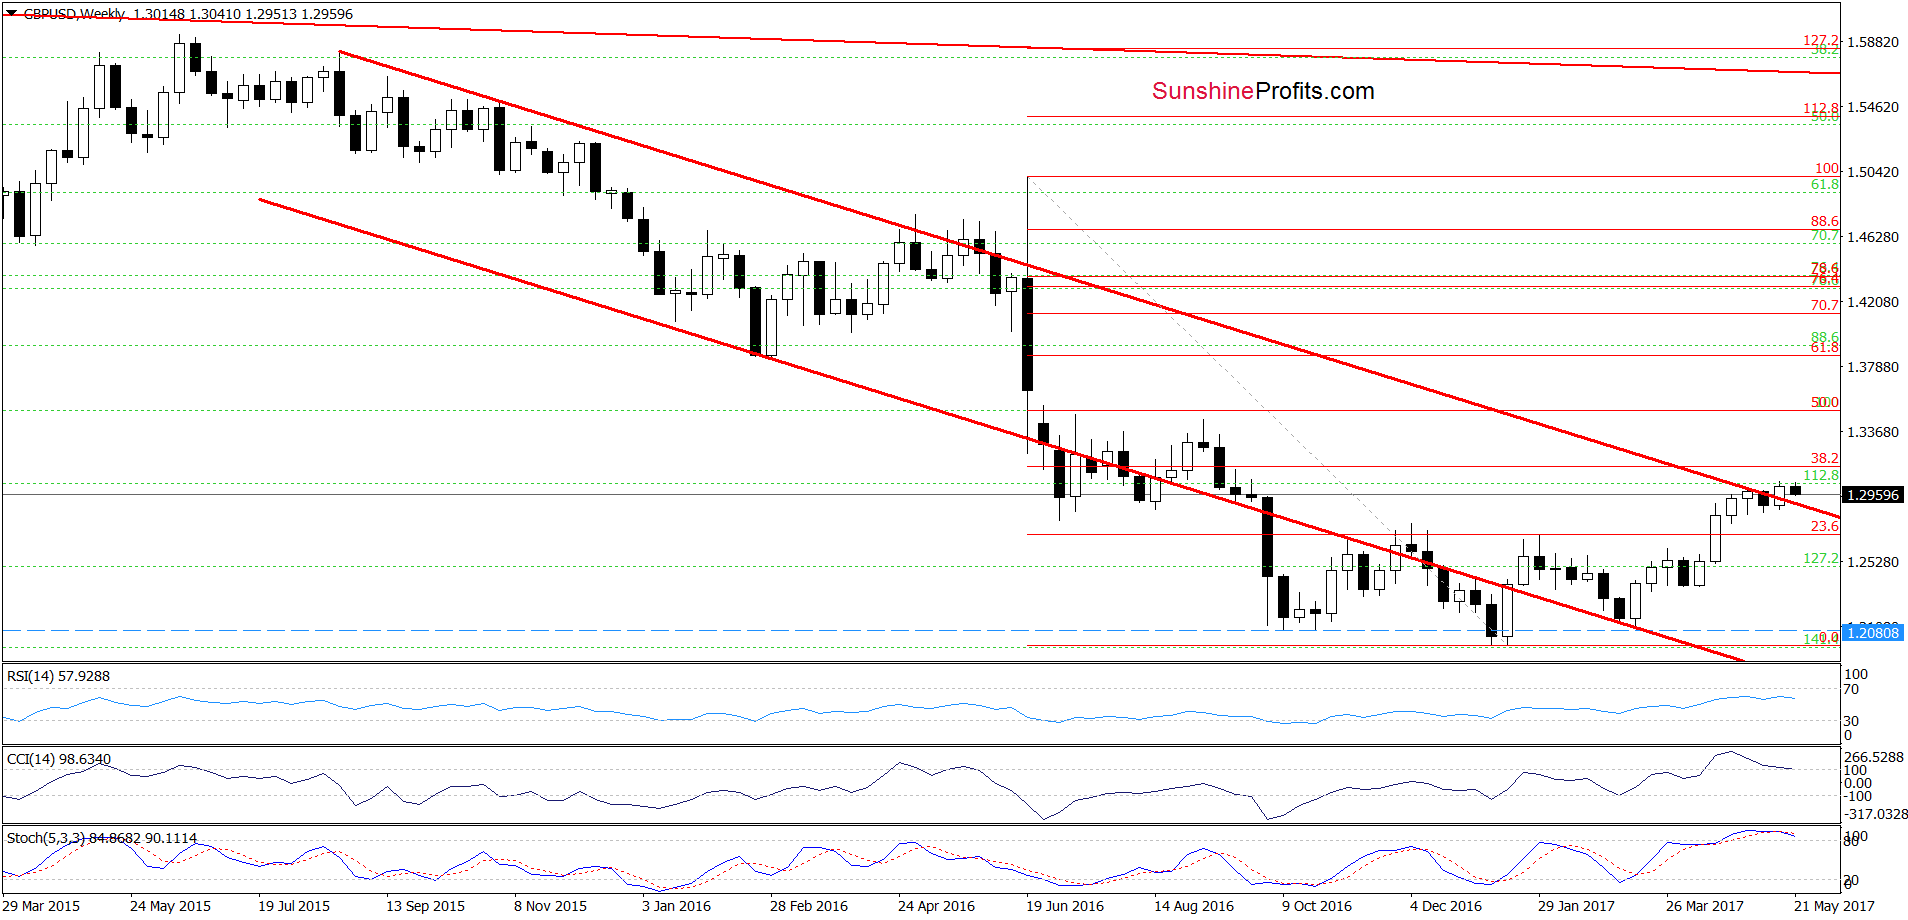
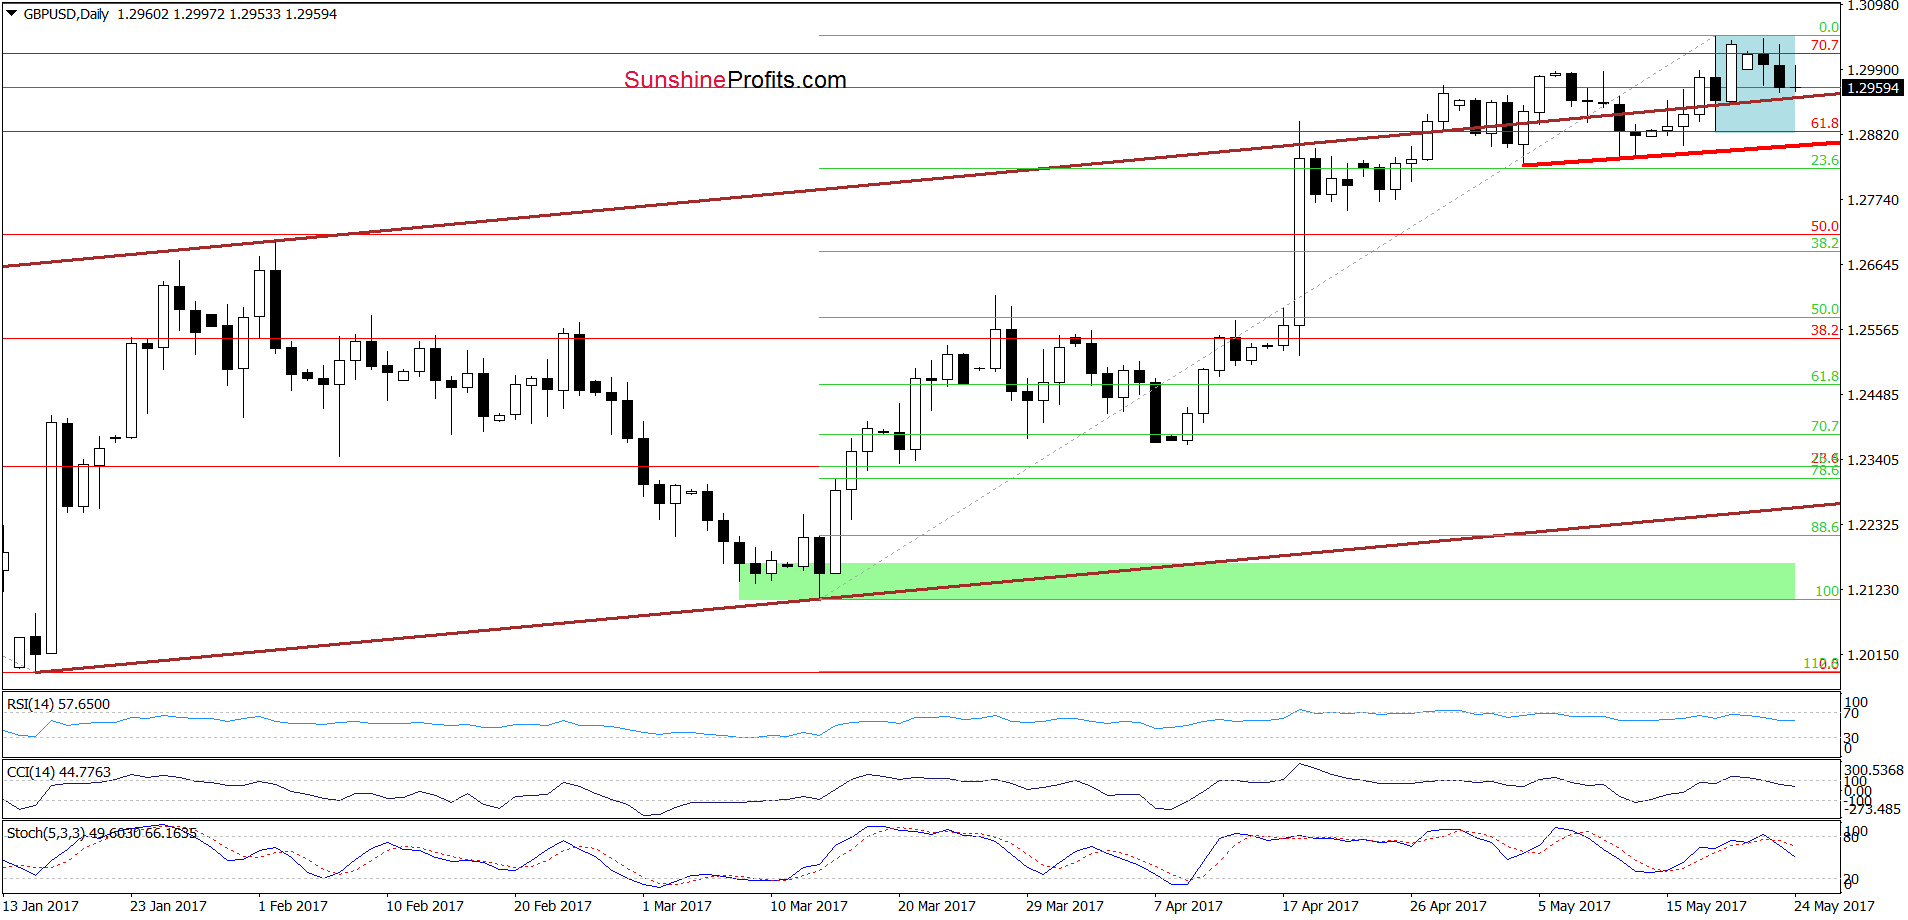
From today’s point of view, we see that although GBP/USD moved little lower earlier today, the pair remains in the blue consolidation above the upper border of the brown rising trend channel. Nevertheless, all indicators generated the sell signals, which suggest that reversal may be just around the corner. Therefore, if he pair drops under the lower border of the consolidation, the upper line of the brown rising trend channel and the red support line based on the previous lows, we’ll see further deterioration. In this case, we’ll likely open short positions.
Very short-term outlook: mixed
Short-term outlook: mixed with bearish bias
MT outlook: mixed
LT outlook: mixed
Trading position (short-term; our opinion): No positions are justified from the risk/reward perspective. We will keep you informed should anything change, or should we see a confirmation/invalidation of the above.
USD/CAD
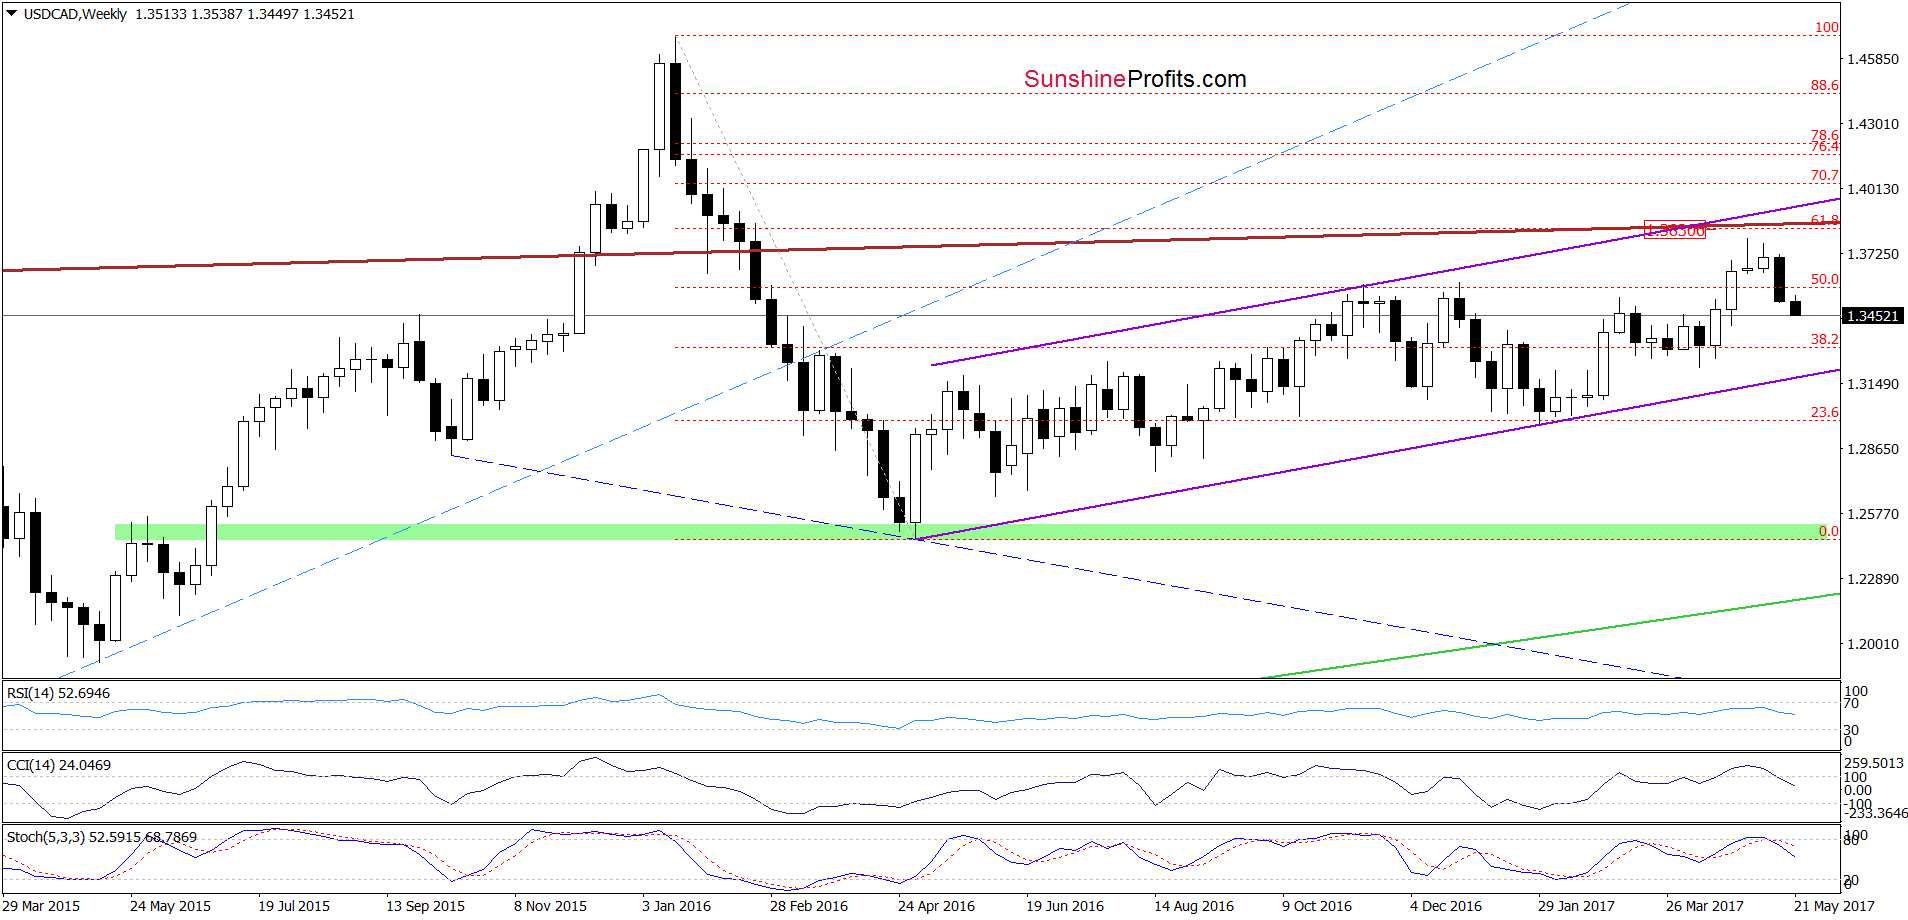
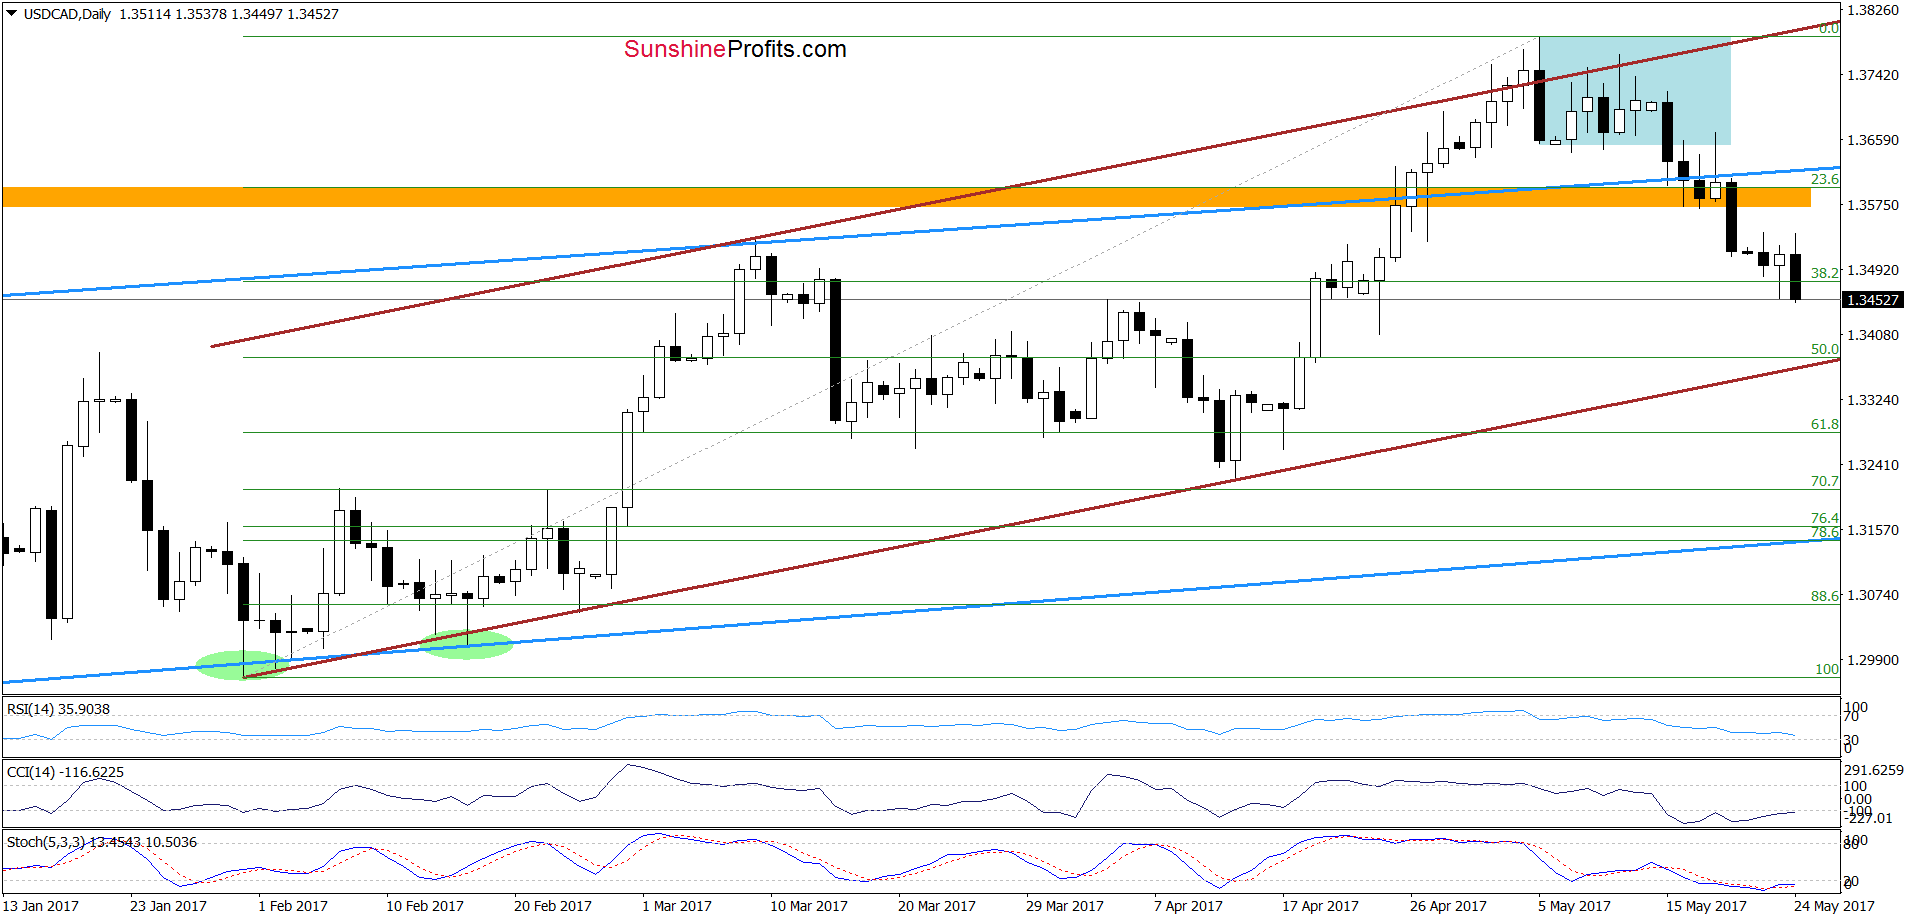
On the daily chart, we see that USD/CAD broke below the 38.2% Fibonacci retracement based on the entire January-May upward move, which means that what we wrote about this currency pair on Monday is up-to-date:
(…) it seems to us that the par will extend losses and test the 38.2% Fibonacci retracement based on the entire January-May upward move. If this support is broken, we’ll see a decline to the next Fibonacci retracement and the lower border of the brown rising trend channel. However, the current position of the daily indictors indicates that reversal in the coming week should not surprise us.
Very short-term outlook: mixed with bearish bias
Short-term outlook: mixed
MT outlook: mixed
LT outlook: mixed
Trading position (short-term; our opinion): No positions are justified from the risk/reward perspective. We will keep you informed should anything change, or should we see a confirmation/invalidation of the above.
Thank you.
Nadia Simmons
Forex & Oil Trading Strategist
Przemyslaw Radomski, CFA
Founder, Editor-in-chief, Gold & Silver Fund Manager
Gold & Silver Trading Alerts
Forex Trading Alerts
Oil Investment Updates
Oil Trading Alerts

