

Earlier this week, the British pound moved sharply higher against the greenback, which pushed GBP/USD to a fresh 2017 peak and resulted in a climb to resistance levels. Will they manage to stop currency bulls in the coming week?
In our opinion the following forex trading positions are justified - summary:
- EUR/USD: short (a stop-loss order at 1.0967; the initial downside target at 1.0521)
- GBP/USD: none
- USD/JPY: long (a stop-loss order at 107.62; the initial upside target at 111.16)
- USD/CAD: none
- USD/CHF: none
- AUD/USD: none
EUR/USD
Yesterday, we wrote the following:
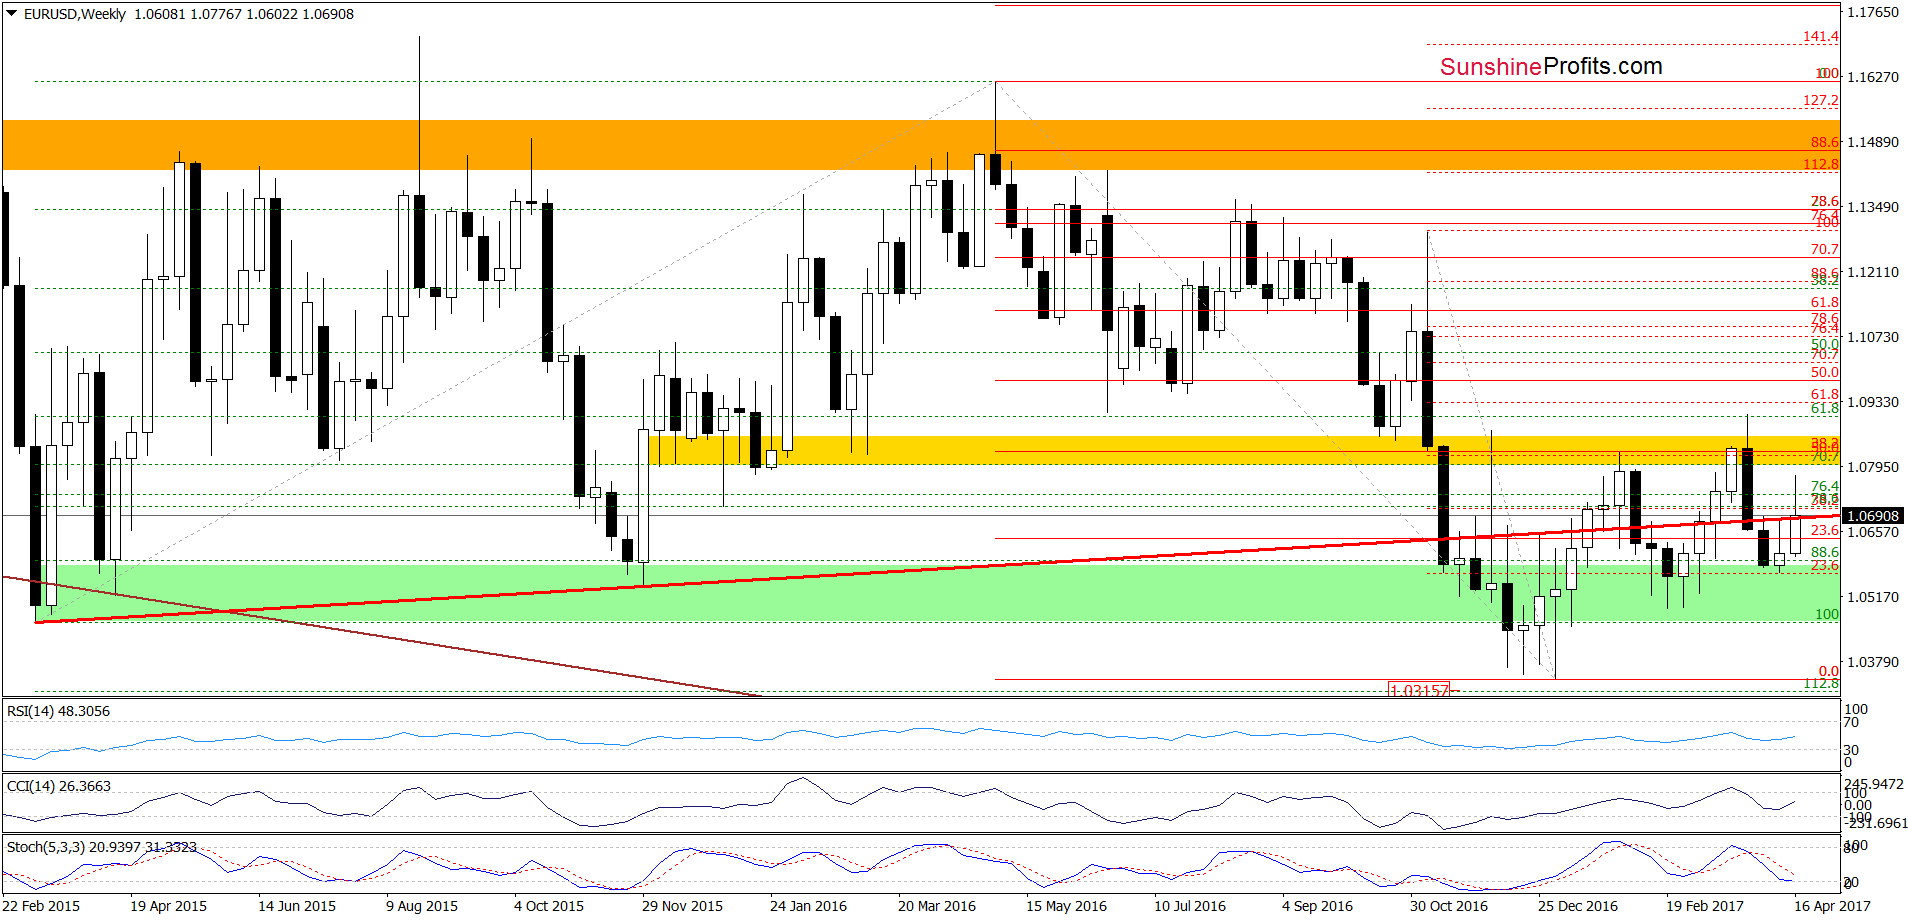
(…) EUR/USD extended gains and climbed to the previously-broken orange resistance line (based on the December and February highs) and the 61.8% Fibonacci retracement based on the entire March-April downward move, which could stop further improvement – especially when we factor in the proximity to the yellow resistance zone and the current position of the daily indicators.
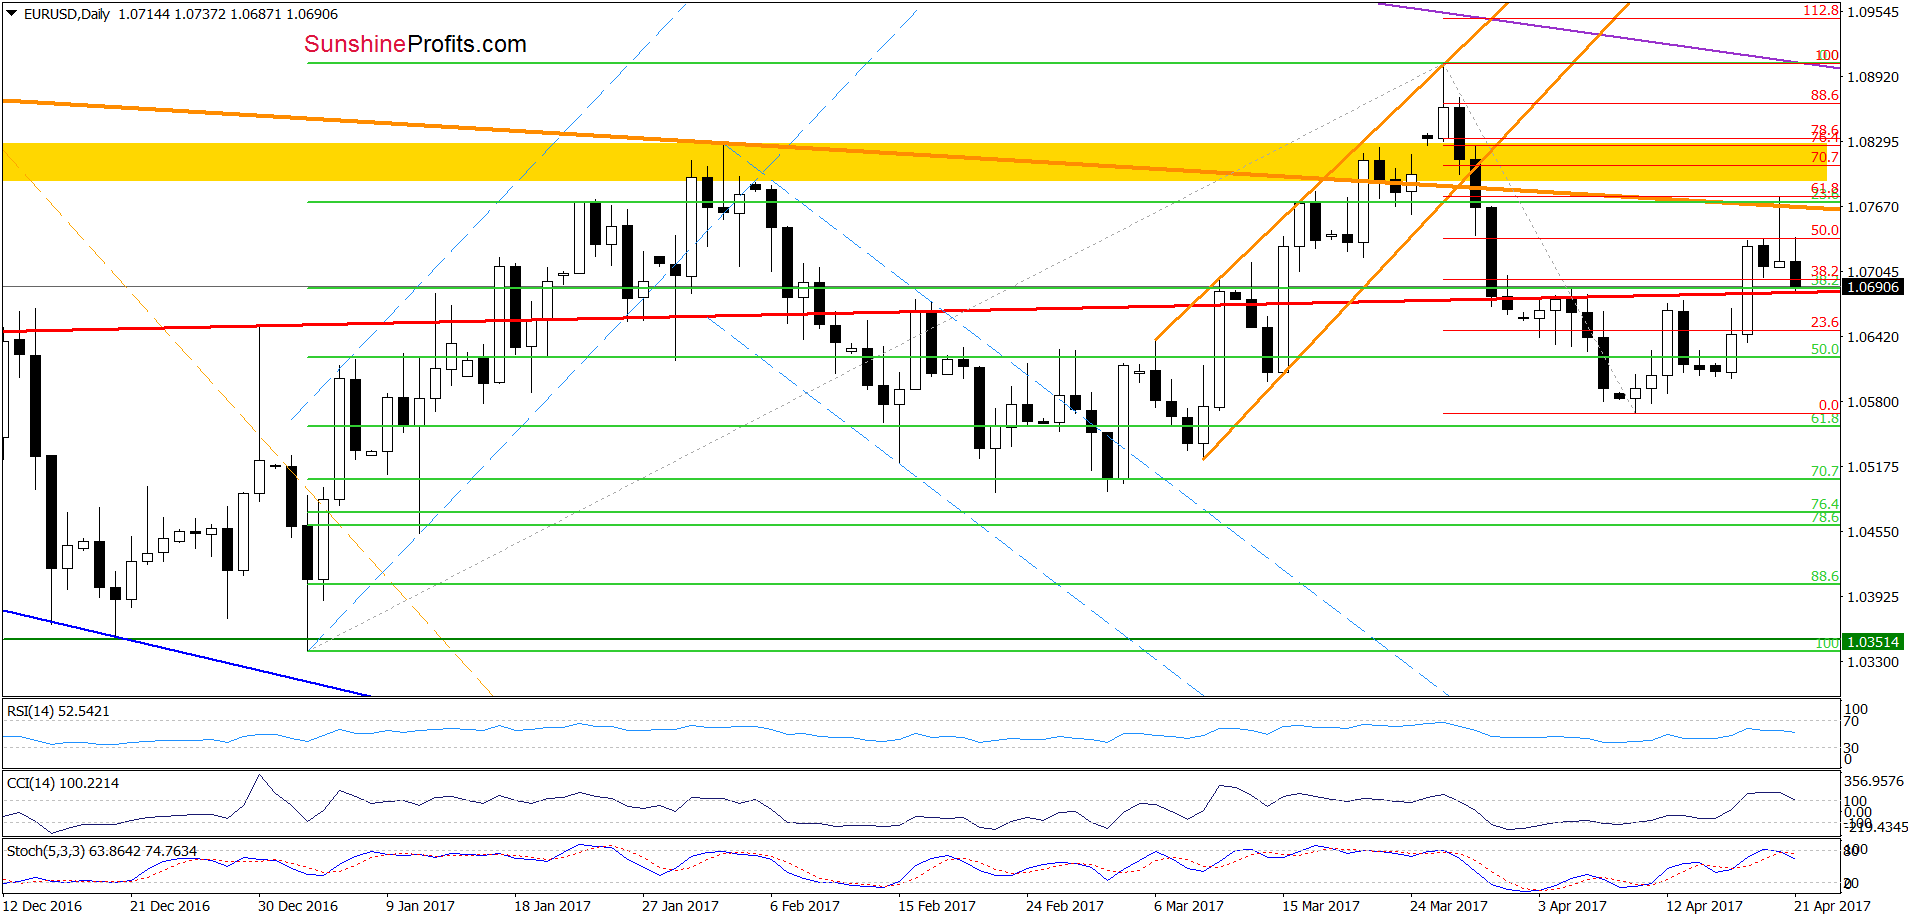
On the daily chart, we see that the situation developed in tune with our yesterday’s assumptions and EUR/USD reversed, invalidating a tiny breakout above the orange resistance line. This event triggered further deterioration, which took the exchange rate to the previously-broken long-term red support/resistance line earlier today.
What’s next? At the first sight, today’s drop looks like a verification of the earlier breakout above this line. However, the Stochastic Oscillator generated the sell signal, suggesting further deterioration, while the CCI is very close to doing the same. Taking these facts into account, it seems that the pair will extend declines in the coming days. Nevertheless, such price action will be more likely and reliable if EUR/USD closes today’s session under the above-mentioned red line.
Very short-term outlook: bearish
Short-term outlook: mixed with bearish bias
MT outlook: mixed
LT outlook: mixed
Trading position (short-term; our opinion): Short positions (with a stop-loss order at 1.0967 and the initial downside target at 1.0521) are justified from the risk/reward perspective. We will keep you informed should anything change, or should we see a confirmation/invalidation of the above.
GBP/USD
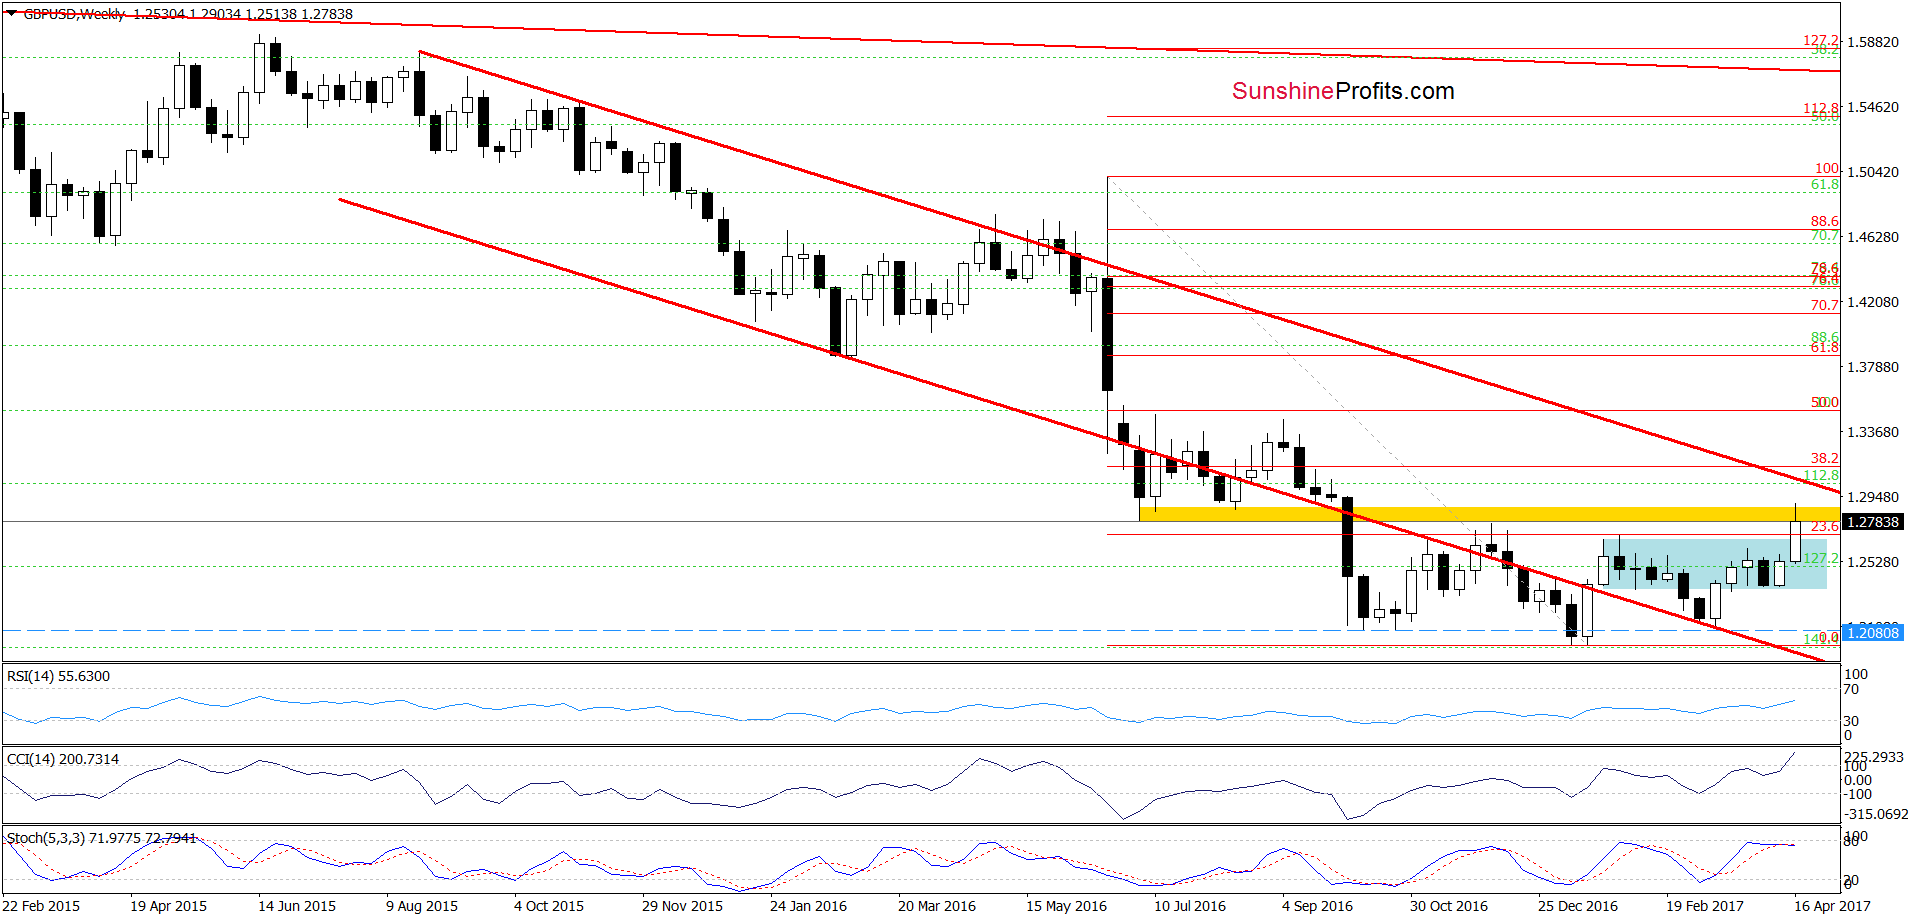
Looking at the daily chart, we see that GBP/USD extended gains and broke above the upper line of the consolidation, reaching the yellow resistance zone. This area was strong enough to stop currency bulls at the beginning of Ddecember, which together with the current position of the weekly indicators suggest that we may see a reversal in the coming week.
How did this ncrease affect the very short-term chart? Let’s check.
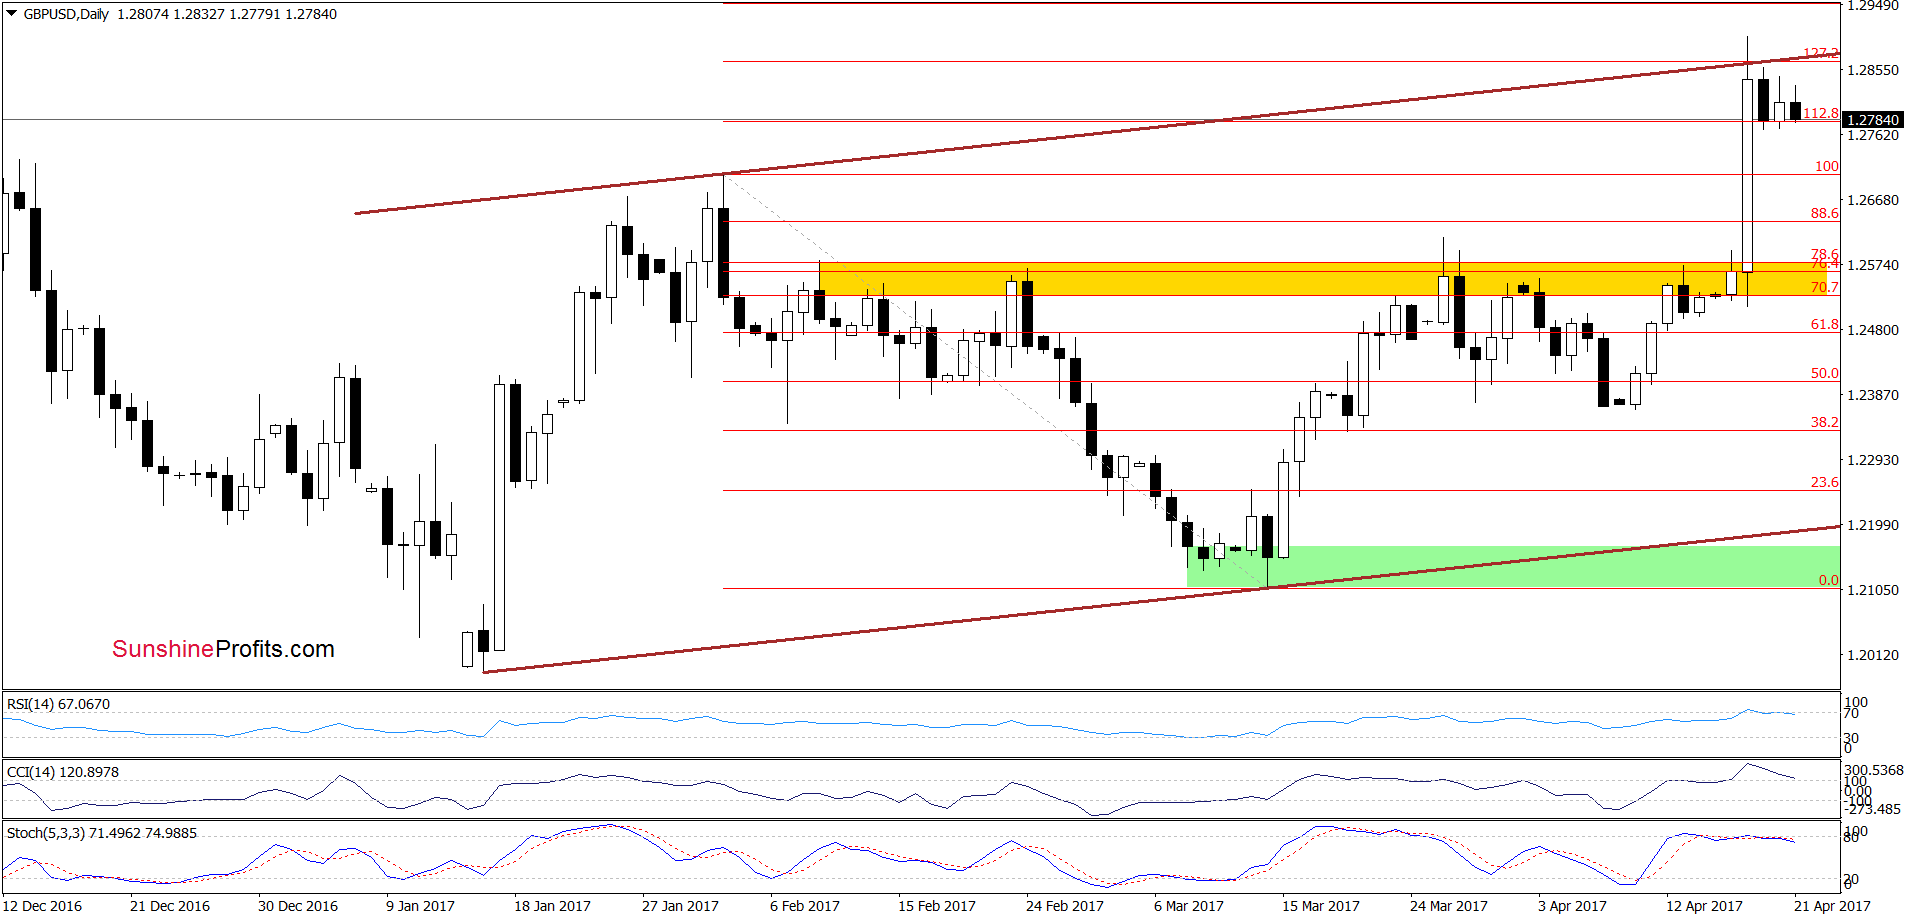
From this perspective, we see that GBP/USD broke above the yellow resistance zone and January high, which resulted in a climb to the upper border of the brown rising trend channel and the 1.272% Fibonacci extension. The combination of these resistances triggered a pullback in the previous days, which suggests that further deterioration may be just around the corner – especially when we factor in the medium-term picture and the current position of the daily indictors (the RSI and the Stochastic Oscillator generated sell signals, while the CCI is very close to doing the same). However, as long as there is no invalidation of the breakout above the January high, short-lived moves in both directions are likely.
Very short-term outlook: mixed with bearish bias
Short-term outlook: mixed with bearish bias
MT outlook: mixed
LT outlook: mixed
Trading position (short-term; our opinion): No positions are justified from the risk/reward perspective. We will keep you informed should anything change, or should we see a confirmation/invalidation of the above.
USD/CAD
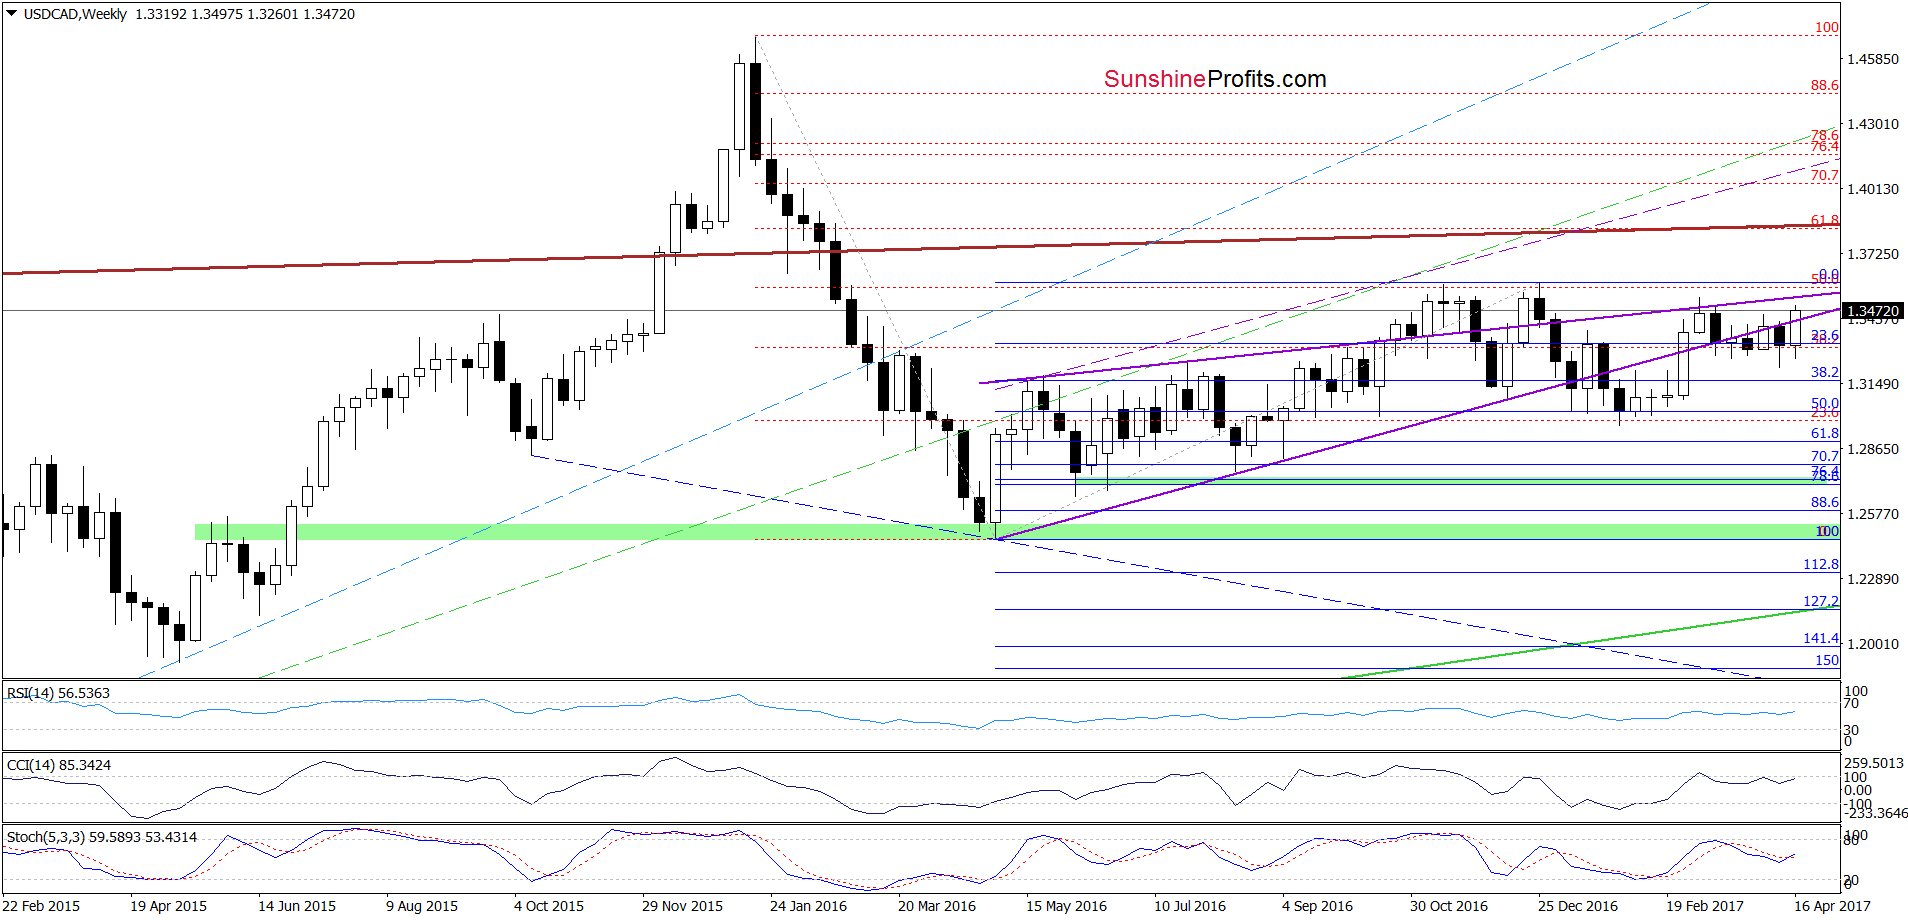
From the medium-term perspective, we see that USD/CAD came back above the lower border of the purple rsing wedge earlier this week. What impact did this increase have on the daily chart? Let’s find out.
Quoting our last commentary on this currency pair:
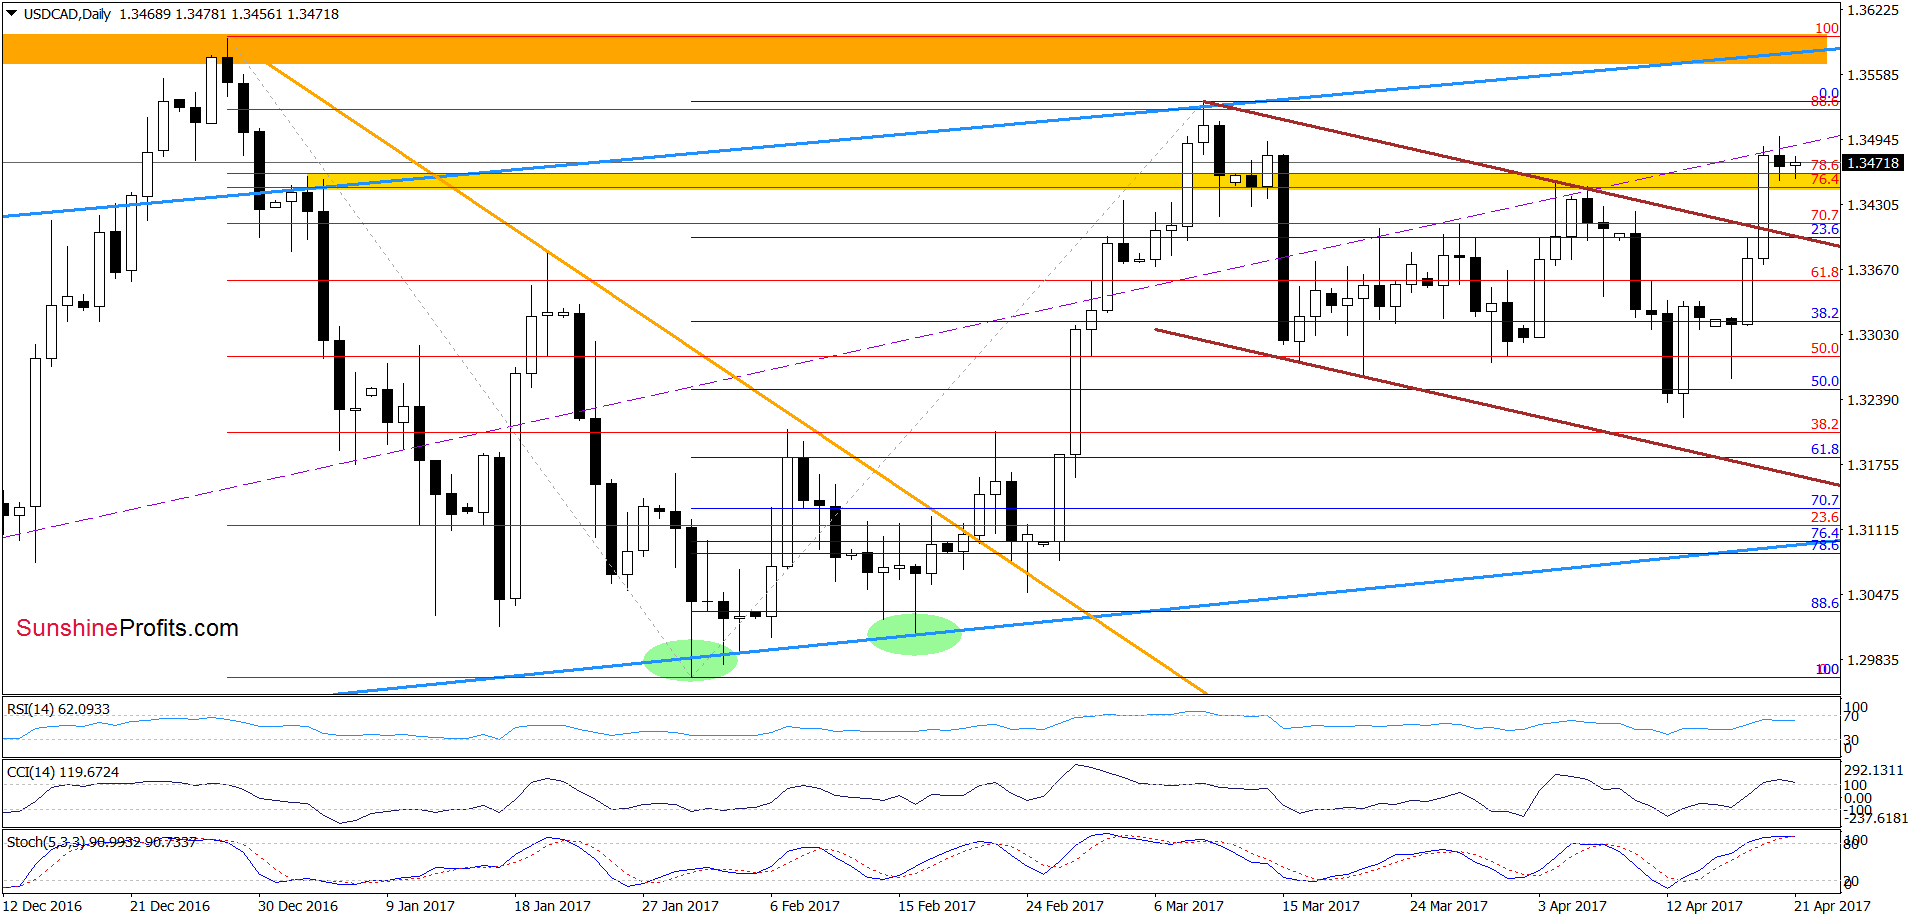
(…) USD/CAD extended gains and broke above the upper border of the brown declining trend channel, which suggests further improvement and a test of the strength of the yellow resistance zone and the April highs. Nevertheless, in our opinion, such price action will be more likely if the exchange rate breaks above the previously-broken lower border of the purple rising wedge seen on the weekly chart (…)
Looking at the above charts, we see that currency bulls pushed USD/CAD above the previously-broken lower border of the purple rising wedge (seen on the weekly chart), which triggered further improvement and resulted in a climb above the April highs and the yellow resistance zone. Although this is a bullish development, the current position of the indictors suggests that space for increases may be limited (indicators moved to their overbought areas, which could translate into sell signals in the coming days). Additionally, not far from current levels is also another resistance – the March low, which could encourage currency bears to act in very near future.
Very short-term outlook: mixed
Short-term outlook: mixed with bearish bias
MT outlook: mixed
LT outlook: mixed
Trading position (short-term; our opinion): No positions are justified from the risk/reward perspective. We will keep you informed should anything change, or should we see a confirmation/invalidation of the above.
Thank you.
Nadia Simmons
Forex & Oil Trading Strategist
Przemyslaw Radomski, CFA
Founder, Editor-in-chief, Gold & Silver Fund Manager
Gold & Silver Trading Alerts
Forex Trading Alerts
Oil Investment Updates
Oil Trading Alerts

