

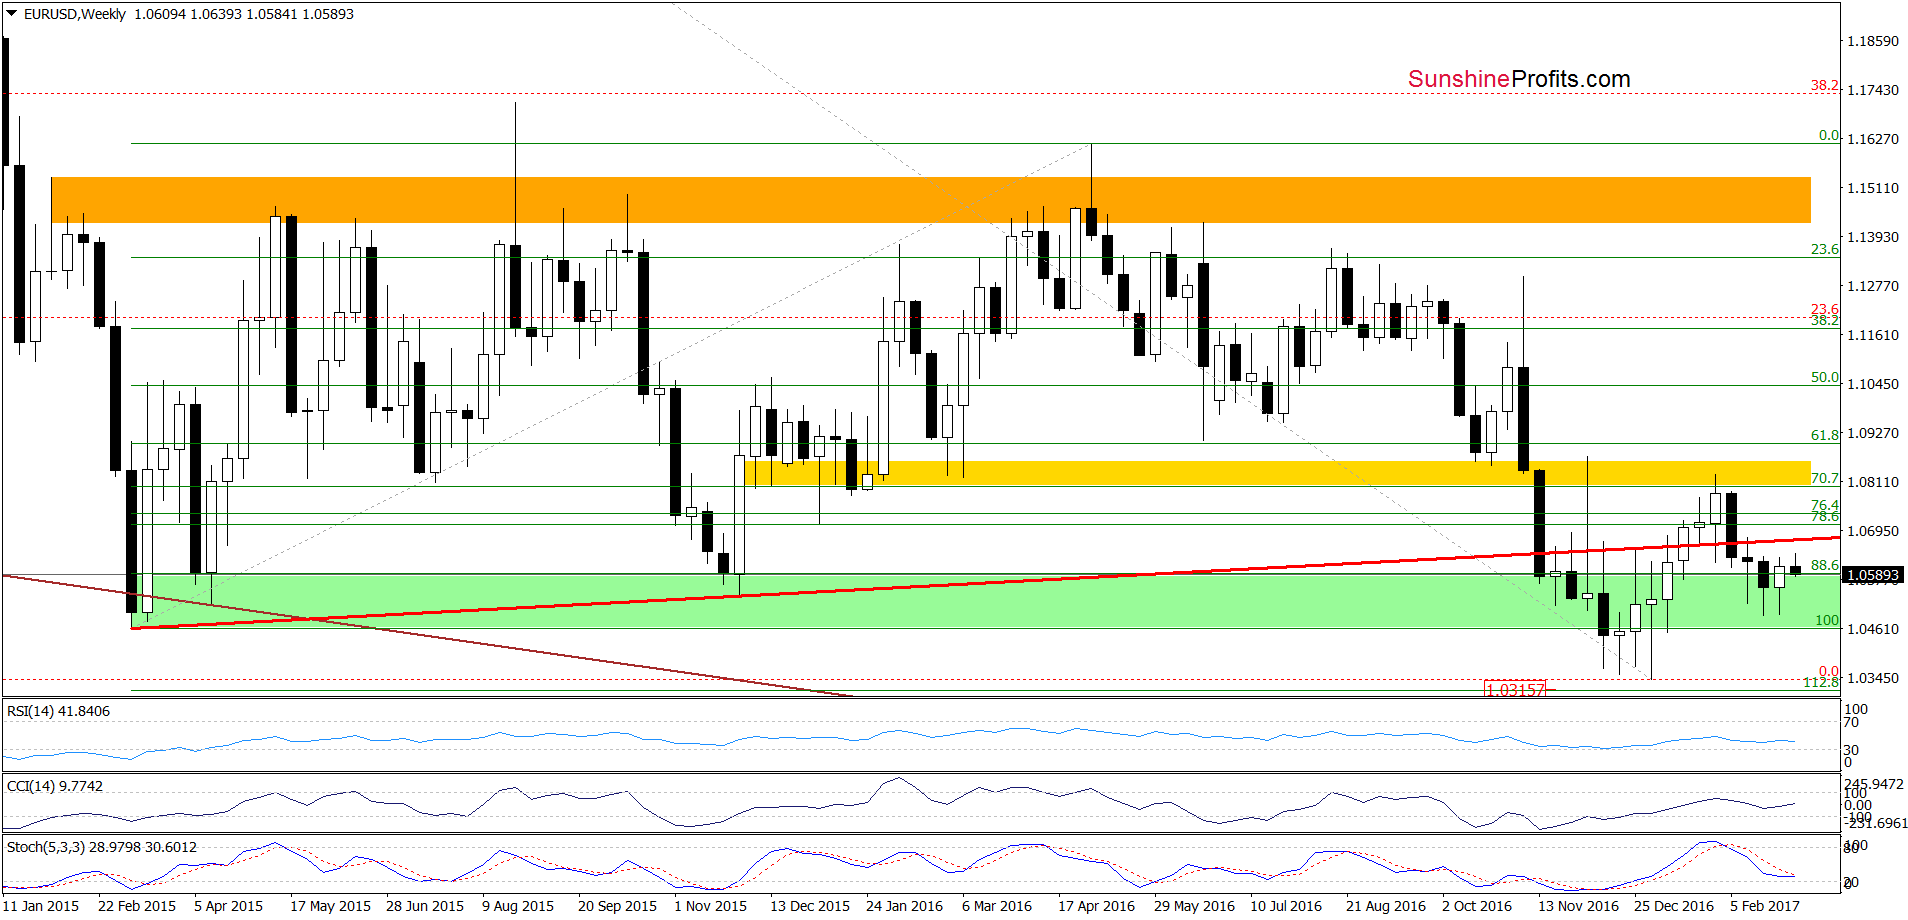
Although EUR/USD moved higher once again, the key resistance zone continues to keep gains in check. Does it mean that the next bigger downswing is just around the corner?
In our opinion the following forex trading positions are justified - summary:
- EUR/USD: short (a stop-loss order at 1.0735; the initial downside target at 1.0388)
- GBP/USD: short (a stop-loss order at 1.2590; the next downside target at 1.2160)
- USD/JPY: long (a stop-loss order at 111; the initial upside target at 115.43)
- USD/CAD: long (a stop-loss order at 1.2949; the next upside target at 1.3424)
- USD/CHF: long (a stop-loss order at 0.9891; the initial upside target at 1.0180)
- AUD/USD: none
EUR/USD
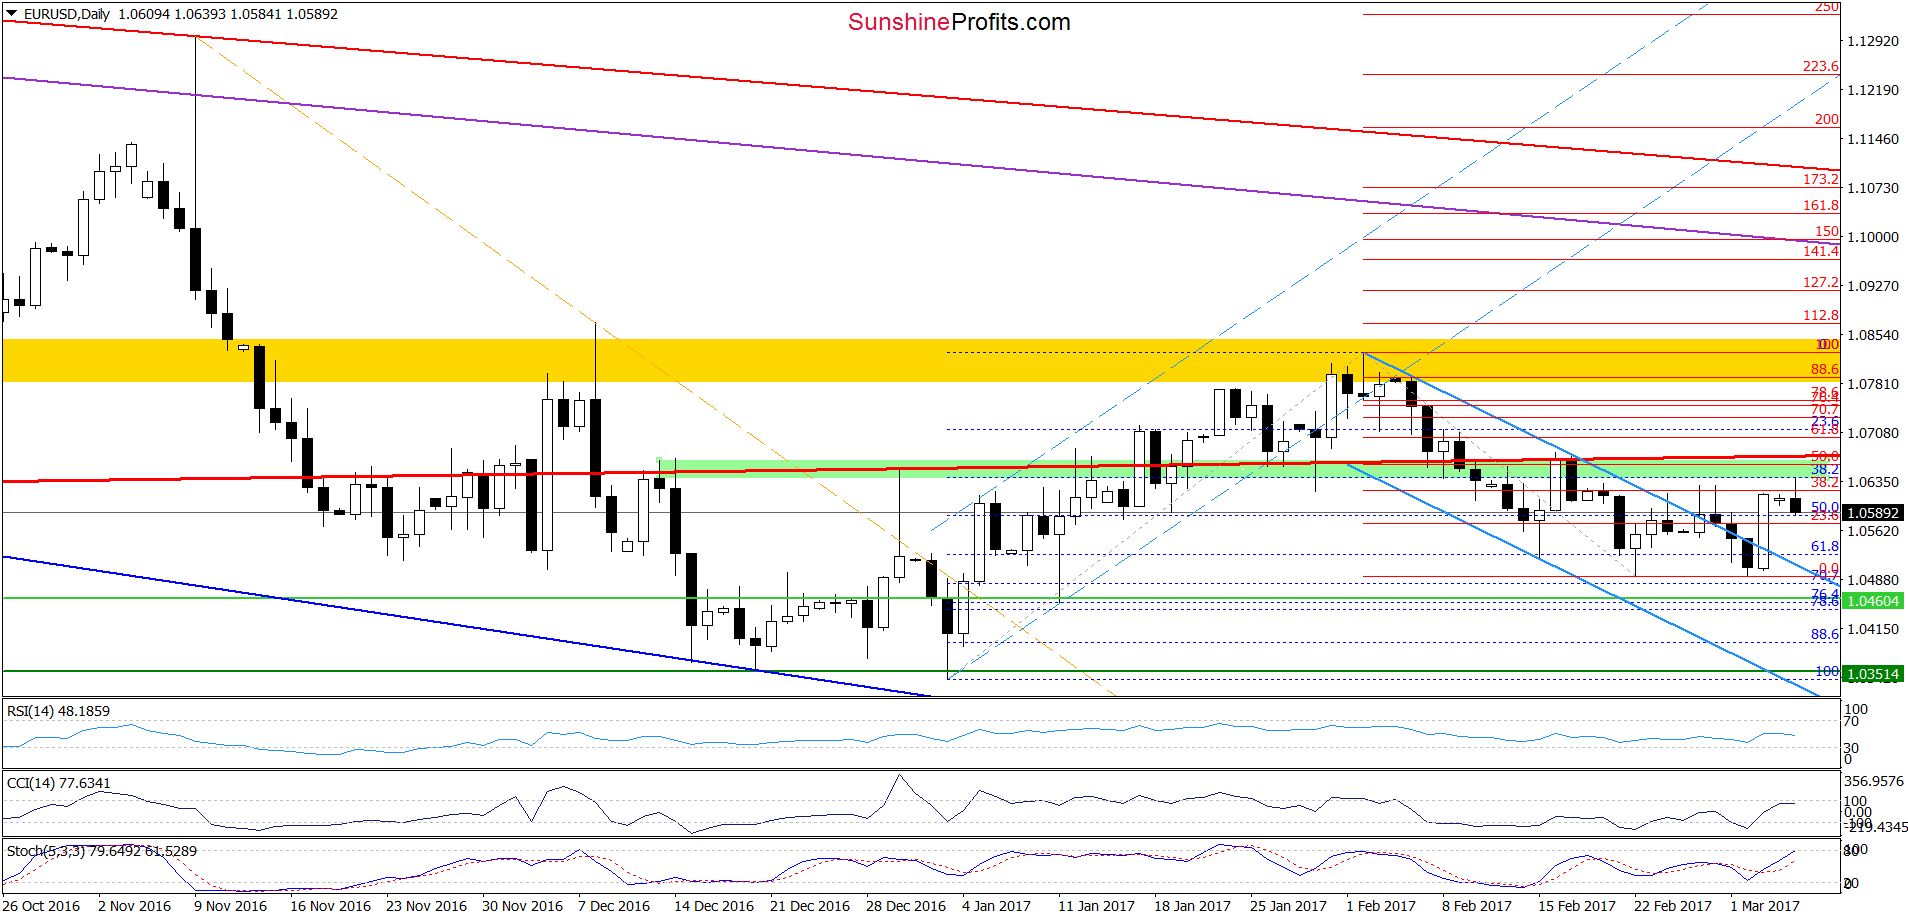
Looking at the daily chart, we see that currency bulls push EUR/USD above the upper border of the blue declining trend channel on Friday. Earlier today, the exchange rate moved a bit higher, but the previously-broken green zone stopped further improvement, triggering a pullback. What’s next? Taking into account the similarity to what we saw at the beginning of the previous week, we think that the pair will move lower and test the recent lows in the following days. If they are broken, we’ll likely see a drop to around 1.0460, where the 76.4% and 78.6% Fibonacci retracements are.
Very short-term outlook: bearish
Short-term outlook: mixed with bearish bias
MT outlook: mixed
LT outlook: mixed
Trading position (short-term; our opinion): Short positions with a stop-loss order at 1.0735 and the initial downside target at 1.0388 are justified from the risk/reward perspective. We will keep you informed should anything change, or should we see a confirmation/invalidation of the above.
GBP/USD
On Wednesday, we wrote the following:
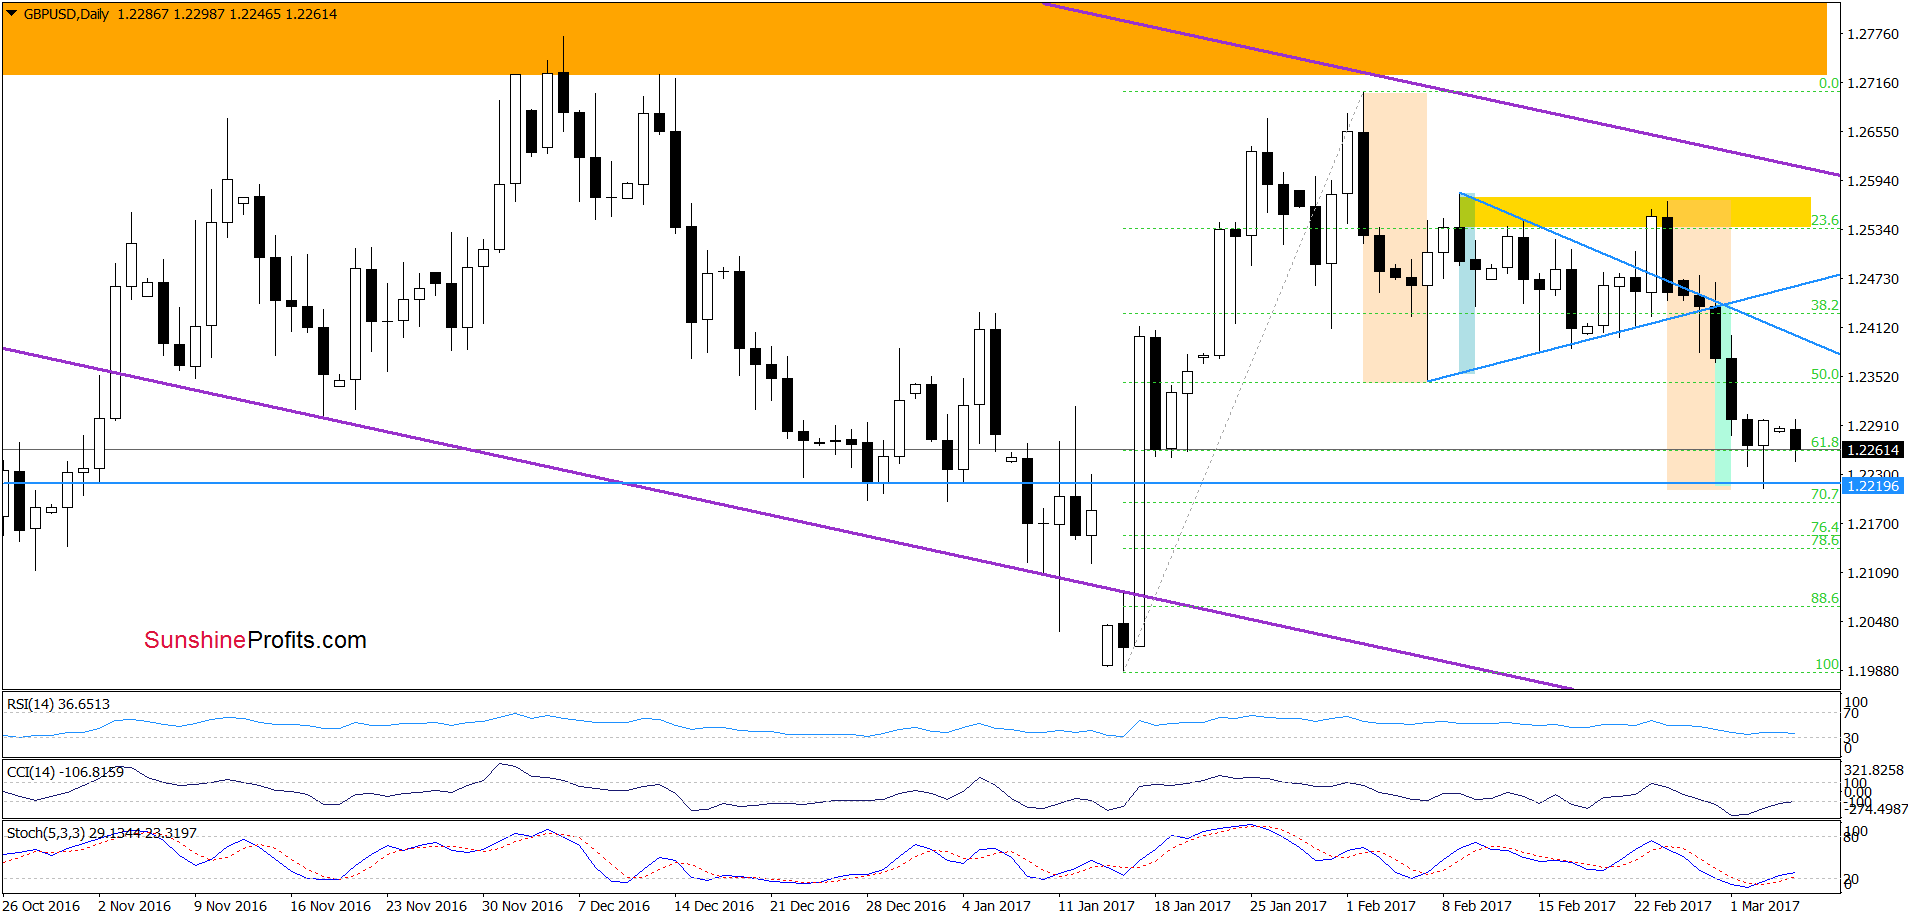
(…) the exchange rate extended losses and closed yesterday’s session not only under the lower border of the triangle, but also below the green support zone. This is a bearish signal, which suggests (…) that (…) GBP/USD will decline to at least the 6.8% Fibonacci retracement (at 1.2262) or even to around 1.2220, where the size of the downward move will correspond to the height of the triangle.
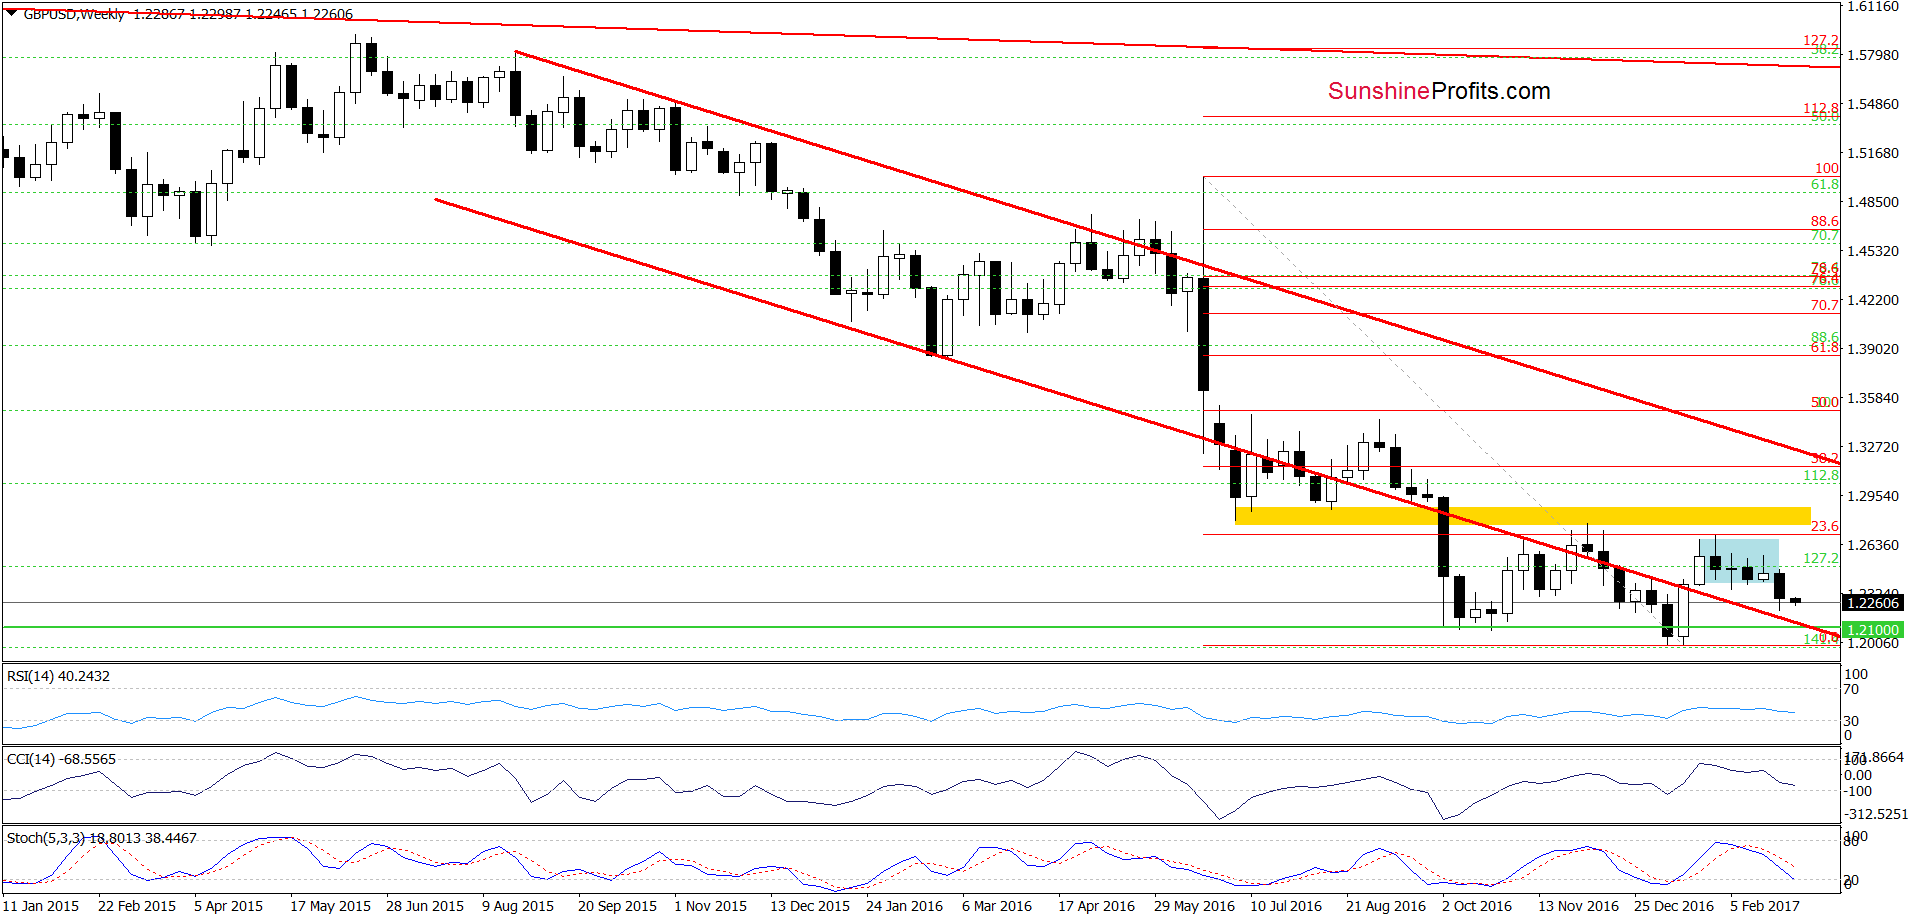
From today’s point of view, we see that the situation developed in line with the above scenario and GBP/USD declined to our downside targets at the end of the previous week. Although the pair rebounded slightly on Friday, the size of the move was tiny compared to the earlier decline, which suggests that we may see a test of the recent low or even a drop to the next downside target – the 70.7% Fibonacci retracement at 1.2194. If it is broken, the way to the next support area (created by the 76.4% and 78.6% Fibonacci retracements around 1.2138-1.2157) will be open. At this point, it is worth noting that in this area is also the lower border of the red declining trend channel (marked on the weekly chart), which increases the probability of reversal.
Very short-term outlook: bearish
Short-term outlook: mixed with bearish bias
MT outlook: mixed
LT outlook: mixed
Trading position (short-term; our opinion): Short positions (with a stop-loss order at 1.2590 and the next downside target at 1.2160) are justified from the risk/reward perspective. We will keep you informed should anything change, or should we see a confirmation/invalidation of the above.
AUD/USD
Quoting our last commentary on this currency pair:
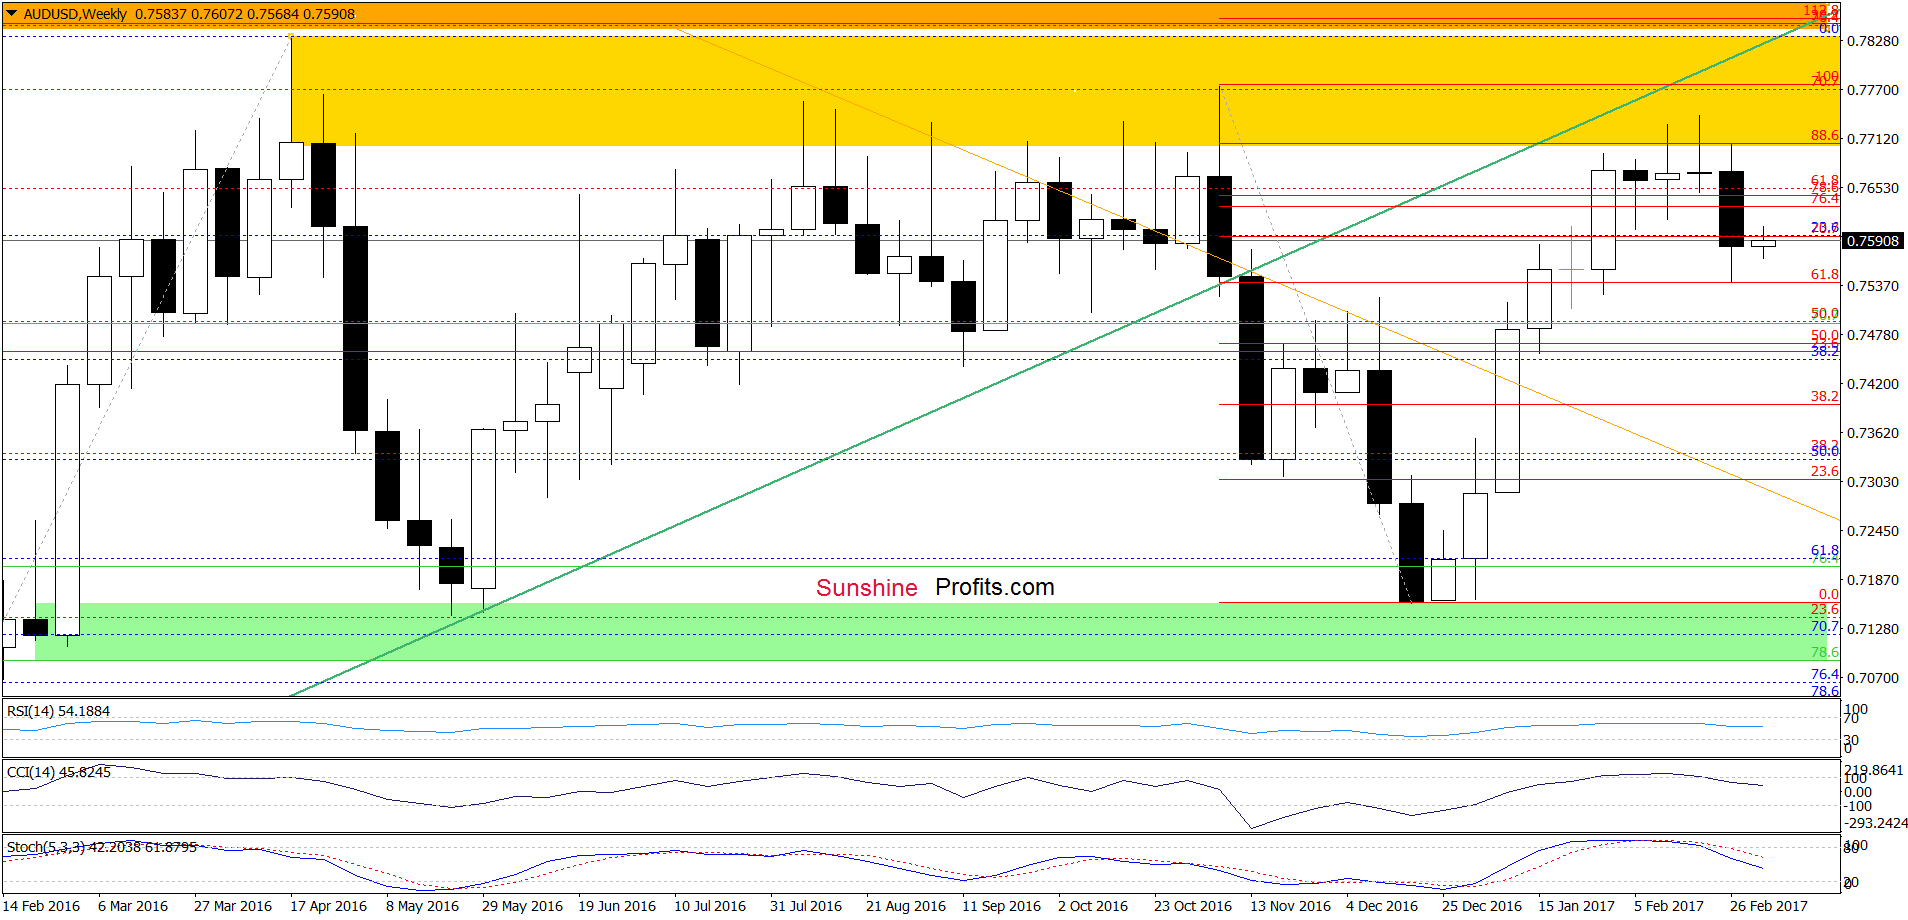
(…) the space for increases is limited as AUD/USD is still trading below the yellow resistance zone. As you see on the weekly chart, this area was strong enough to stop currency bulls several times in the past, which suggests that another attempt to move lower may be just around the corner. This scenario is also reinforced by the current position of the indicators – the CCI and the Stochastic Oscillator generated the sell signals, supporting lower prices of the exchange rate.
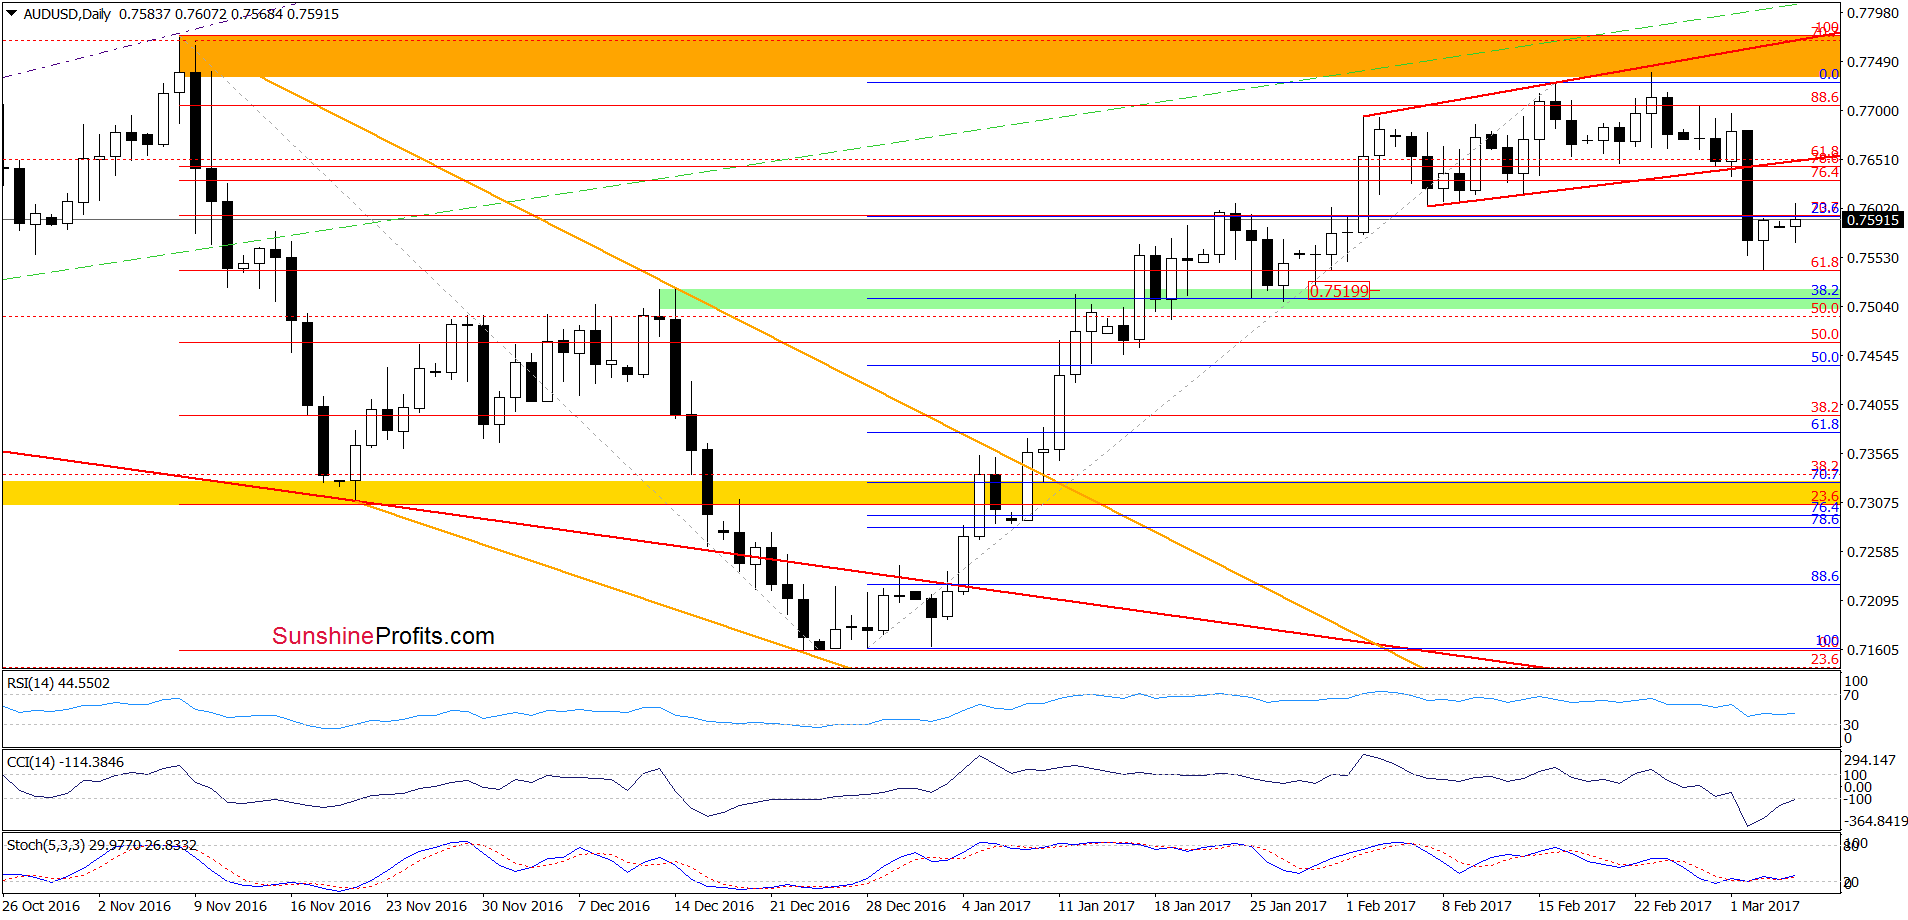
On the daily chart, we see that the situation developed in line with the above scenario and AUD/USD moved sharply lower on Friday. Thanks to this move, the pair dropped under the lower border of the red rising trend channel, which opened the way to the green support zone. Despite this deterioration, currency bulls pushed the pair higher earlier today, which suggests that we may see a verification of the breakdown in the following days. If this is the case, and we’ll see such price action, we’ll consider opening short positions.
Very short-term outlook: bearish
Short-term outlook: mixed with bearish bias
MT outlook: mixed
LT outlook: mixed
Trading position (short-term; our opinion): No positions are justified from the risk/reward perspective. We will keep you informed should anything change, or should we see a confirmation/invalidation of the above.
Thank you.
Nadia Simmons
Forex & Oil Trading Strategist
Przemyslaw Radomski, CFA
Founder, Editor-in-chief, Gold & Silver Fund Manager
Gold & Silver Trading Alerts
Forex Trading Alerts
Oil Investment Updates
Oil Trading Alerts

