

Earlier today, the USD Index rebounded and climbed above 95.30 as investors awaiting a speech by Federal Reserve Chair Janet Yellen later in the day. As a result, USD/CAD came back above the barrier of 1.3000, invalidating earlier breakdown. Is it enough to trigger further improvement?
In our opinion the following forex trading positions are justified - summary:
- EUR/USD: none
- GBP/USD: short (stop-loss order at 1.4785; initial downside target at 1.4220)
- USD/JPY: none
- USD/CAD: none
- USD/CHF: none
- AUD/USD: none
EUR/USD
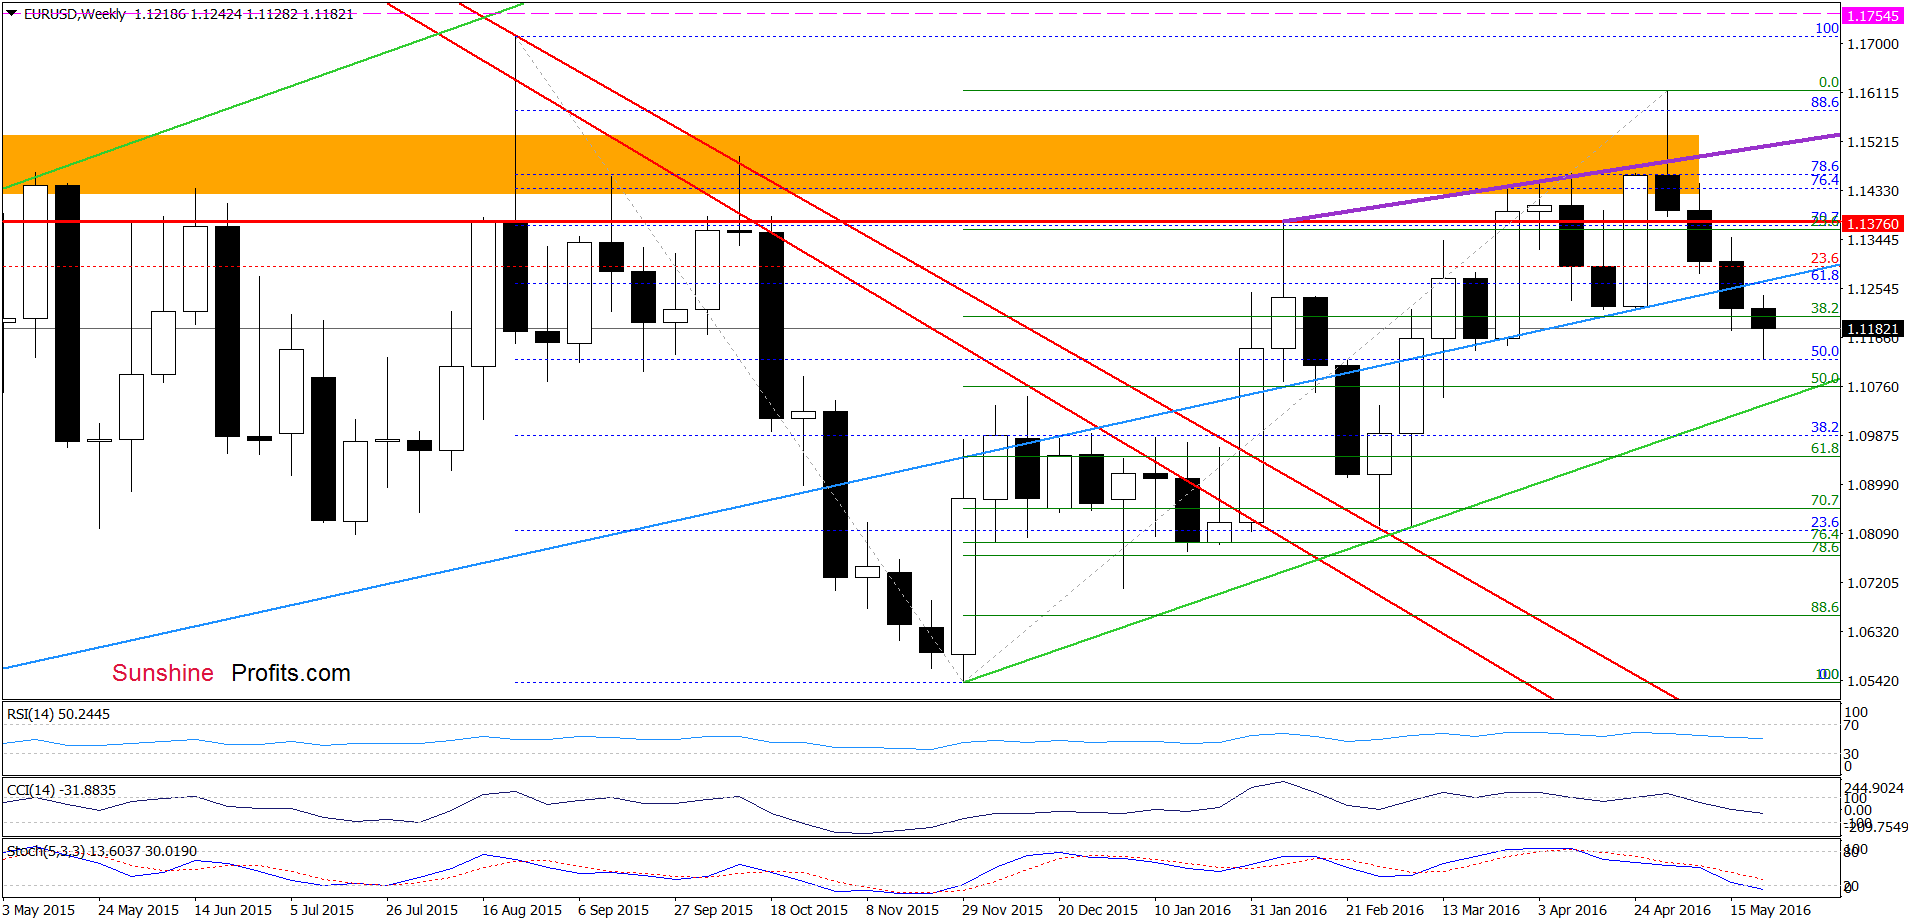
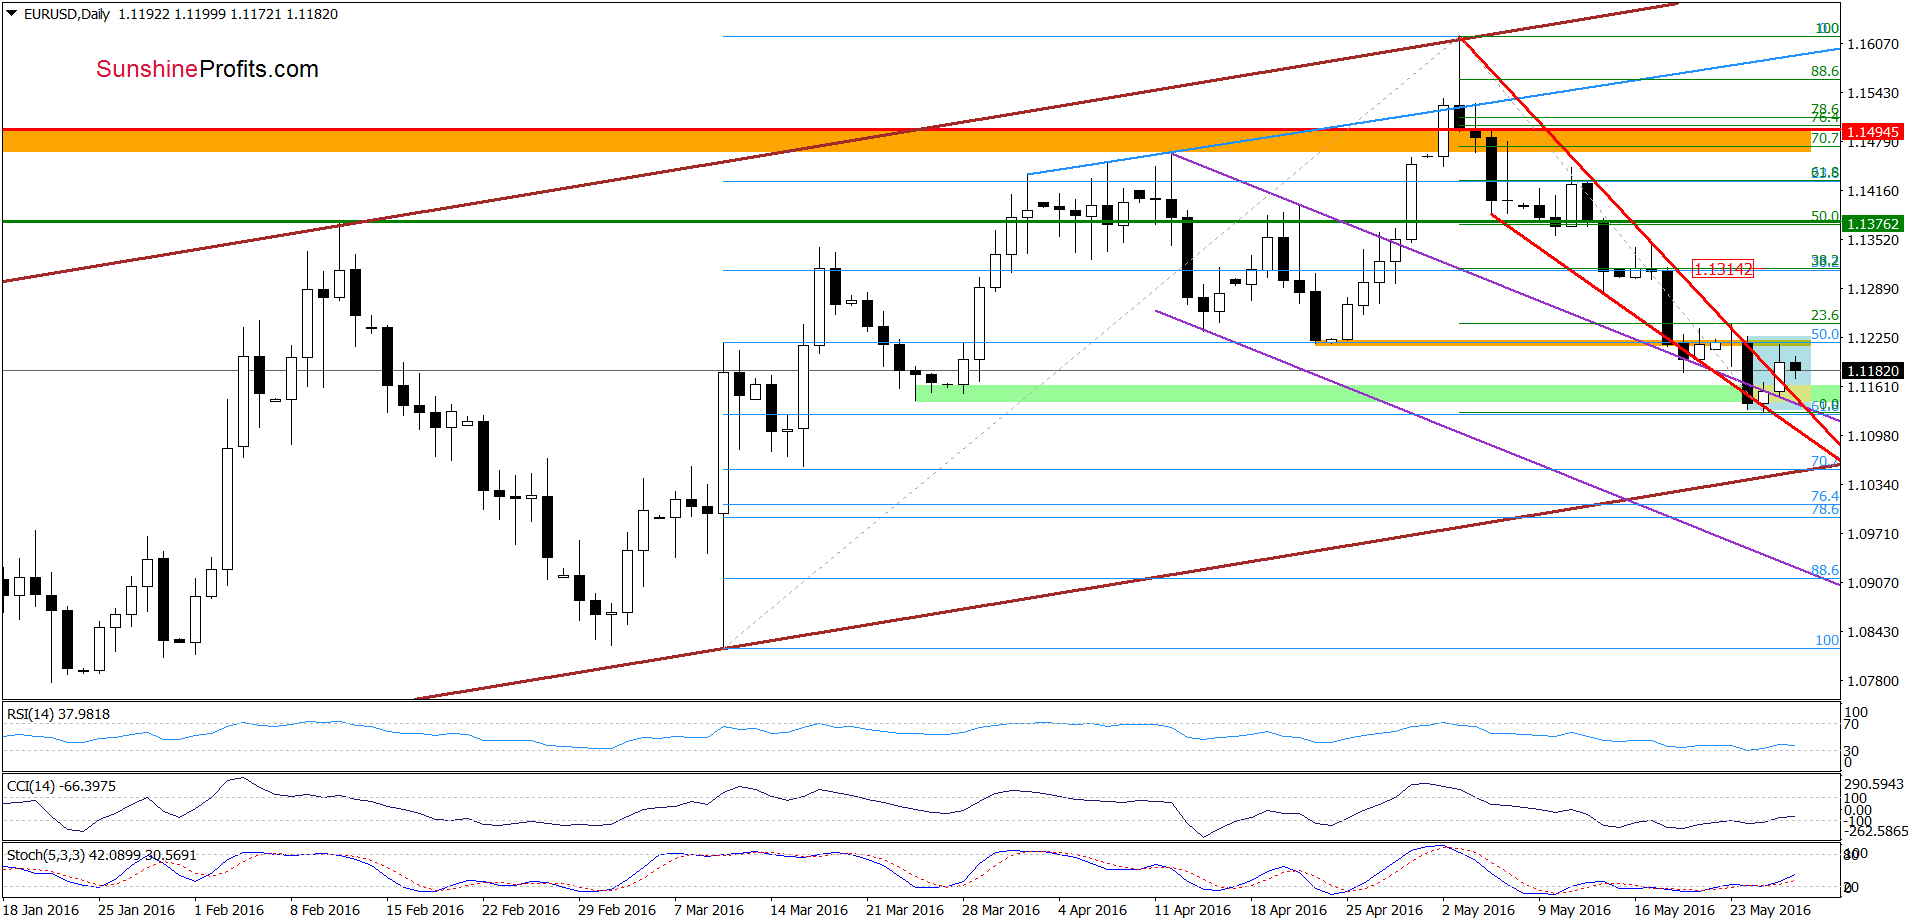
Looking at the daily chart, we see that the breakout above the upper border of the declining wedge triggered a climb to the late-Apr lows. As you see, this resistance area stopped further improvement and EUR/USD extended drops earlier today. Despite this move, the exchange rate remains in the blue consolidation, which suggests that breakout above the upper line of the formation (increase above 1.1226) or a breakdown under the lower line (drop below 1.1128) will indicate the direction of the next move. Nevertheless, taking into account buy signals generated by all indicators, we think that the next move will be to the upside. If this is the case, and EUR/USD come back above late-Apr lows, the next upside target would be around 1.1314, where the 32.8% Fibonacci retracement (based on the recent downward move) and the May 18 high are.
Very short-term outlook: mixed with bullish bias
Short-term outlook: mixed
MT outlook: mixed
LT outlook: mixed
Trading position (short-term; our opinion): No positions are justified from the risk/reward perspective. We will keep you informed should anything change, or should we see a confirmation/invalidation of the above.
USD/CAD
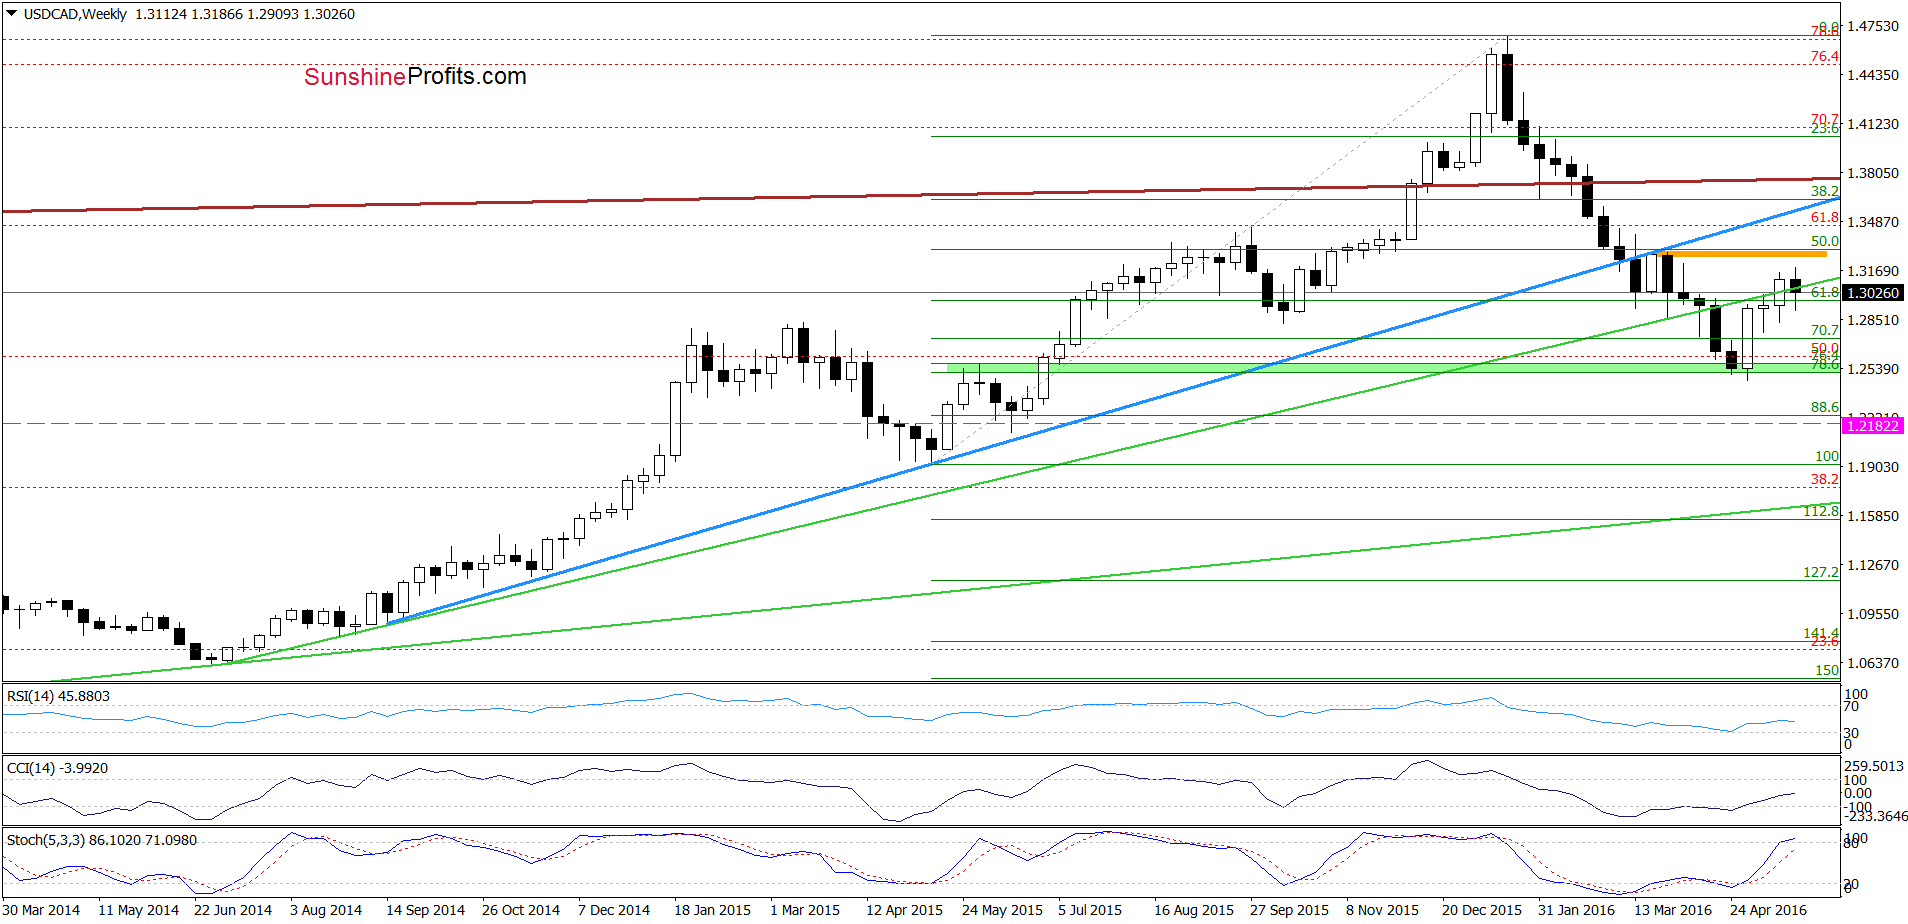
The situation deteriorated slightly as USD/CAD slipped under the previously-broken green support/resistance line in recent days. Although this is a negative signal, it would be more reliable if we see a weekly closure below this line. Until this time another rebound is likely – especially when we factor in buy signals generated by the indicators.
Are there any technical factors that could encourage currency bulls to act? Let’s examine the very short-term hart and find out.
On Wednesday, we wrote the following:
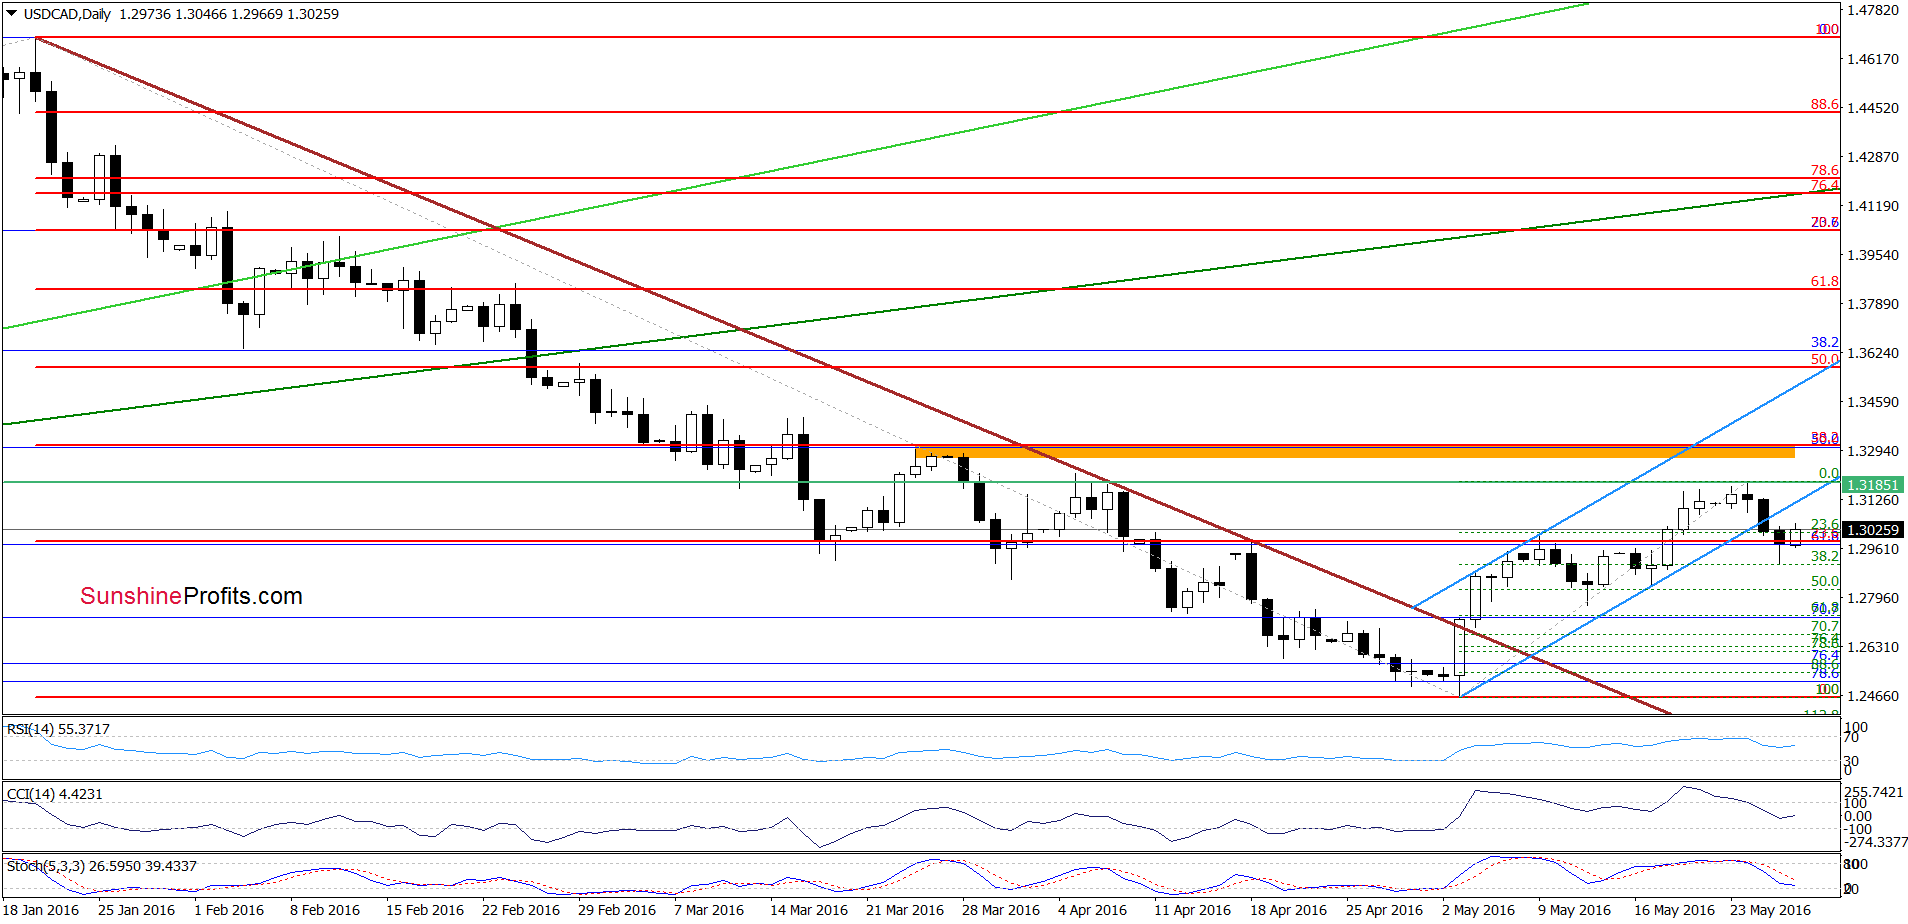
(…) USD/CAD pulled back in recent days. Taking this fact into account and combining it with sell signals generated by the CCI and Stochastic Oscillator we think that the pair will likely test the strength of the lower border of the blue rising trend channel in the coming days. If this support is broken, the next downside target would be the barrier of 1.3000 or even area around 1.2770-1.2835, where the mid-May lows are.
Looking at the daily chart, we see that the situation developed in line with the above scenario and USD/CAD slipped even below our downside targets. With this move, the exchange rate reached the 38.2% Fibonacci retracement (based on the recent upward move), which encouraged currency bulls to act. As a result, the pair came back above the barrier of 1.3000, invalidating earlier breakdown. This is a positive signal, which suggests a test of the lower border of the blue rising trend channel (currently at 1.3116) in the coming day(s). Nevertheless, further improvement would be more likely if we see invalidation of the breakdown under this line and indicators generate buy signals.
Very short-term outlook: mixed with bullish bias
Short-term outlook: mixed
MT outlook: mixed
LT outlook: mixed
Trading position (short-term; our opinion): No positions are justified from the risk/reward perspective. We will keep you informed should anything change, or should we see a confirmation/invalidation of the above.
AUD/USD
Quoting our Wednesday’s alert:
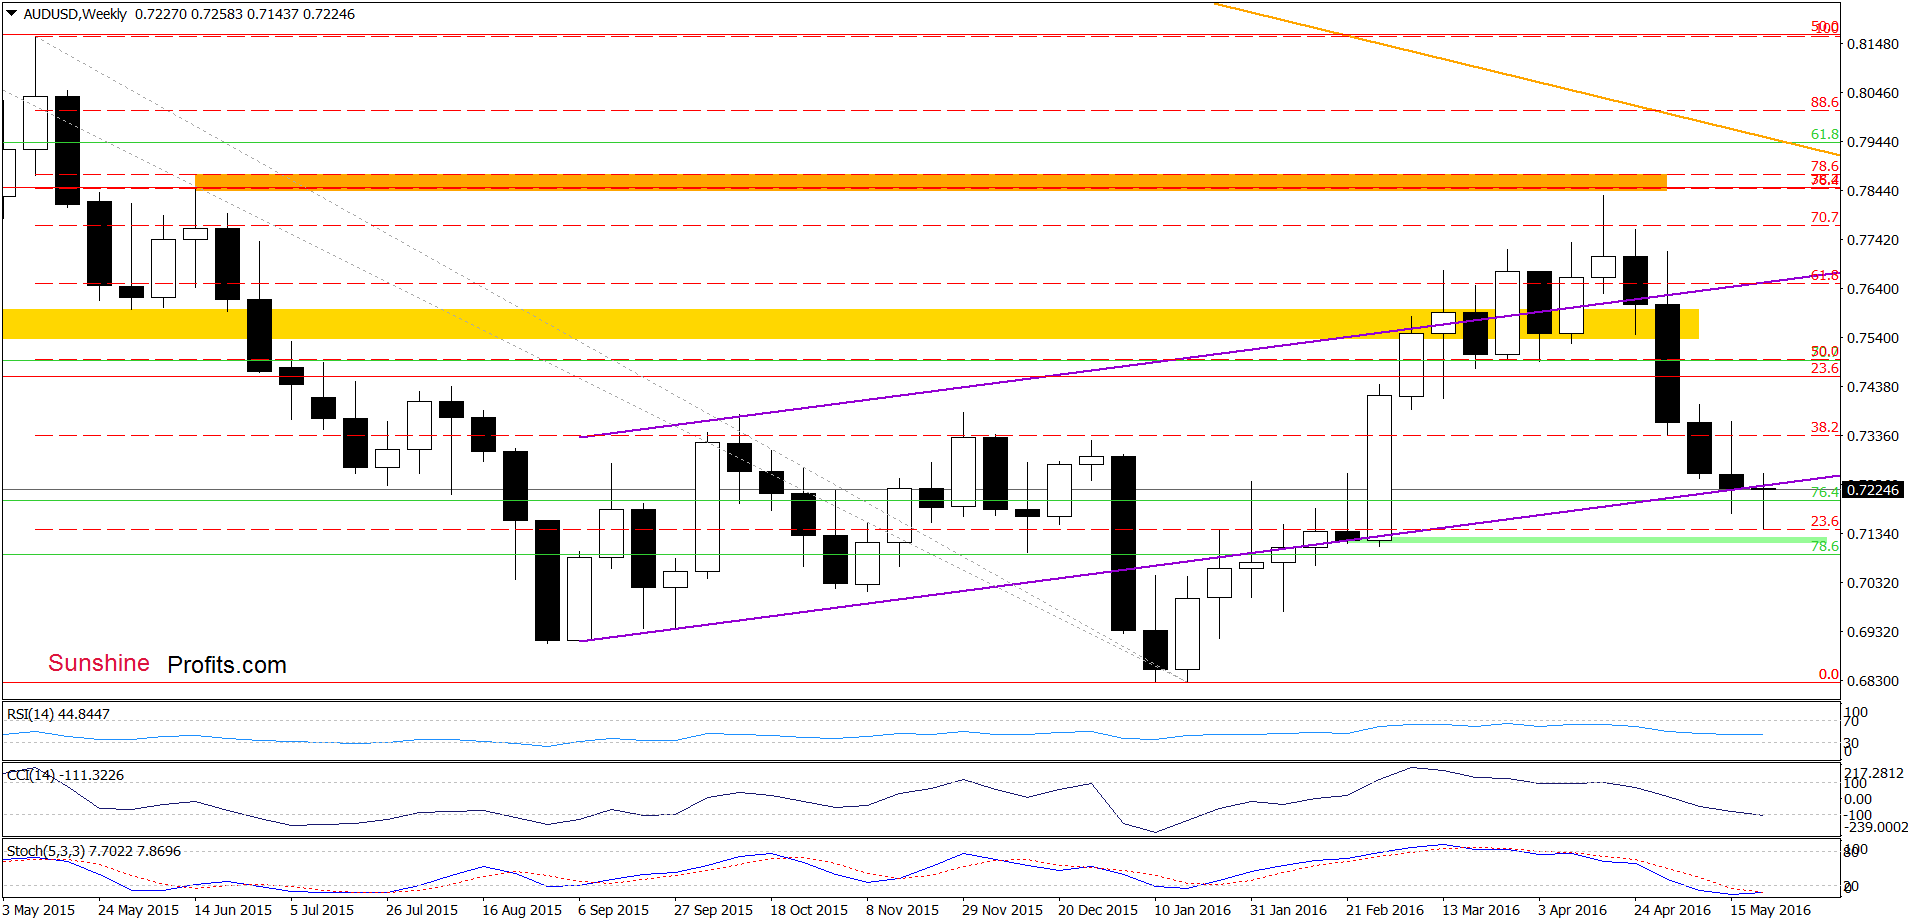
(…) the exchange rate approached the green support zone created by the late-Feb lows and the CCI and Stochastic Oscillator are oversold, which increases the probability of reversal in the coming days.
On the weekly chart, we see that the above-mentioned area encouraged currency bulls to act and AUD/USD rebounded. Despite this move, the pair remains under the lower border of the purple rising trend channel, which serves as the nearest resistance at the moment. Will we see further improvement in the coming days? Let’s examine the daily chart and find out what can we infer from it.
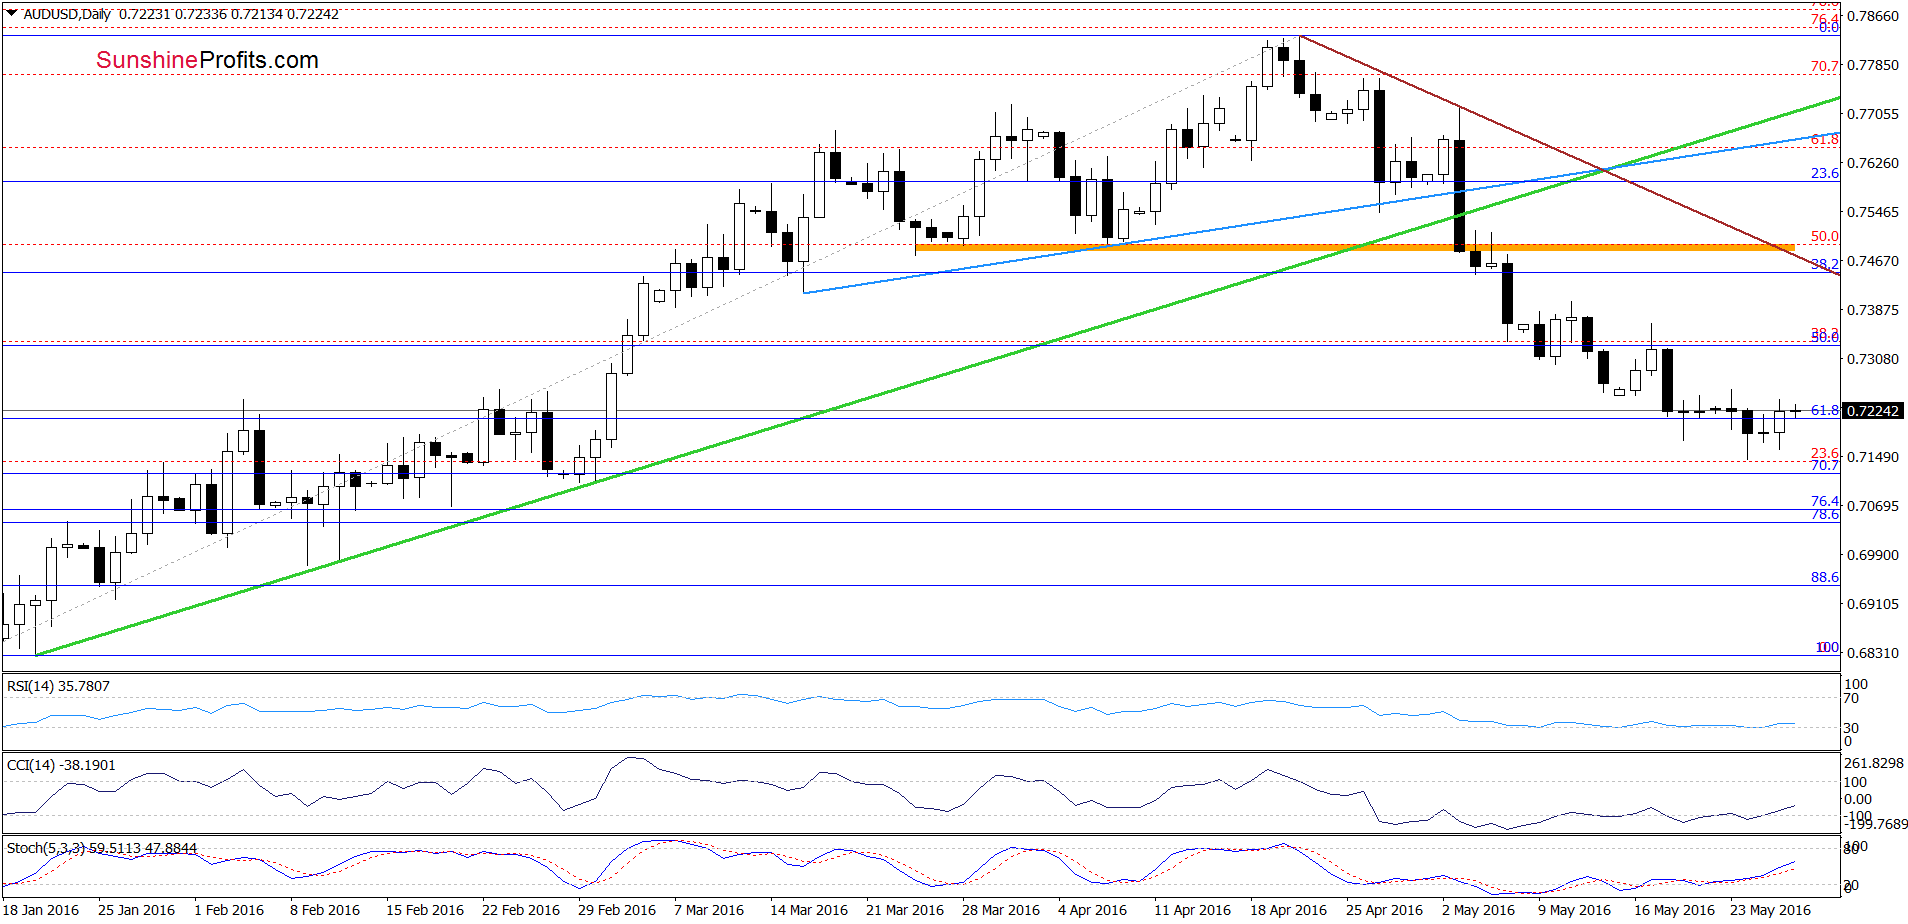
From this perspective, we see that AUD/USD extended gains earlier today and came back above the 61.8% Fibonacci retracement (based on the entire Jan-Apr upward move), invalidating earlier breakdown. Taking this positive event into account and combining it with buy signals generated by the indicators we think that further improvement is just around the corner. If this is the case and the exchange rate moves higher from here, the initial upside target would be around 0.7400 (the May 11 peak).
Very short-term outlook: mixed with bullish bias
Short-term outlook: mixed
MT outlook: mixed
LT outlook: mixed
Trading position (short-term; our opinion): No positions are justified from the risk/reward perspective. We will keep you informed should anything change, or should we see a confirmation/invalidation of the above.
Thank you.
Nadia Simmons
Forex & Oil Trading Strategist
Przemyslaw Radomski, CFA
Founder, Editor-in-chief
Gold & Silver Trading Alerts
Forex Trading Alerts
Oil Investment Updates
Oil Trading Alerts

