

Earlier today, the Westpac Consumer Sentiment in Australia increased by 4.2%, beating expectations of a 1.0% fall. Additionally, another report showed that HIA New Home Sales for December jumped 6.0% month-on-month. Thanks to these bullish numbers AUD/USD extended gains and increased above the previously-broken lower border of the trend channel. What impact did this event could have on future moves?
In our opinion the following forex trading positions are justified - summary:
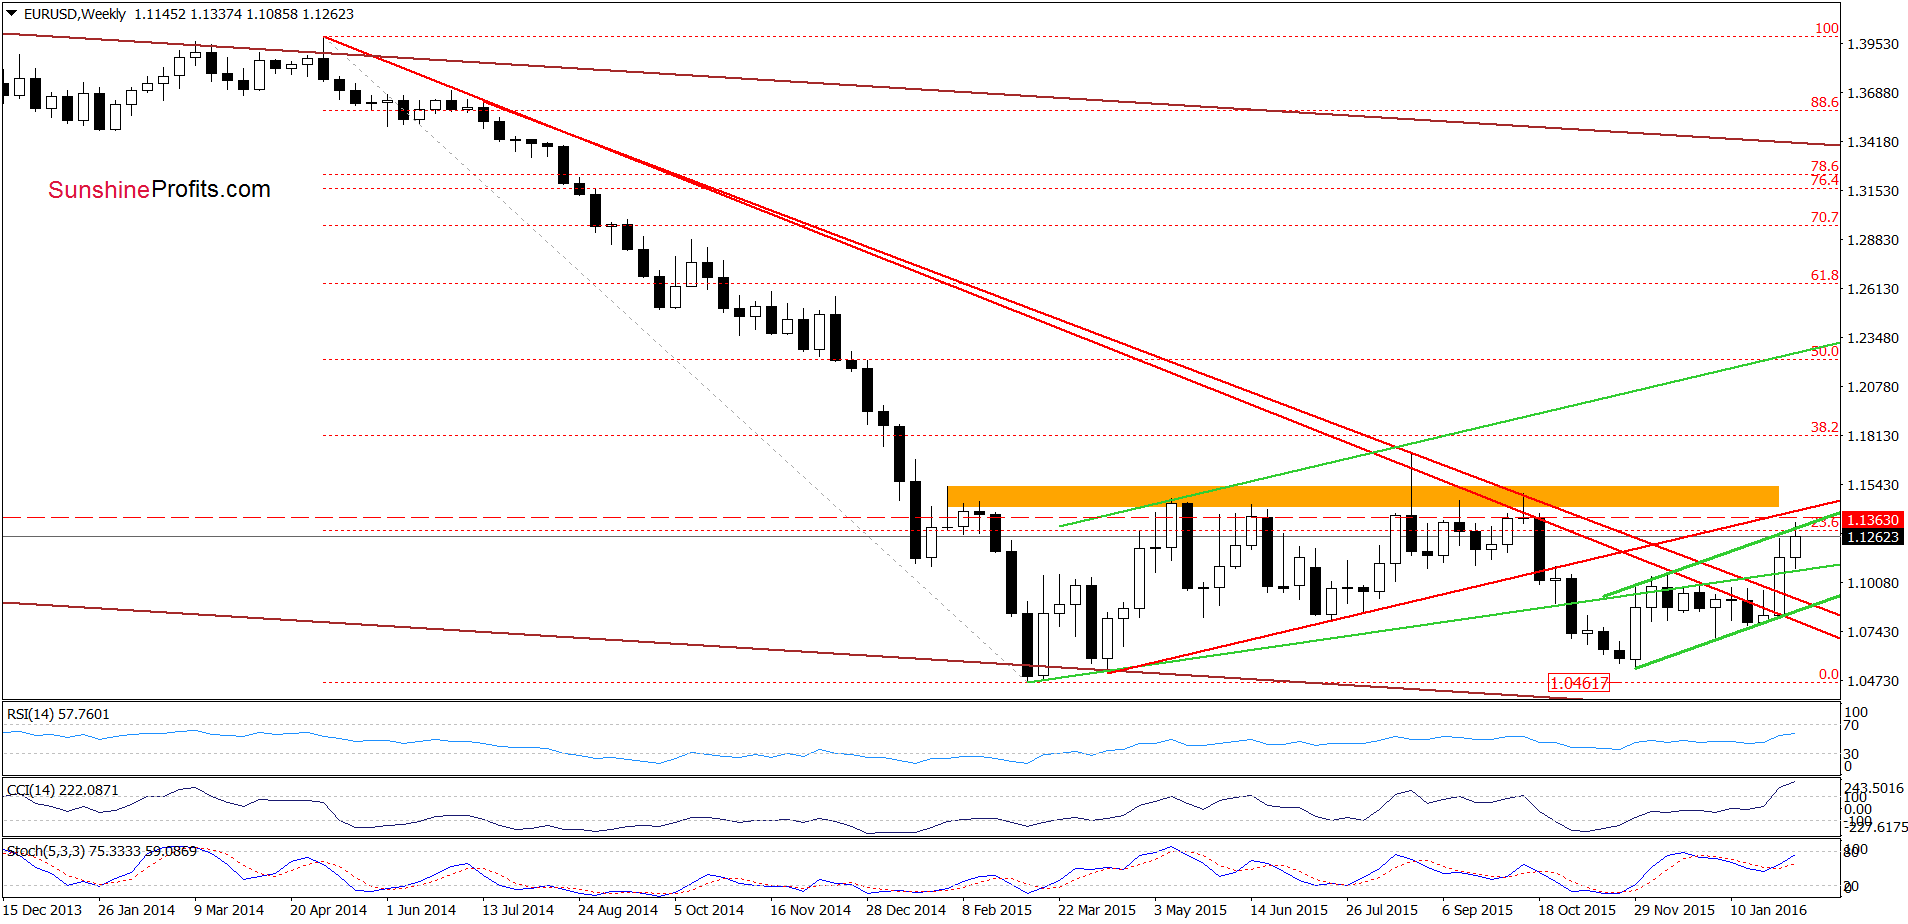
- EUR/USD: short (stop-loss order at 1.1363; initial downside target at 1.0572)
- GBP/USD: none
- USD/JPY: none
- USD/CAD: none
- USD/CHF: long (stop-loss order at 0.9633; initial downside target at 1.0239)
- AUD/USD: none
EUR/USD
Yesterday we wrote the following:
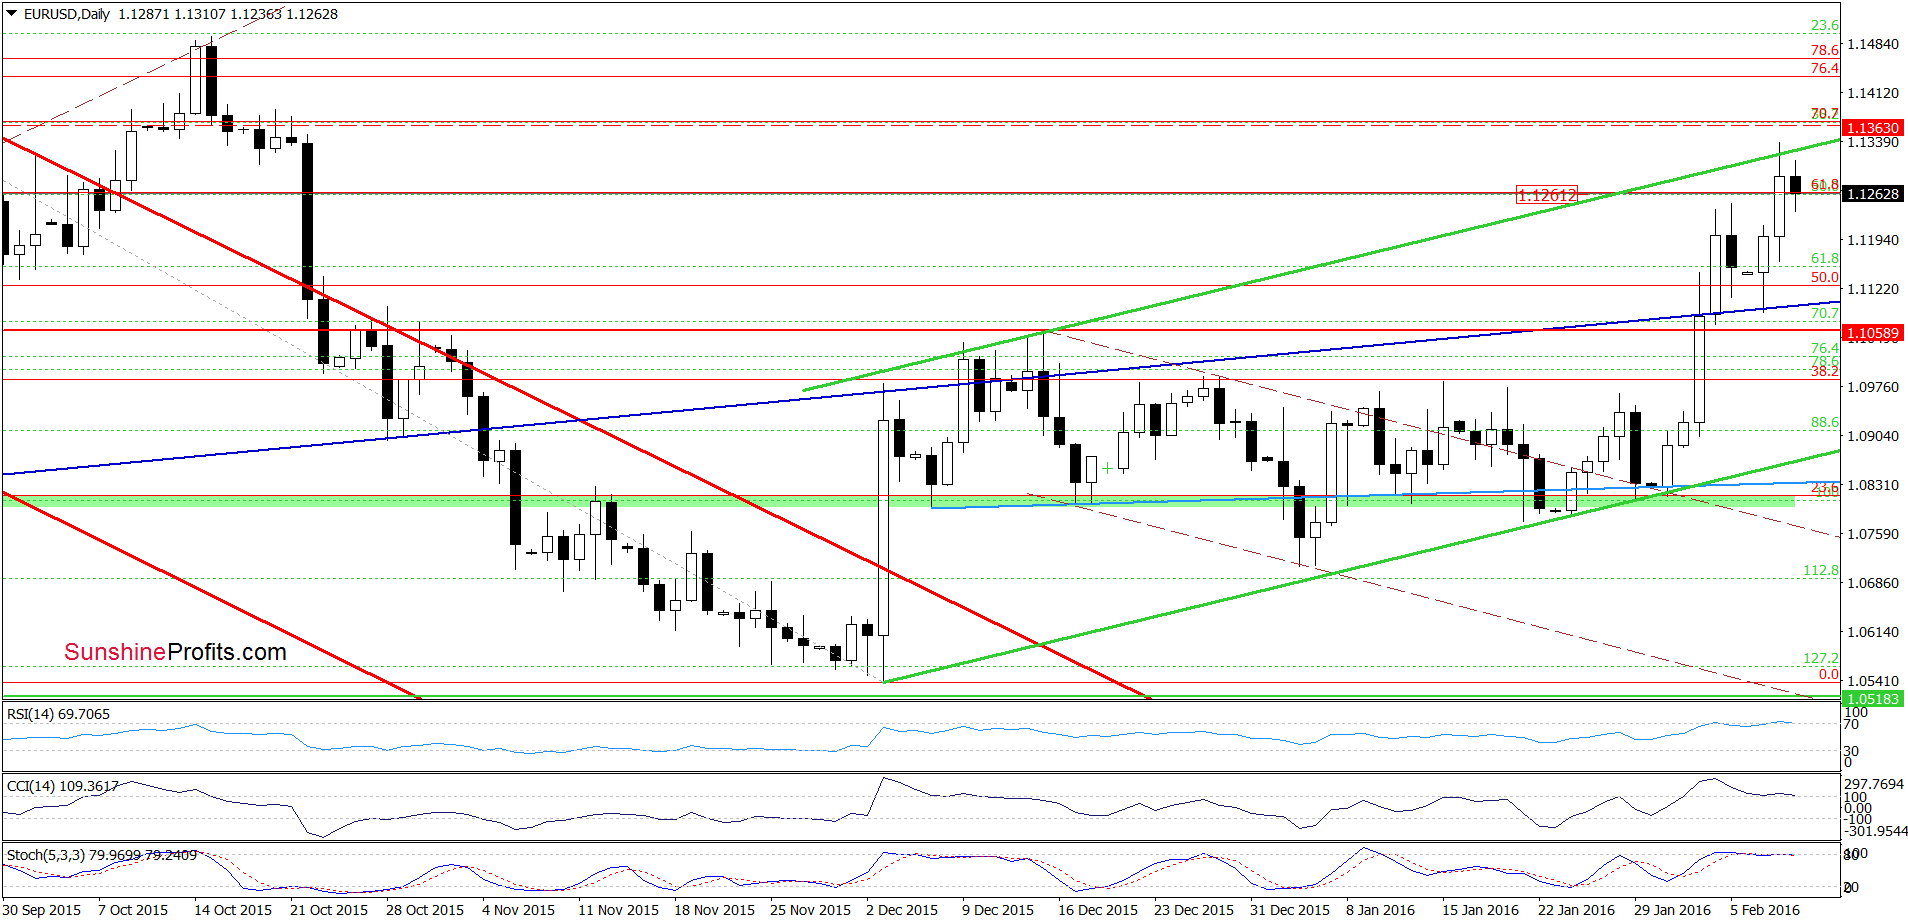
(…) if currency bulls manage to push the pair above Friday’s high, we’ll see a test of the upper border of the green rising trend channel in the following days.
On the daily chart, we see that currency bulls pushed the exchange rate higher as we had expected. Despite this improvement, the pair reversed and declined, invalidating earlier small breakout. Earlier today, we saw further deterioration and a drop under the previously-broken 61.8% Fibonacci retracement, which is an additional negative sign. Taking these facts into account and combining them with the current position of the indicators, we think that lower values of the exchange rate are just around the corner. If this is the case, the initial downside target would be the previously-broken navy blue support line (currently around 1.1097). If it is broken, the pair will test the lower border of the green rising trend channel (currently at 1.0866).
Very short-term outlook: bearish
Short-term outlook: bearish
MT outlook: mixed with bearish bias
LT outlook: mixed
Trading position (short-term; our opinion): Short positions (with a stop-loss order at 1.1363 and the initial downside target at 1.0572) are justified from the risk/reward perspective. We will keep you informed should anything change, or should we see a confirmation/invalidation of the above.
USD/CHF
Quoting our previous alert:
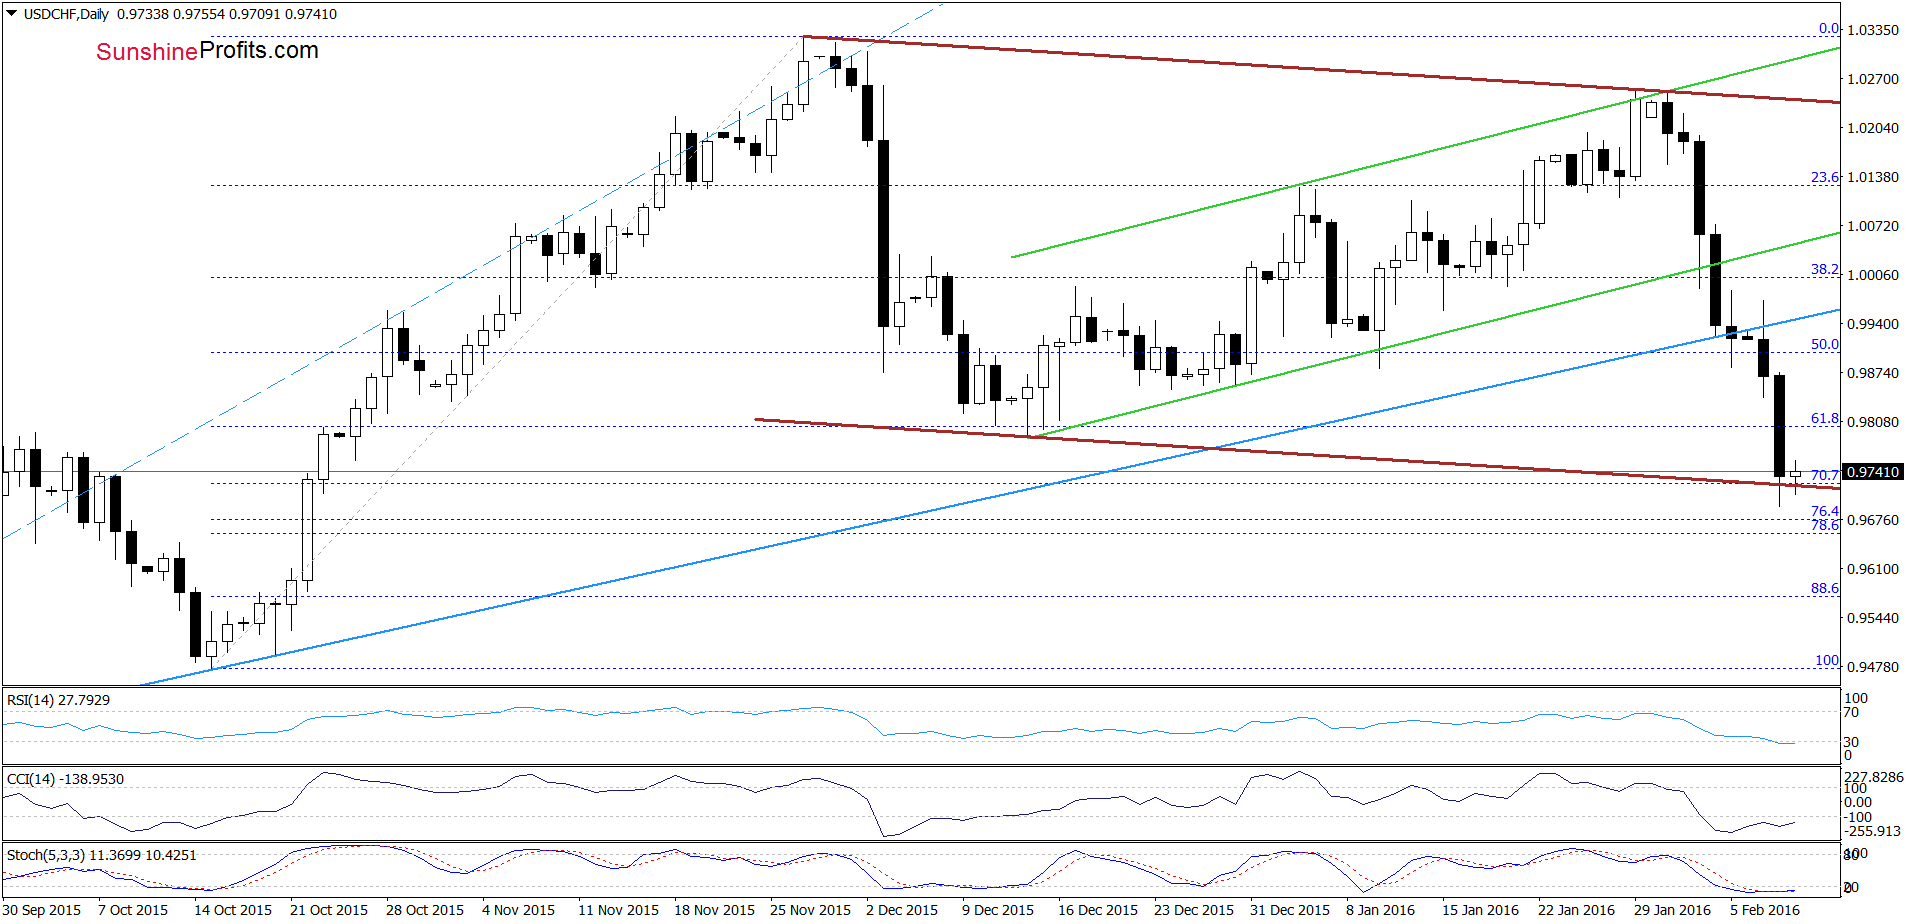
The first thing that catches the eye on the above charts is a breakdown under the medium-term blue support line. This is a negative signal, which suggests further deterioration and a drop to the green support line (marked on the weekly chart) based on the mid-Dec low of 0.9785 (the bottom of the previous bigger pullback). If it is broken, the next downside target for currency bears would be the lower border of the brown declining trend channel marked on the daily hart (currently around 0.9720).
From today’s point of view, we see that the situation developed in line with the above scenario and the pair reached our downside target. Taking into account the fact that the recent downward move is almost equal to the decline between the Nov 27 high and the Dec 14 low, we think that reversal and higher values of the exchange rate are just around the corner. The pro-growth scenario is also reinforced by the current position of the indicators (they are very close to generating buy signals) and the long-term picture below.
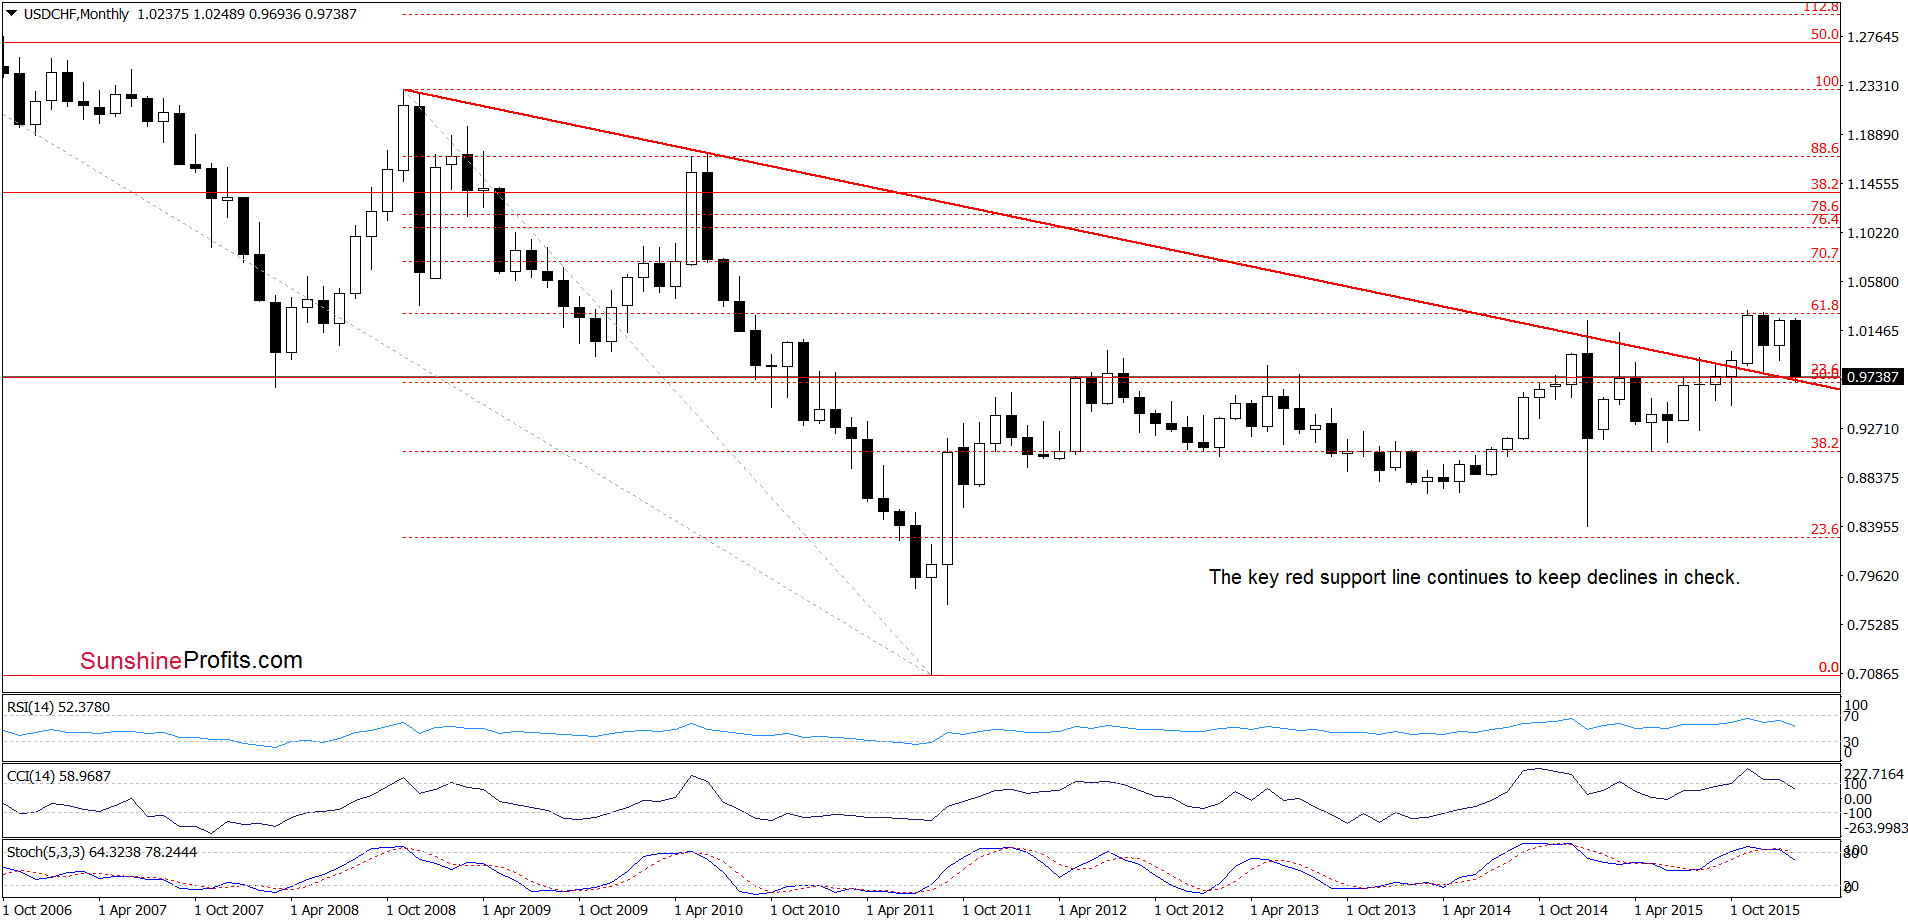
Looking at the long-term chart, we see that the pair declined to the very important support line based on the Nov 2008 and Jun 2010 highs. As you see on the chart, this line was strong enough to stop declines in Dec, which suggests that we may see similar price action in the coming weeks. If this is the case and the pair moves higher from here, the initial upside target would be around 0.9949, where the previously-broken blue support/resistance line (marked on the daily chart) is.
Very short-term outlook: bullish
Short-term outlook: mixed with bullish bias
MT outlook: mixed with bullish bias
LT outlook: mixed
Trading position (short-term; our opinion): Long positions (with a stop-loss order at 0.9633 and the initial upside target at 1.0239) are justified from the risk/reward perspective. We will keep you informed should anything change, or should we see a confirmation/invalidation of the above.
AUD/USD
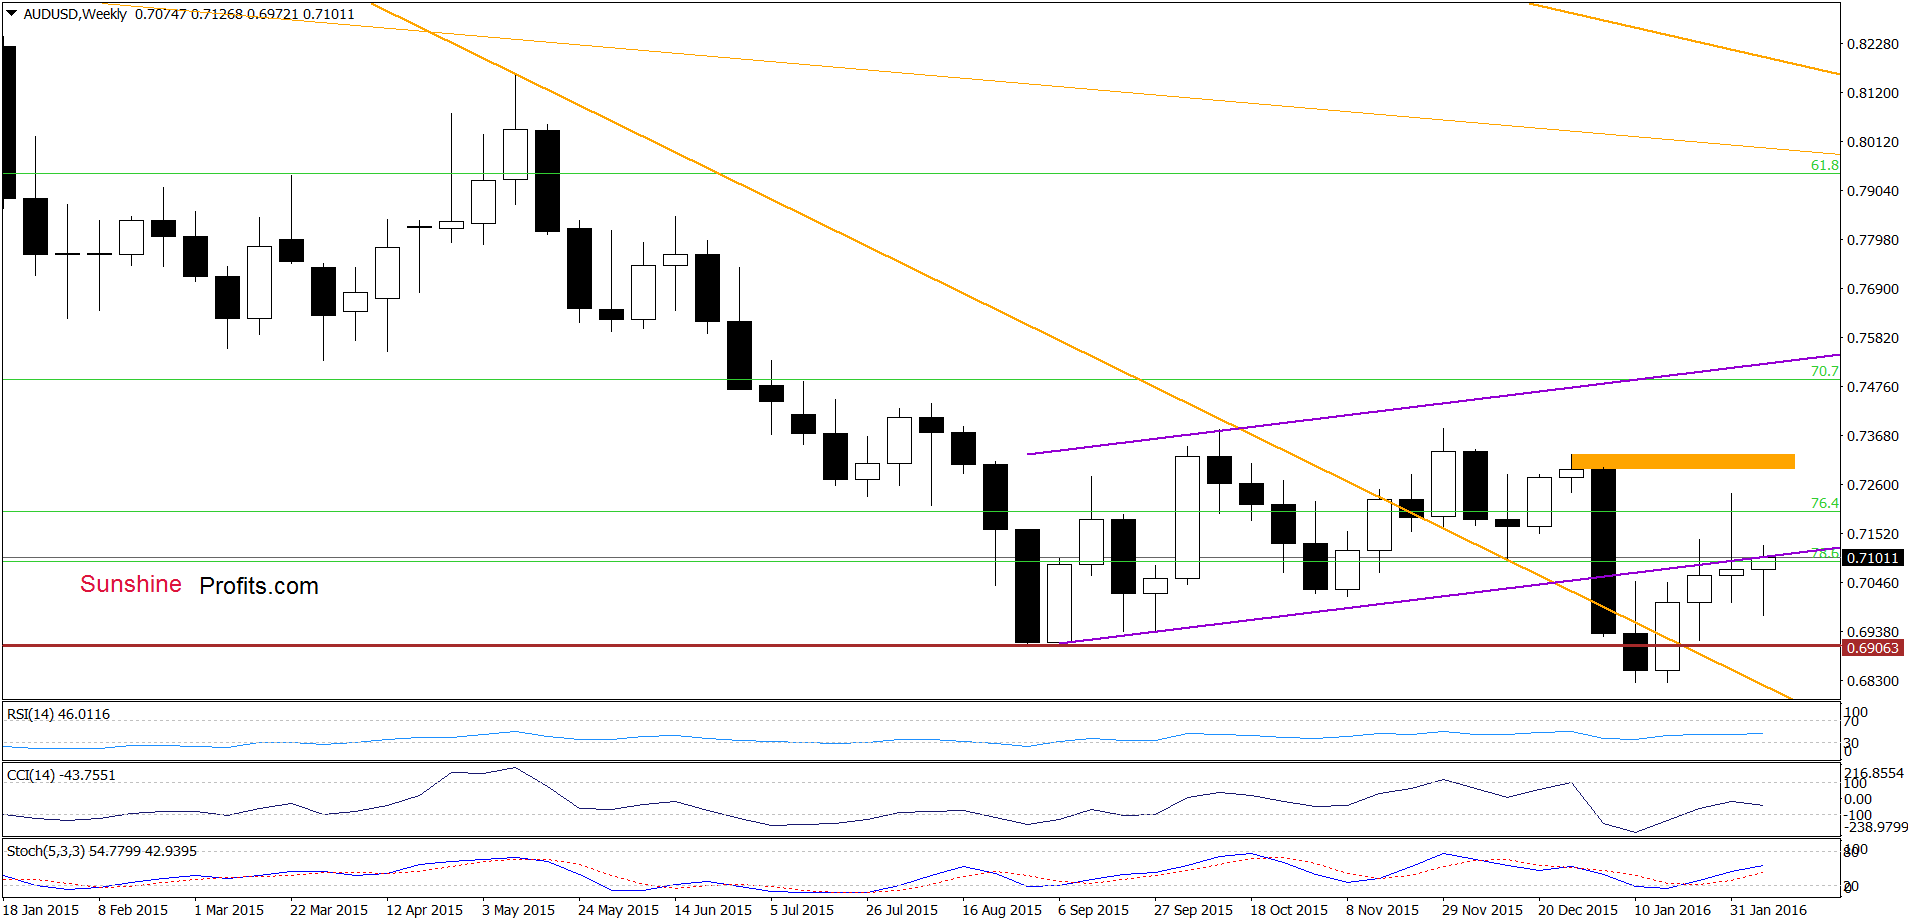
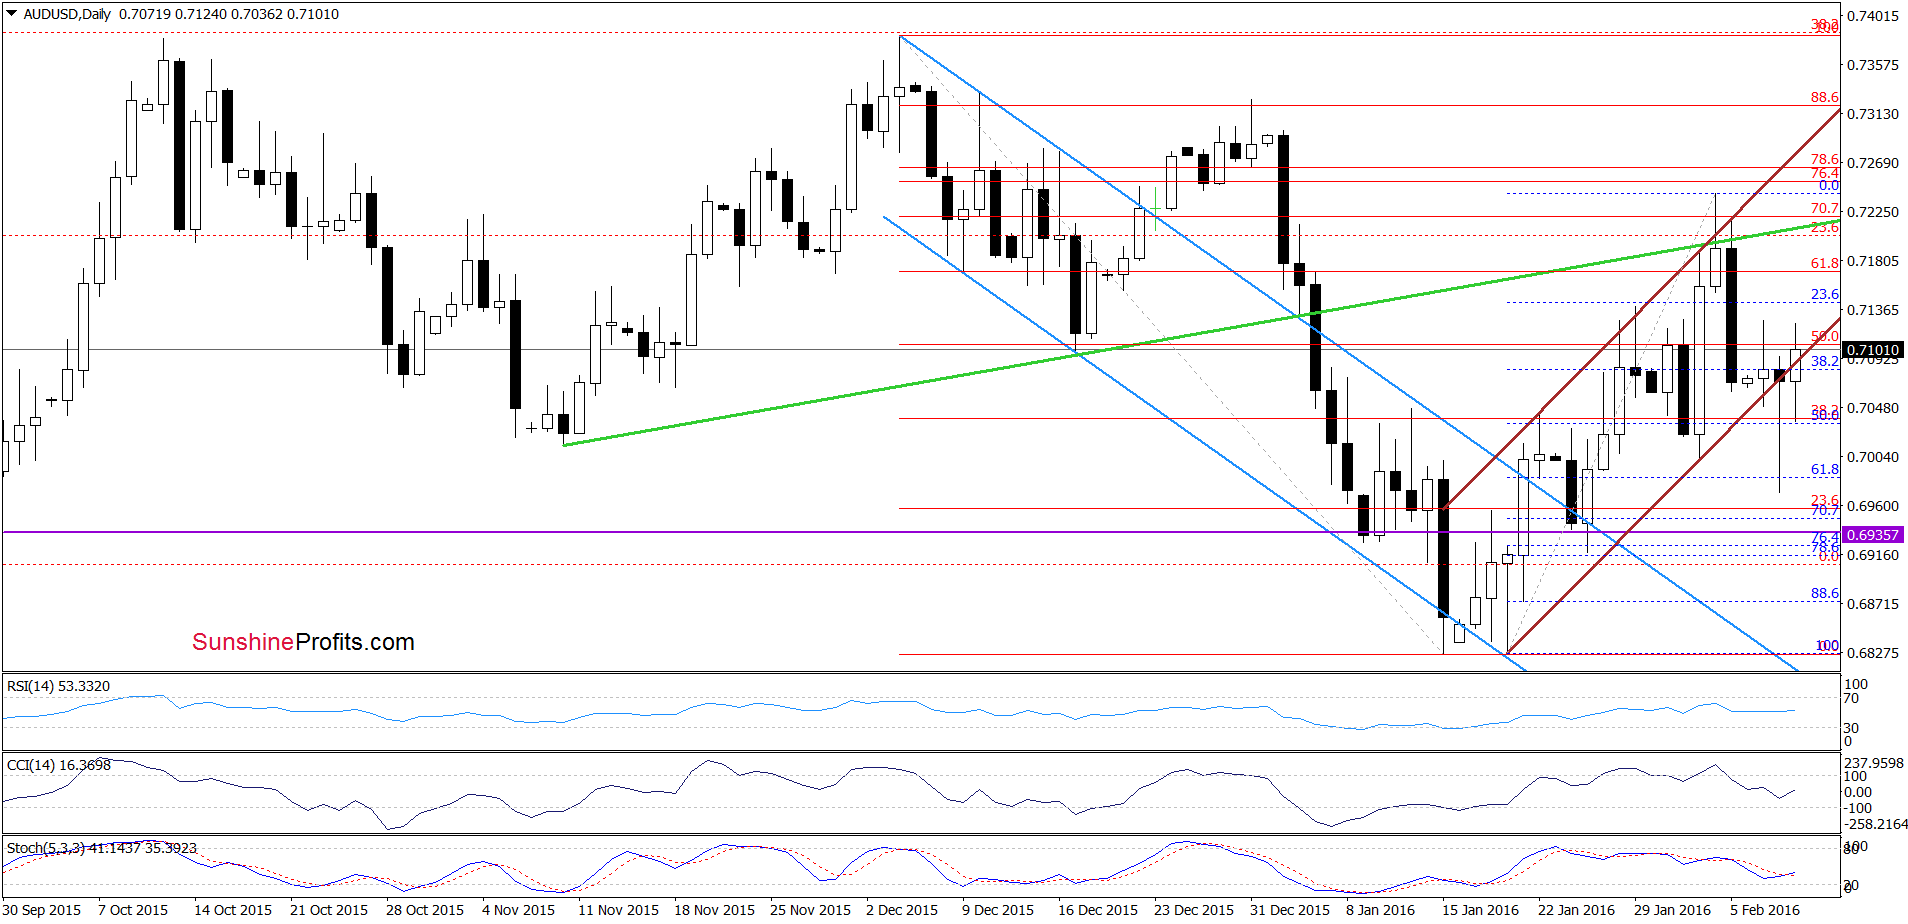
On the daily chart, we see that currency bears pushed the pair under the lower order of the brown rising trend channel, which triggered a decline to the 61.8% Fibonacci retracement. As you see, this support level encouraged currency bulls to act, which resulted in a sharp rebound and the pair invalidated the breakdown below the lower line of the trend channel earlier today. Taking this fact into account and combining it with the current position of the indicators, we think that further improvement is just around the corner. Nevertheless, in our opinion, another sizable rally would be more reliable if the pair climbs above the lower border of the purple rising trend channel marked on the weekly chart.
Very short-term outlook: mixed with bullish bias
Short-term outlook: mixed with bullish bias
MT outlook: mixed
LT outlook: mixed
Trading position (short-term; our opinion): No positions are justified from the risk/reward perspective. We will keep you informed should anything change, or should we see a confirmation/invalidation of the above.
Thank you.
Nadia Simmons
Forex & Oil Trading Strategist
Forex Trading Alerts
Oil Investment Updates
Oil Trading Alerts

