

Earlier today, data showed that job advertisements in Australia dropped by 0.4% in the previous month, which in combination with disappointing data from China (China's Caixin manufacturing PMI slipped to 47.8 in July from 48.2 in June) pushed AUD/USD lower. As a result, the exchange rate slipped under important support lines. Will we see a fresh 2015 low in the coming week?
In our opinion the following forex trading positions are justified - summary:
EUR/USD
In our alert posted on Wednesday, we wrote the following:
(…) there were several intra-week breakouts above this major resistance in the previous weeks, but none of them was successful. Therefore, in our opinion, the current breakout will be bullish only if we see a weekly close above this key support/resistance line.
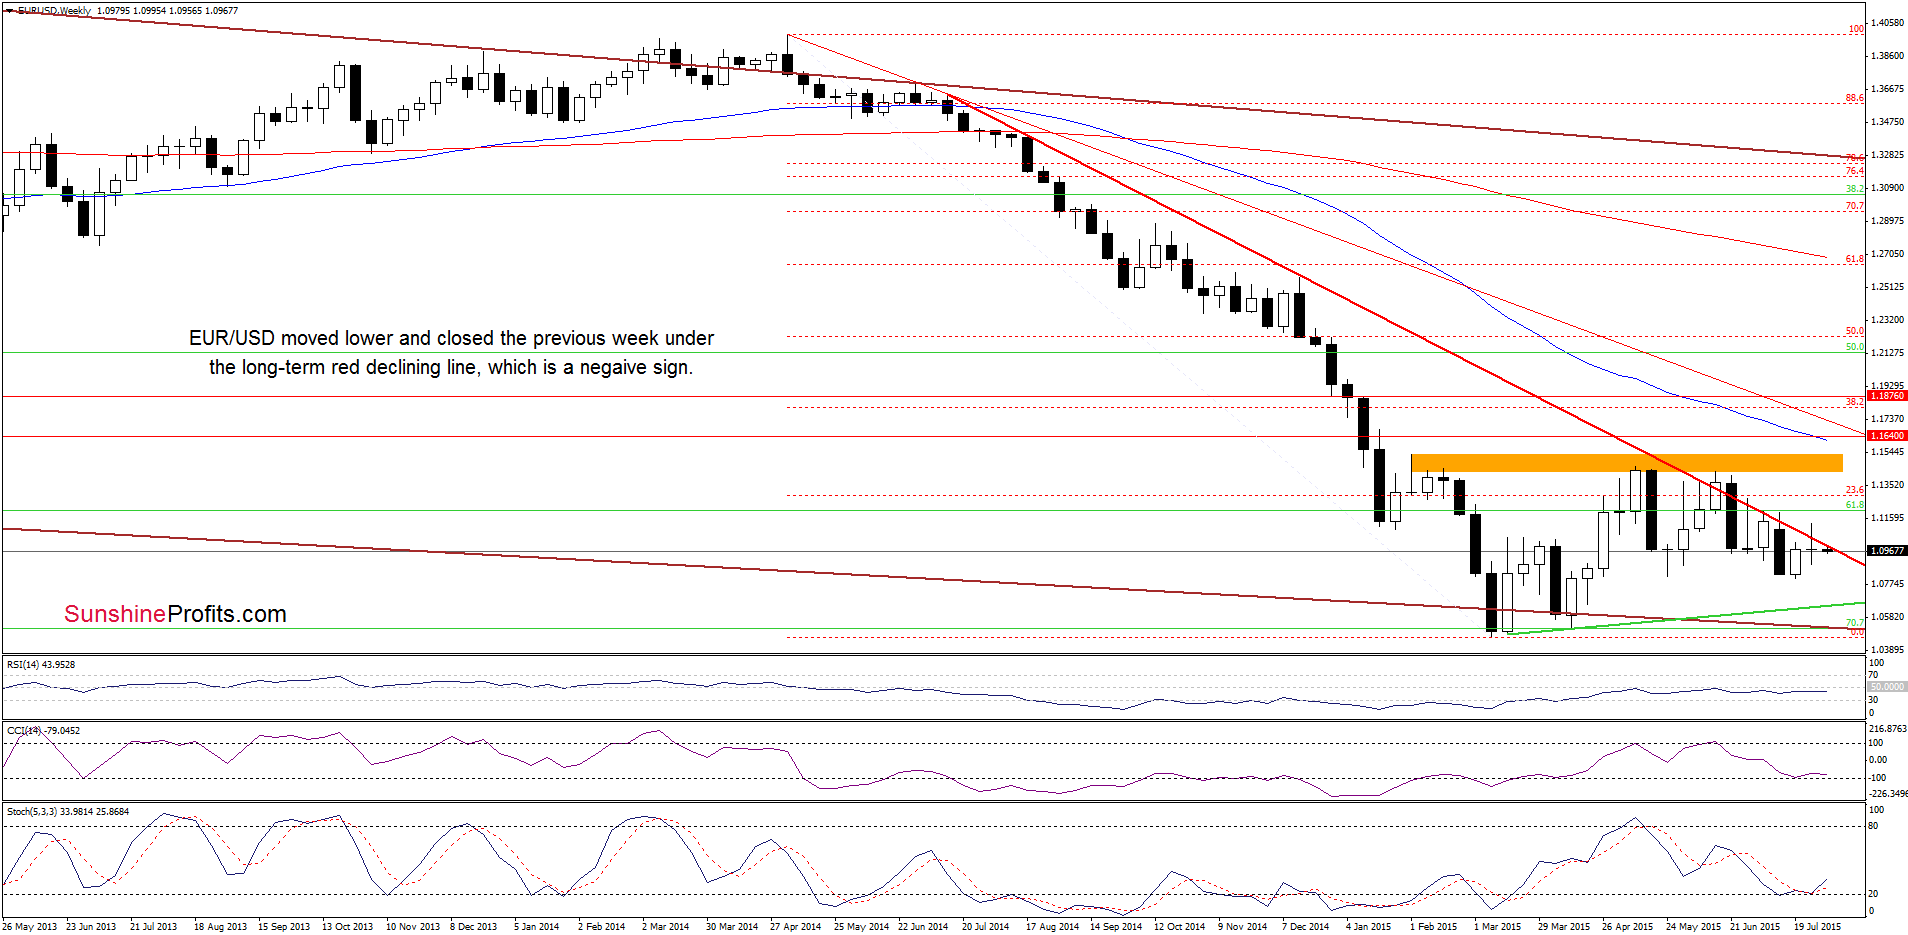
Looking at the weekly chart, we see that currency bulls didn’t manage to hold gained levels and EUR/USD declined below the previously-broken long-term red declining support/resistance line, which is a negative signal that suggests another attempt to move lower in the coming week.
Are there any other factors that could encourage currency bears to act? Let’s examine the daily chart and find out.
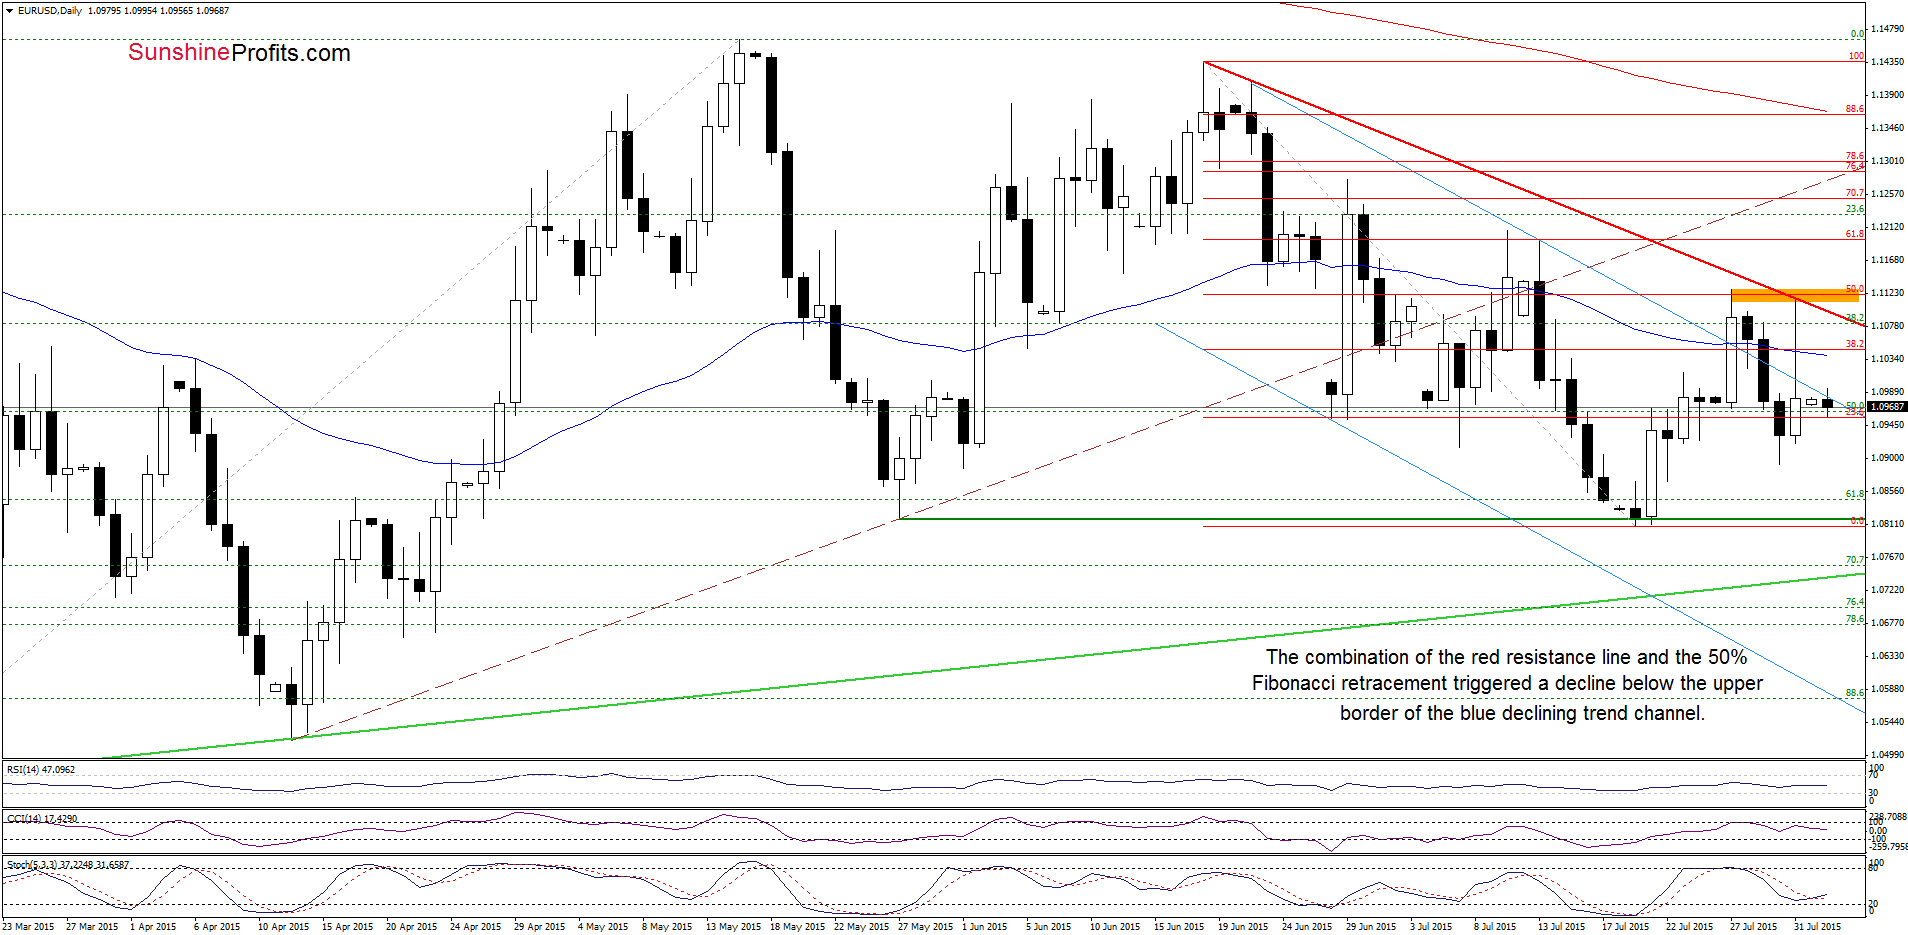
From this perspective we see that although EUR/USD moved sharply higher on Friday, the combination of the red declining resistance line and the 50% Fibonacci retracement stopped further improvement and triggered a decline below the previously-broken upper border of the blue declining trend channel. Although currency bulls tried to push the pair higher earlier today, they failed, which suggests that another downward move is just around the corner (especially when we factor in the medium-term picture). Please note that if the pair extends losses, the initial downside target would be around 1.0892, where the Jul 30 low is.
Very short-term outlook: mixed with bearish bias
Short-term outlook: mixed
MT outlook: mixed
LT outlook: mixed
Trading position (short-term; our opinion): No positions are justified from the risk/reward perspective at the moment. We will keep you informed should anything change, or should we see a confirmation/invalidation of the above.
USD/JPY
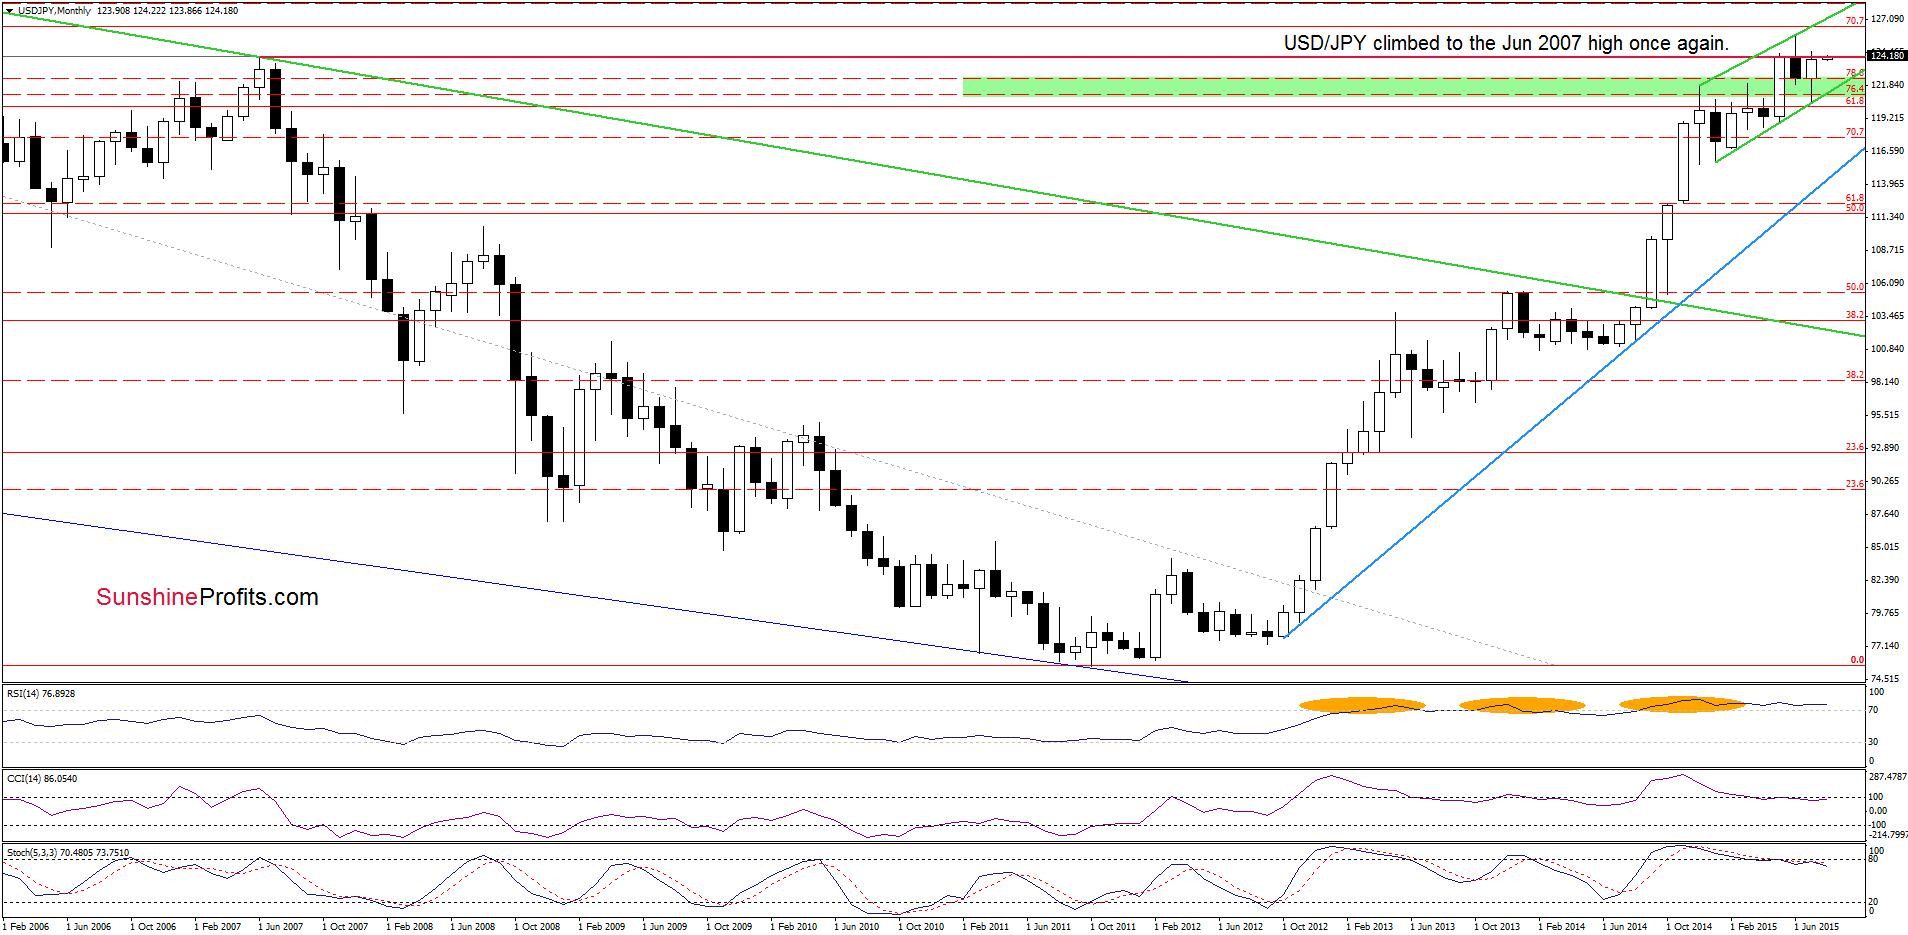
The situation in the medium term hasn’t changed much as USD/JPY is trading slightly below the June 2007. Today, we’ll focus on the very short-term picture.
Quoting our Wednesday’s alert:
(…) the pair is trading in a consolidation, which means that a breakout/breakdown will indicate the direction of future moves. However, taking into account buy signal generated by the Stochastic Oscillator, it seems that currency bulls will test the yellow resistance zone in the coming days once again.
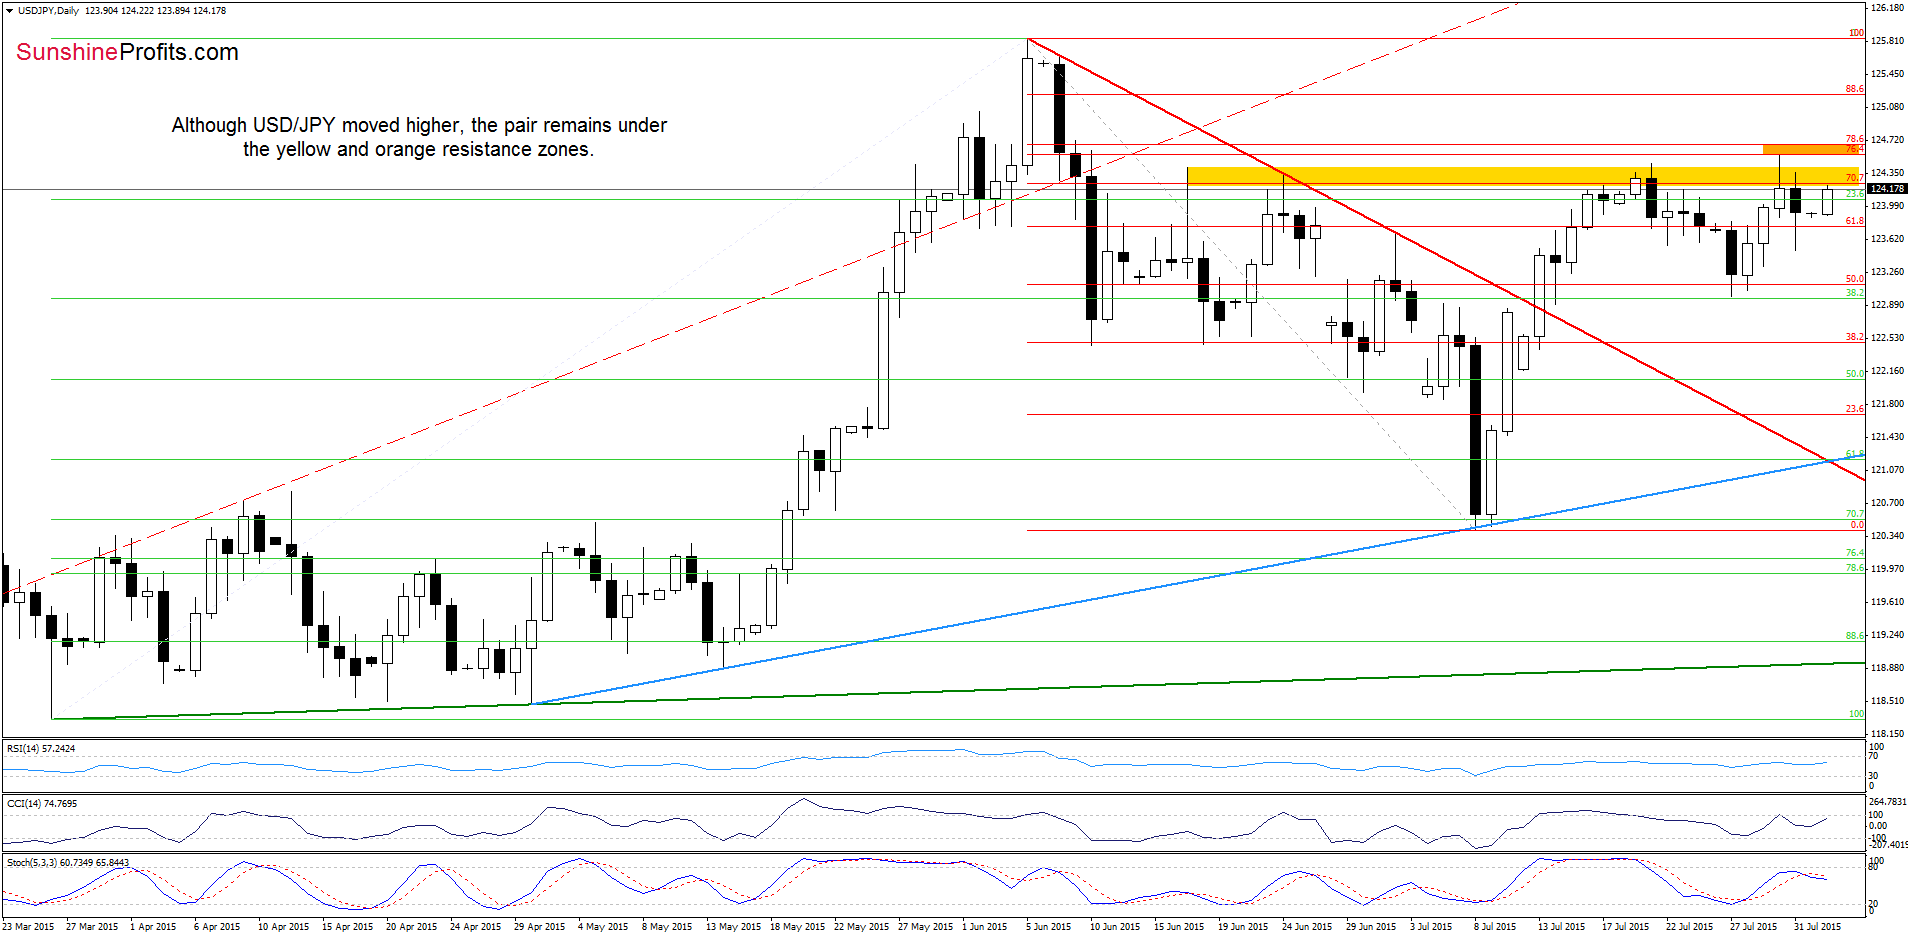
Looking at the daily chart we see that the situation developed in line with the above scenario and USD/JPY not only reached our upside target, but also climbed to the orange resistance zone (created by the 76.4% and 78.6% Fibonacci retracement) on Thursday. Despite this improvement, the resistance area stopped further rally and triggered a pullback. Nevertheless, currency bulls didn’t give up and pushed the pair higher earlier today. What’s next? In our opinion, even if we see another breakout above the yellow zone, there won’t be a sizable rally as long as the orange resistance area keeps gains in check.
Very short-term outlook: mixed
Short-term outlook: mixed
MT outlook: mixed
LT outlook: mixed
Trading position (short-term; our opinion): No positions are justified from the risk/reward perspective at the moment. We will keep you informed should anything change, or should we see a confirmation/invalidation of the above.
AUD/USD
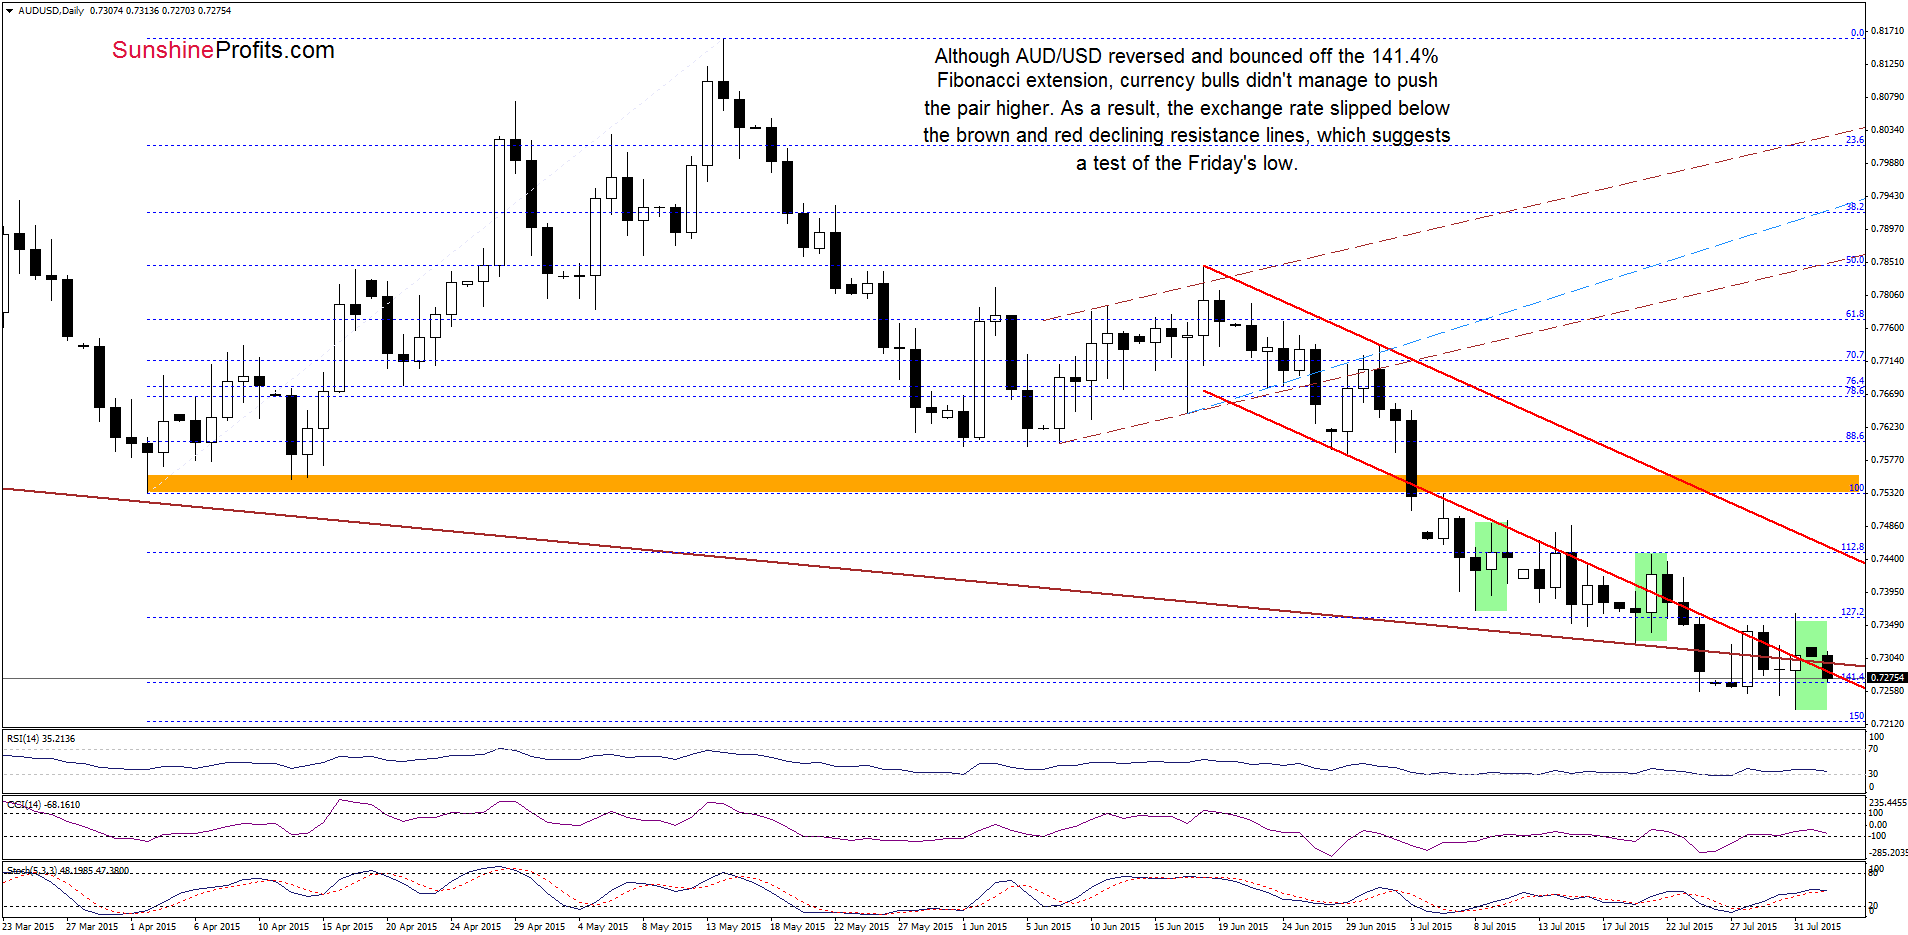
From today’s point of view, we see that although AUD/USD reversed and bounced off the 141.4% Fibonacci extension on Friday, currency bulls didn’t manage to push the exchange rate higher (this one-day rally wasn’t bigger than previous upswings marked with green, which means that the downtrend remains in place). As a result, the pair reversed and declined below the red and brown resistance lines, which is a negative sign that suggests further deterioration and a test of the Friday’s low of 0.7233 in the coming day(s).
What could happen if this support is broken? Let’s take a look at the eekly chart and find out.
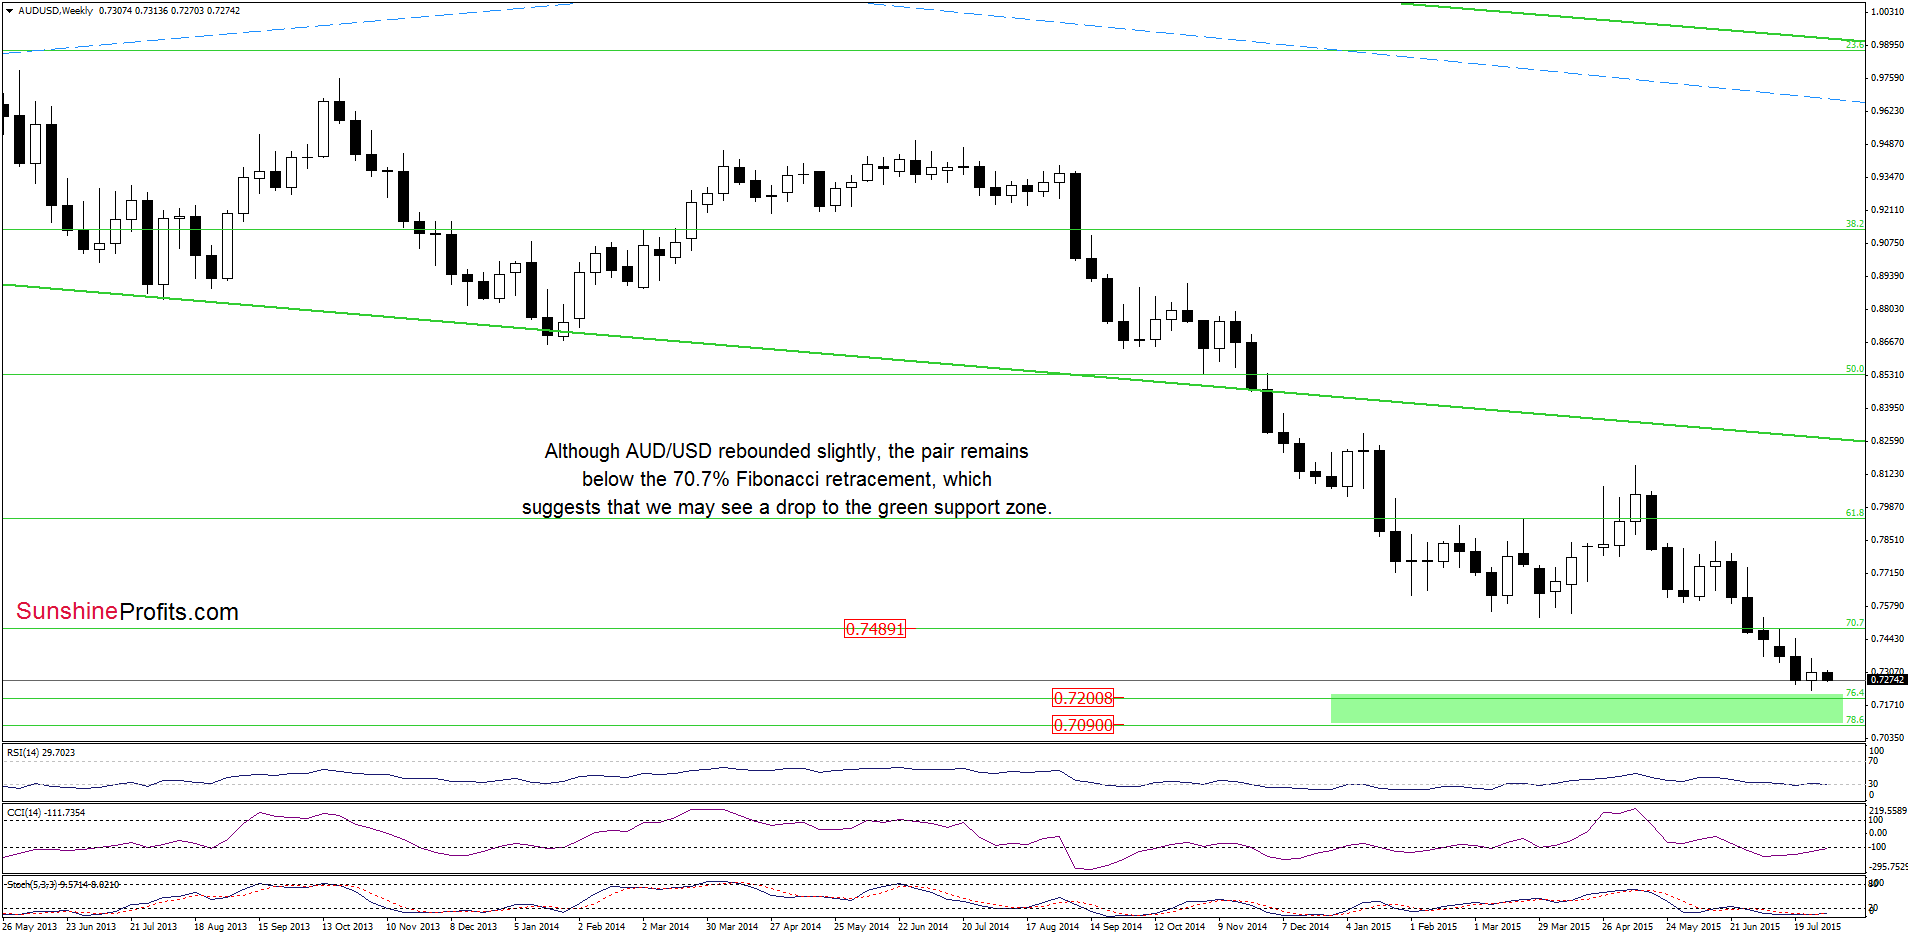
Taking into account the fact that AUD/USD remains under the 70.7% Fibonacci retracement, we think that if currency bears manage to push the exchange rate lower, we’ll see a decline even to (around 0.7097-0.7200, where the green support zone based on the 76.4% and 78.6% Fibonacci retracement levels (marked on the weekly chart) is.
Very short-term outlook: mixed with bearish bias
Short-term outlook: mixed with bearish bias
MT outlook: mixed
LT outlook: mixed
Trading position (short-term; our opinion): No positions are justified from the risk/reward perspective at the moment. We will keep you informed should anything change, or should we see a confirmation/invalidation of the above.
Thank you.
Nadia Simmons
Forex & Oil Trading Strategist
Przemyslaw Radomski, CFA
Founder, Editor-in-chief
Gold & Silver Trading Alerts
Forex Trading Alerts
Oil Investment Updates
Oil Trading Alerts

