
Earlier today, the U.S. Commerce Department reported that new home sales dropped by 2.4% to 412,000 units last month, missing expectations for an increase of 5.7%. Because of these disappointing numbers, USD/JPY declined and came back below the previously-broken resistance zone. Are there any other technical factors that could take the pair lower?
In our opinion the following forex trading positions are justified - summary:
EUR/USD
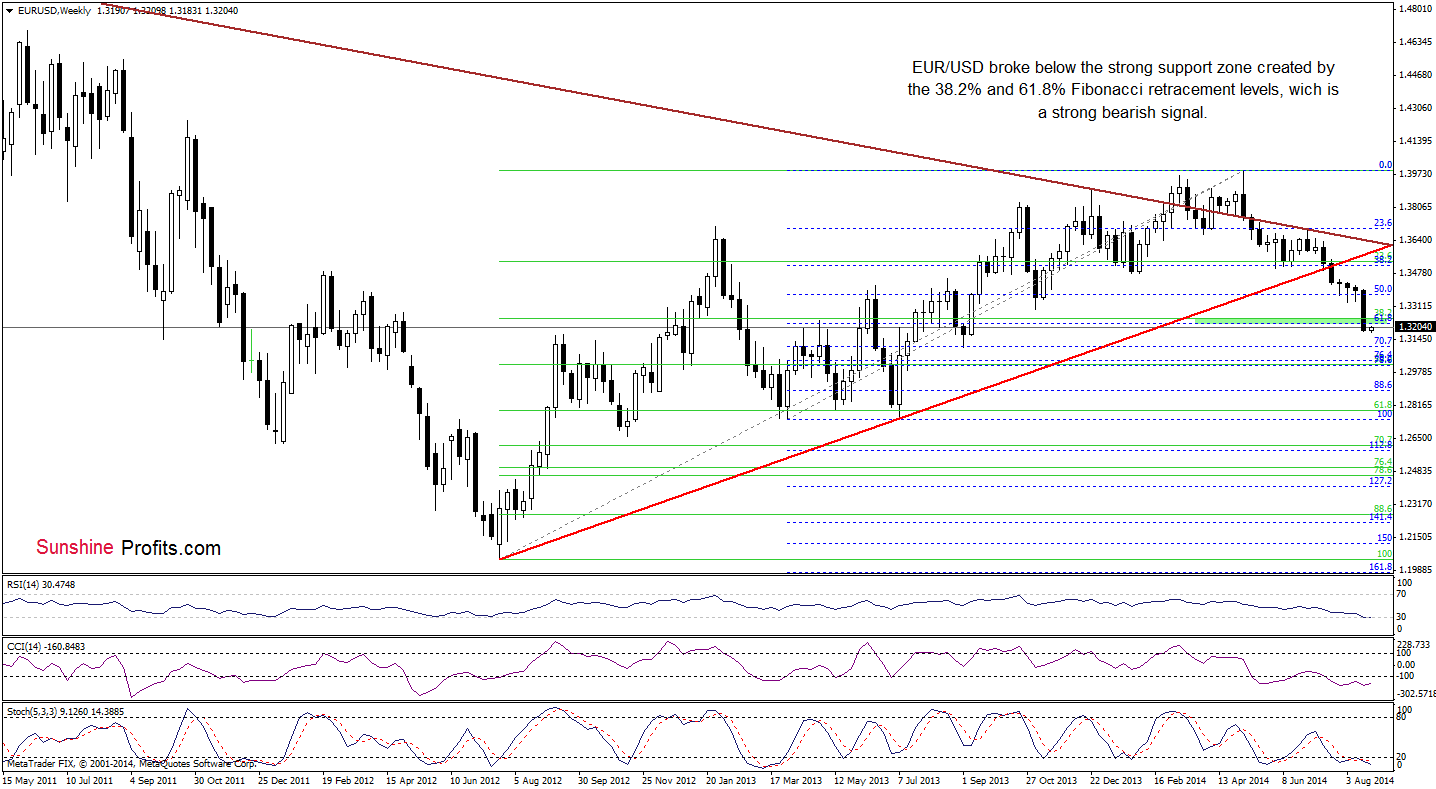
Looking at the weekly chart, we see that the situation in the medium-term has deteriorated as EUR/USD extended losses and closed the previous week below the strong support zone created by the 38.2% and 61.8% Fibonacci retracement levels. This is a strong bearish signal, which suggests further deterioration and a drop to around 1.3104-1.3109, were the 70.7% Fibonacci retracement meets the September low.
As you see on the above chart, although the RSI declined to its lowest level since July 2012 (while the CCI and Stochastic Oscillator are oversold) suggesting a pause or corrective upswing, we should keep in mind that as long as there is no invalidation of the breakdown below the green area, another attempt to move lower can’t be ruled out.
Are there any short-term supports that could stop currency bears? Let’s check.
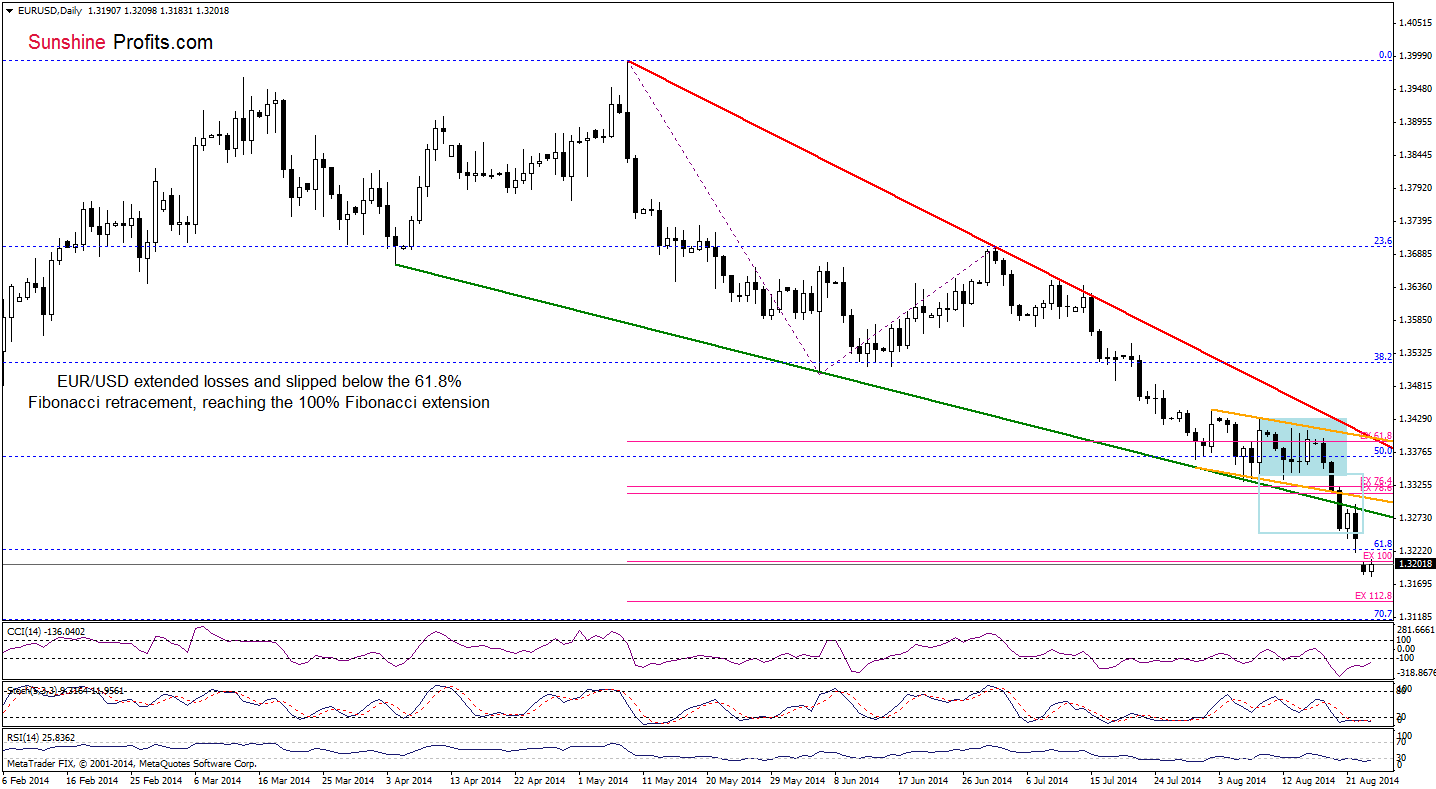
Although EUR/USD moved higher earlier today, the upswing is barely visible from this perspective. Additionally, the exchange rate still remains not only below the previously-broken lower border of the declining wedge, but also under the 61.8% Fibonacci retracement, which serves as the nearest resistance. Despite all these negative factors, we should keep in mind that EUR/USD reached the 100% Fibonacci price projections (based on the May and July highs and the June low). What does it mean for the exchange rate? In many cases in the past, such important support level triggered a corrective upswing. Therefore, we may see a similar price action in the coming days – especially if the indicators generate buy signals.
Very short-term outlook: mixed
Short-term outlook: mixed
MT outlook: mixed
LT outlook: bearish
Trading position (short-term): In our opinion no positions are justified from the risk/reward perspective. We will keep you informed should anything change, or should we see a confirmation/invalidation of the above.
USD/JPY
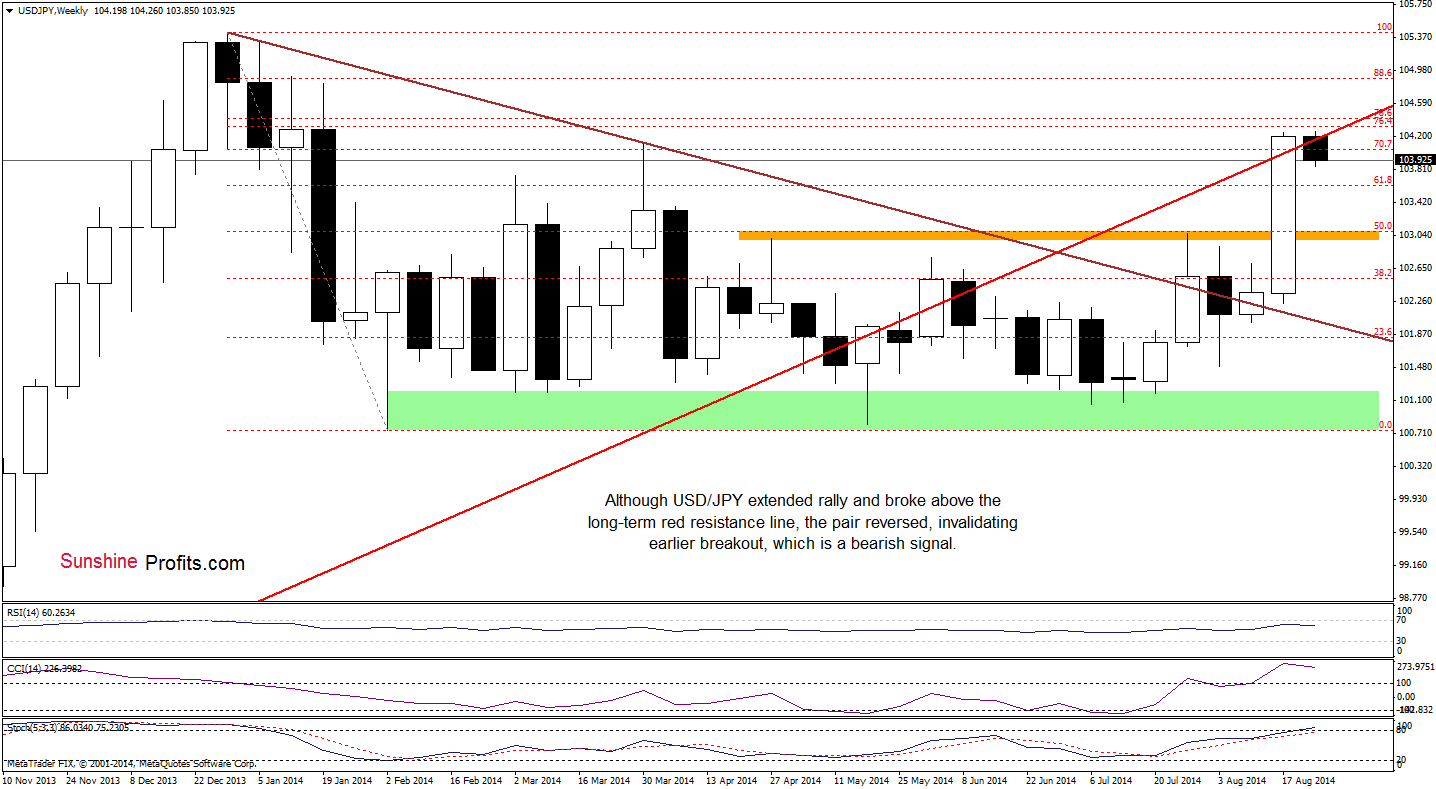
On the above chart, we see that although USD/JPY extended rally in the previous week and broke above the strong resistance zone created by the long-term red resistance line and the 70.7% Fibonacci retracement, currency bulls didn’t manage to old gained levels and the pair reversed. As a result, the exchange rate declined below the above-mentioned lines, invalidating earlier breakout. This is a negative signal, which suggests further deterioration. However, as long as there are no sell signals, another attempt to move higher can’t be ruled out.
Will the daily chart give us more clues about future moves? Let’s check.
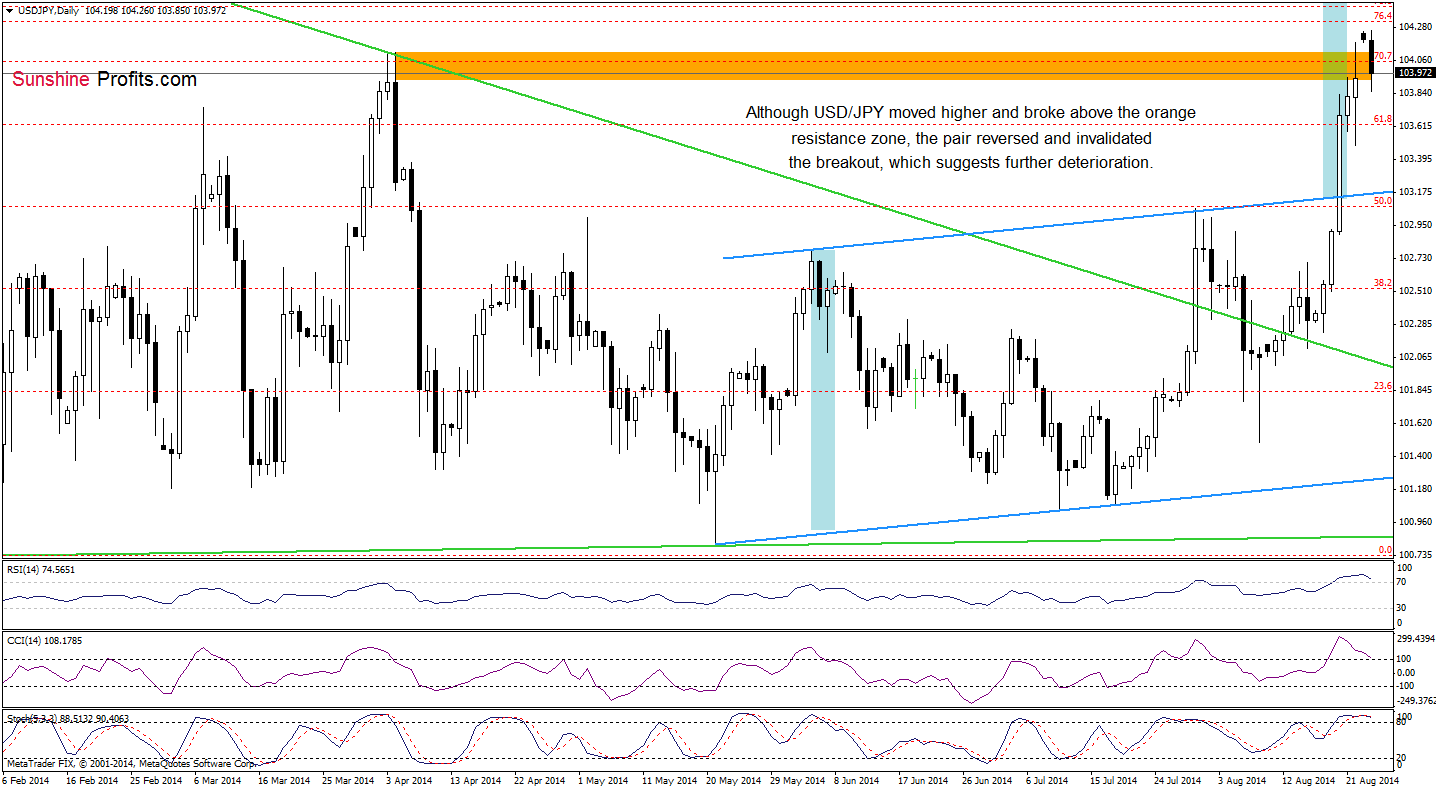
On the above chart, we see that although USD/JPY extended rally, the proximity to the next resistance zone (created by the 76.4% and 78.6% Fibonacci retracement levels) encouraged currency bears to act. As a result, the pair reversed and dropped below the orange resistance zone, invalidating earlier breakout. Taking this bearish signal into account, and combining it with the current position of the indicators (the RSI remains above the level of 70, while the CCI and Stochastic Oscillator are overbought and very close to generate sell signals), it seems to us that the next move will be to the downside. If this is the case, we may see a drop even to the previously-broken upper line of the rising trend channel in the coming days (currently around 103.18).
Very short-term outlook: mixed with bearish bias
Short-term outlook: mixed with bearish bias
MT outlook: mixed
LT outlook: bearish
Trading position (short-term): In our opinion no positions are justified from the risk/reward perspective at the moment. We will keep you informed should anything change, or should we see a confirmation/invalidation of the above.
AUD/USD
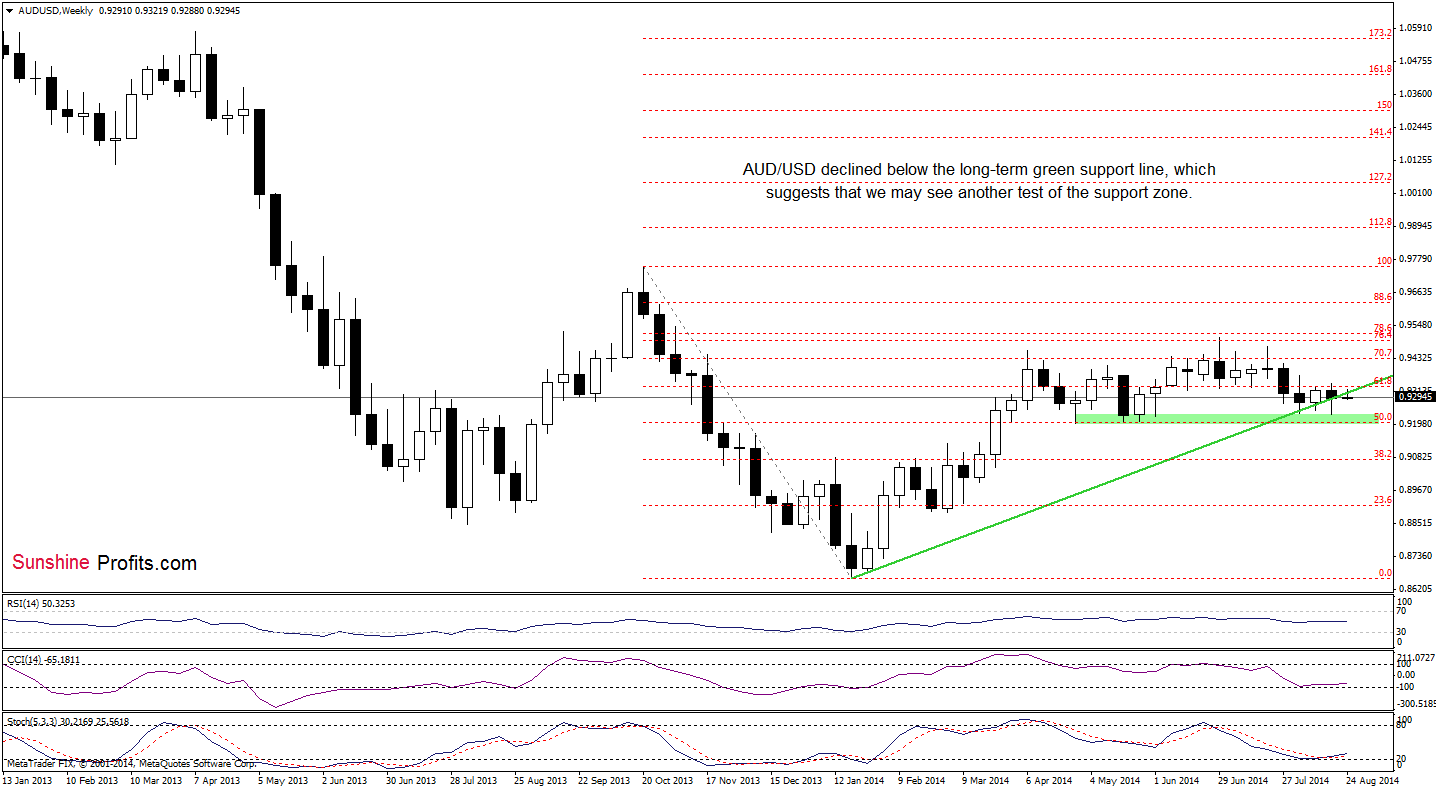
The medium-term picture has deteriorated as AUD/USD declined below the long-term green line, which suggests that we may see another test of the strength of the green support zone.
Having say that, let’s take a closer look at the daily chart.
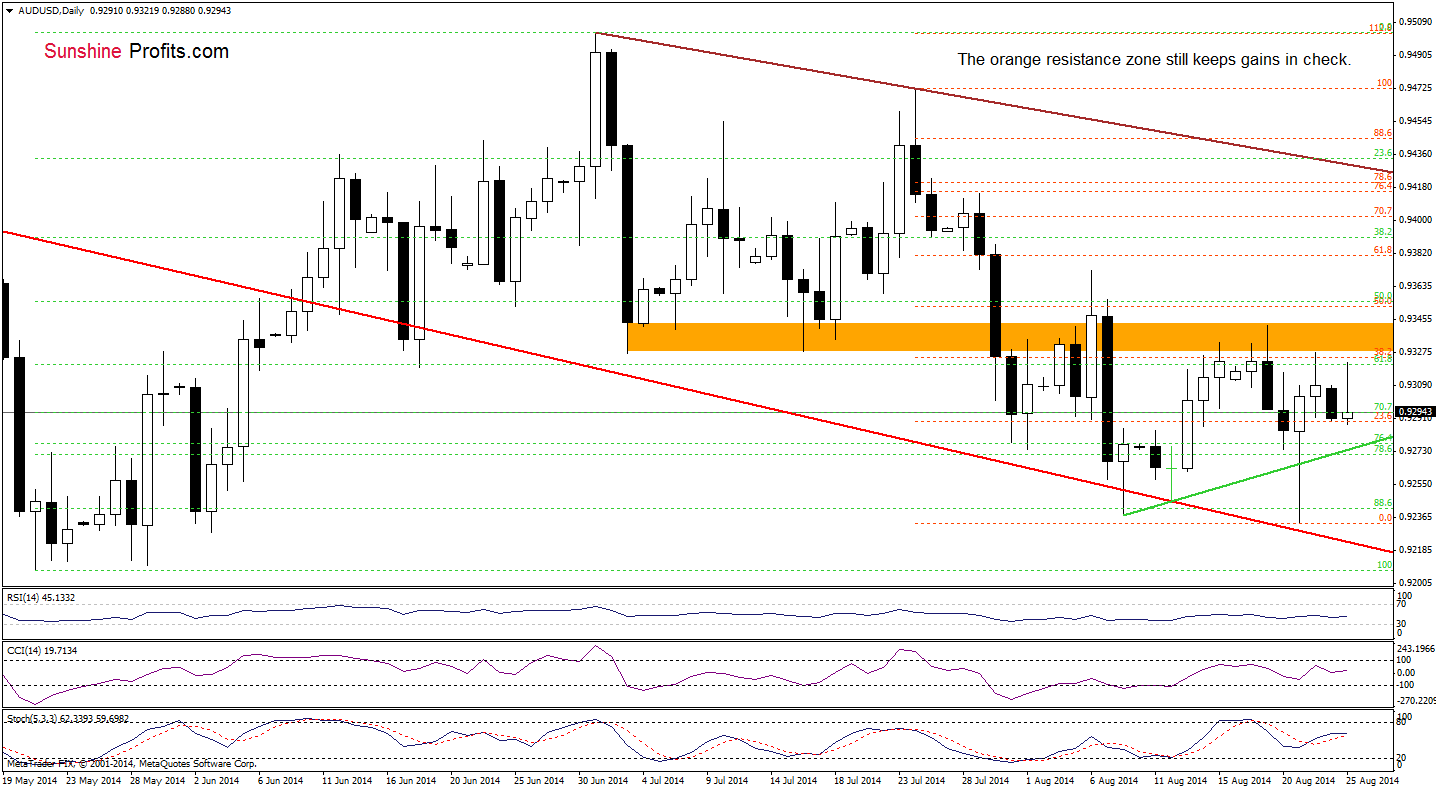
From this perspective, we see that the orange resistance zone still holds, therefore, what we wrote in our last Forex Trading Alert is up-to-date:
(…) What’s next? If this area holds, we’ll see another downswing and a test of the strength of the green support line (or even the recent low).
Very short-term outlook: mixed with bearish bias
Short-term outlook: mixed
MT outlook: mixed
LT outlook: bearish
Trading position (short-term): In our opinion, no positions are justified from the risk/reward perspective. We will keep you informed should anything change, or should we see a confirmation/invalidation of the above.
Thank you.
Nadia Simmons
Forex & Oil Trading Strategist
Przemyslaw Radomski, CFA
Founder, Editor-in-chief
Gold & Silver Trading Alerts
Forex Trading Alerts
Oil Investment Updates
Oil Trading Alerts

