
Earlier today, the U.S. dollar moved slightly lower against major currencies as investors stay at the sidelines, eyeing a highly anticipated speech by Federal Reserve Chair Janet Yellen later in the day for further indications on the central bank's next policy moves.
Before we know Ms. Yellen's comments, let’s jump to the world of charts and find out what is the technical picture of major currency pairs.
In our opinion, the following forex trading positions are justified - summary:
EUR/USD
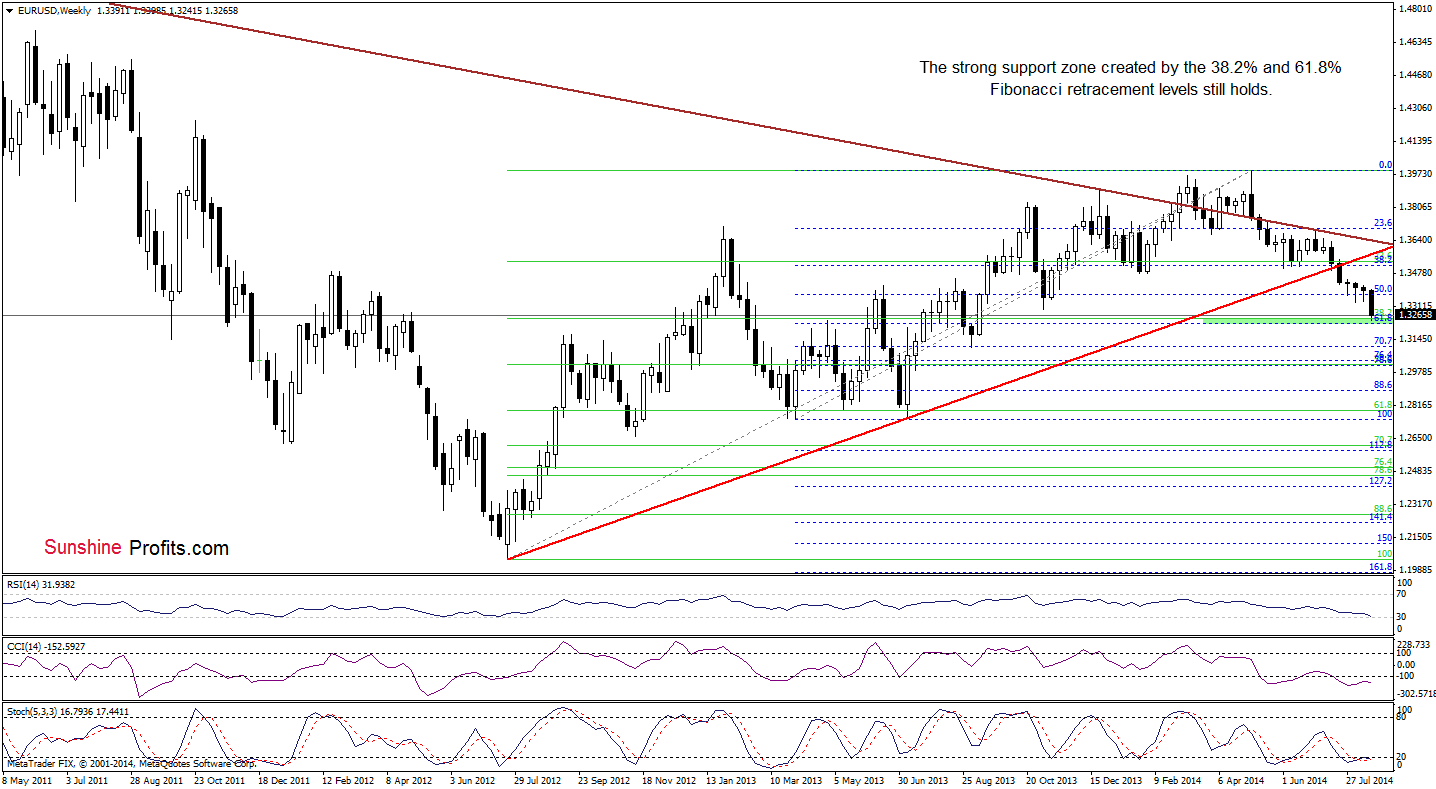
Looking at the above chart, we see that the situation in the medium-term hasn’t changed much, therefore, our last commentary on this currency pair is up-to-date:
(…) If this area encourages currency bulls to act, we’ll see further improvement and an increase to (at least) the August high of 1.3432. Please note that this scenario is currently reinforced by the position of the indicators (the RSI dropped to its lowest level since July 2012, while the Stochastic Oscillator generated a buy signal and the CCI is close to doing the same), which suggests that a pause (or corrective upswing) is just around the corner.
Will the daily chart give us more clues about future moves? Let’s check.
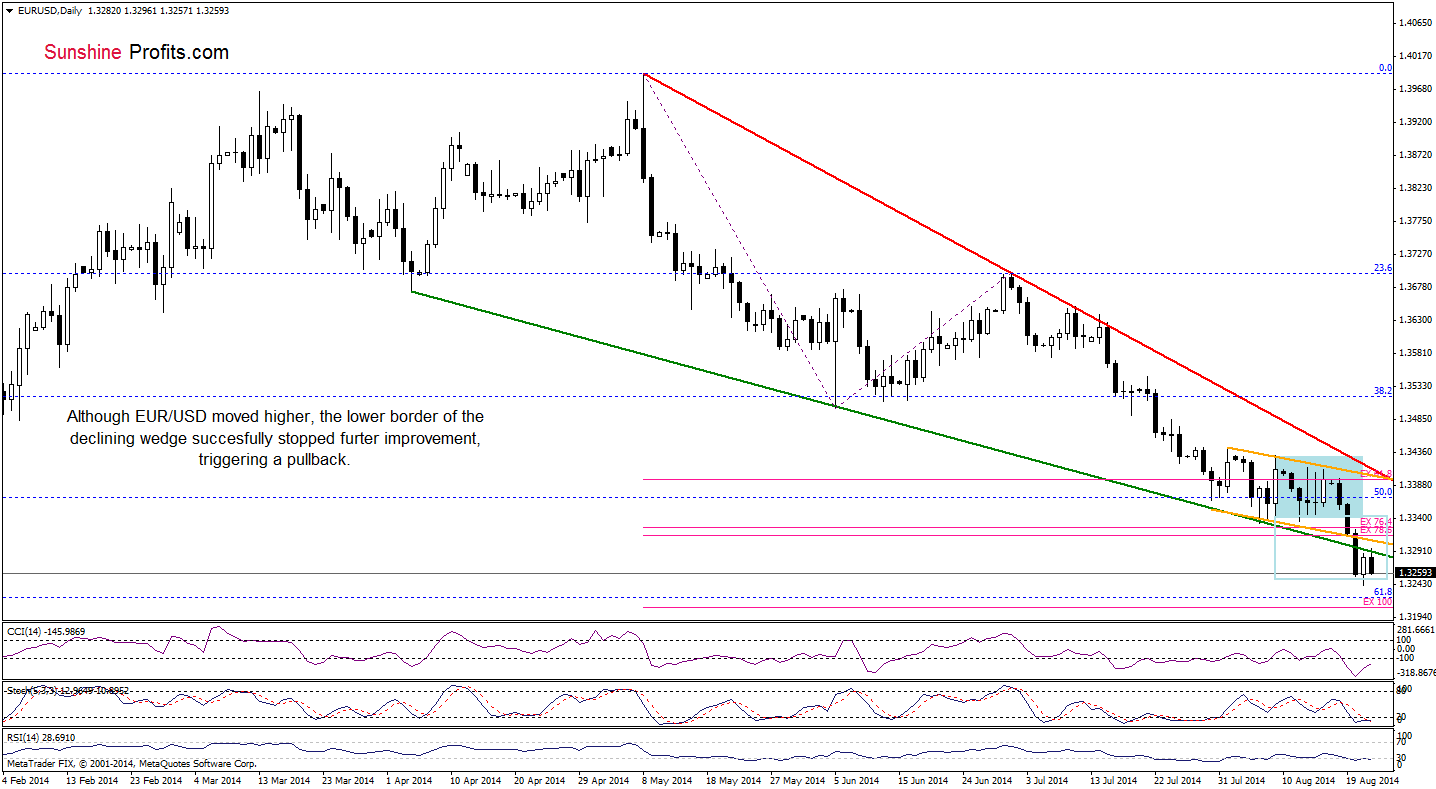
From this perspective, we see that although EUR/USD moved higher earlier today, the lower border of the declining wedge was strong enough to stop further improvement. As a result, the pair reversed and pulled back. Taking this fact into account, we believe that what we wrote yesterday is still valid:
(…) In our opinion, as long as there is no invalidation of the breakdown below this support/resistance line, another test of the strength of the support zone can’t be ruled out. So, when will the very short-term outlook improve? From today’s point of view, it seems that the situation will turn to bullish if EUR/USD breaks above the upper line of the declining wedge and the recent highs (around 1.3420-1.3444). At this point, it’s worth noting that this scenario will be more likely if the indicators generate buy signals.
Very short-term outlook: mixed
Short-term outlook: mixed
MT outlook: mixed
LT outlook: bearish
Trading position (short-term): In our opinion no positions are justified from the risk/reward perspective. We will keep you informed should anything change, or should we see a confirmation/invalidation of the above.
GBP/USD
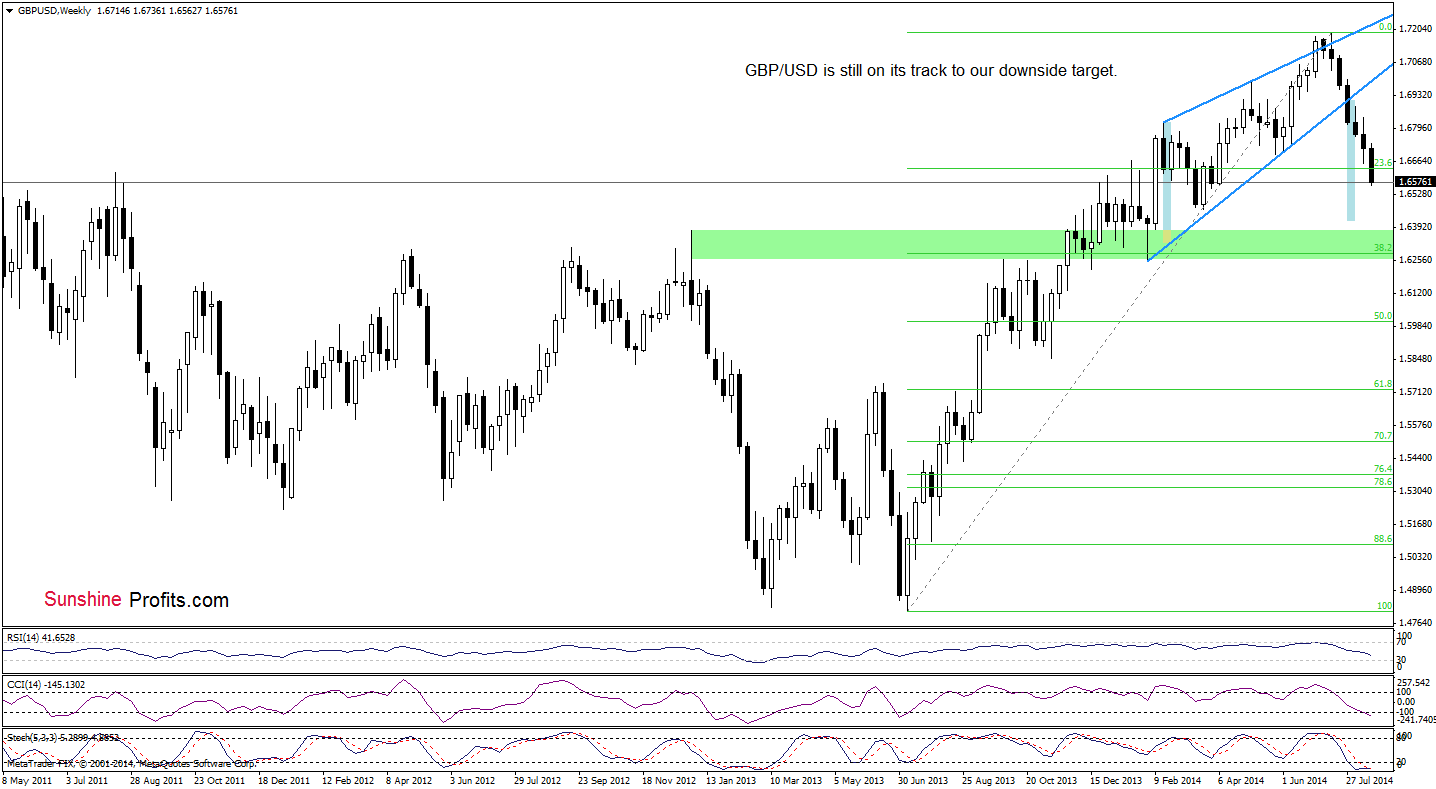
The medium-term picture remains almost unchanged, therefore, our yesterday’s commentary is up-to-date:
(…) GBP/USD extended declines, which suggests that currency bears will try to realize the above-mentioned scenario in the coming week (or weeks) – especially when we take into account the fact that there are no buy signals or positive divergences between the indicators and the exchange rate, which could bode well and precede a pause or an upswing in the nearest future.
Can we infer something more from the daily chart? Let’s check.
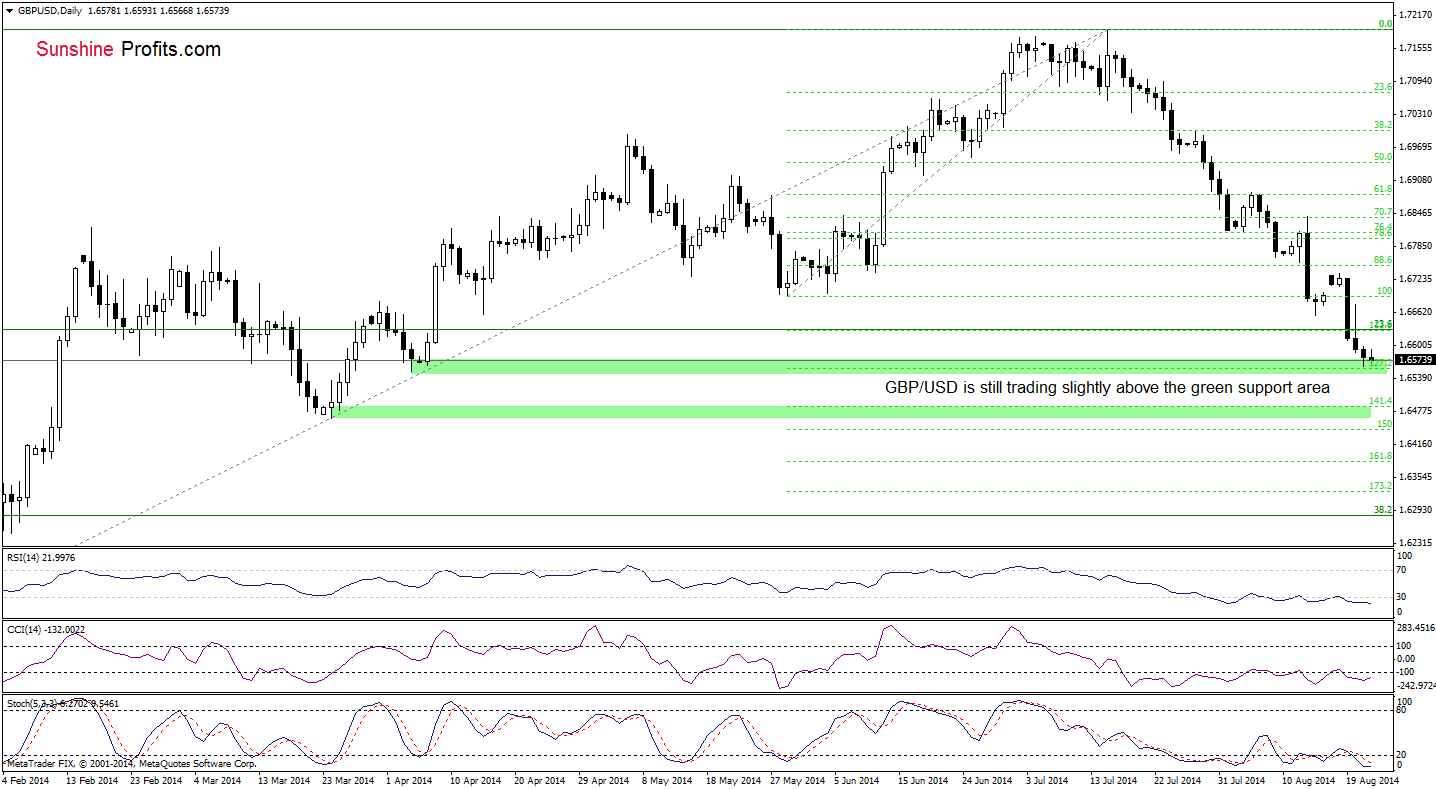
From this perspective, we see that the very short-term situation hasn’t changed much as GBP/USD is still trading slightly above the green support zone created by the April low and the 127.2% Fibonacci extension (based on the May-July rally). Taking this fact into account, our previous commentary is still valid:
(…) If this area holds, we’ll see a rebound from here and an increase to (at least) the Monday high of 1.6736. Nevertheless, if the exchange rate moves lower, the next target for currency bears will be around the March low, which is reinforced by the 141.4% Fibonacci extension. Please note that although the indicators are oversold, there are no buy signals at the moment, which supports the bearish case.
Very short-term outlook: mixed
Short-term outlook: mixed
MT outlook: bearish
LT outlook: mixed
Trading position (short-term): In our opinion, no positions are justified from the risk/reward perspective. We will keep you informed should anything change, or should we see a confirmation/invalidation of the above.
USD/JPY
On Wednesday, we wrote the following:
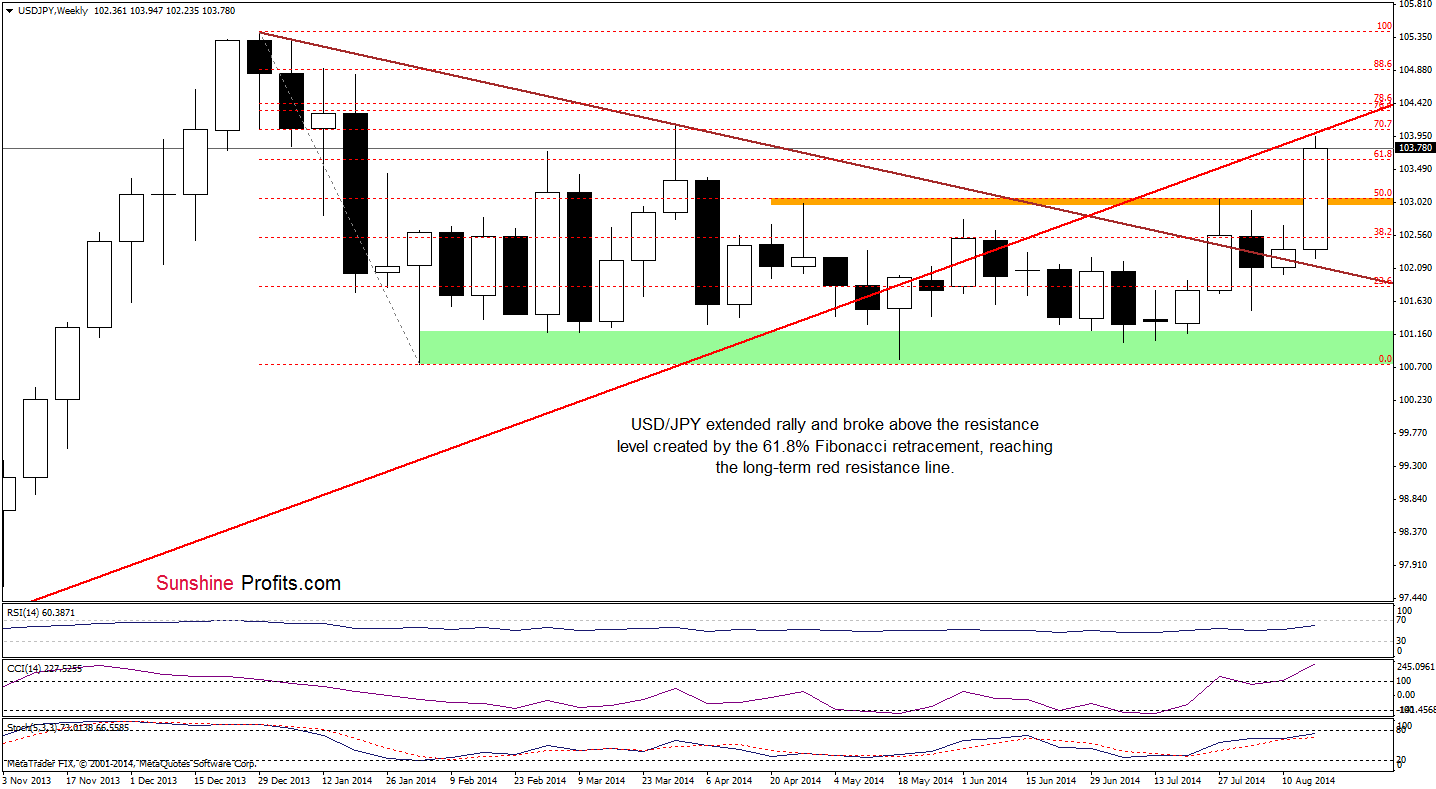
(…) USD/JPY bounced off the long-term declining support/resistance line and broke above the orange resistance zone created by the 50% Fibonacci retracement level and the recent highs. This is a bullish development, which suggests that we’ll see further improvement and an increase to (at least) the next Fibonacci retracement or even to the long-term red resistance line, which intersects the 70.7% Fibonacci retracement at the moment.
Looking at the above chart, we see that the situation developed in line with the above-mentioned bullish scenario and the exchange rate reached our upside target. What’s next? If the strong resistance zone created by the long-term red resistance line and the 70.7% Fibonacci retracement holds, we’ll see a pullback from here and a drop to the previously-broken orange resistance area (which currently serves as the nearest support). What could happen if currency bulls manage to push the pair higher? Let’s move on to the daily chart and look for answer.
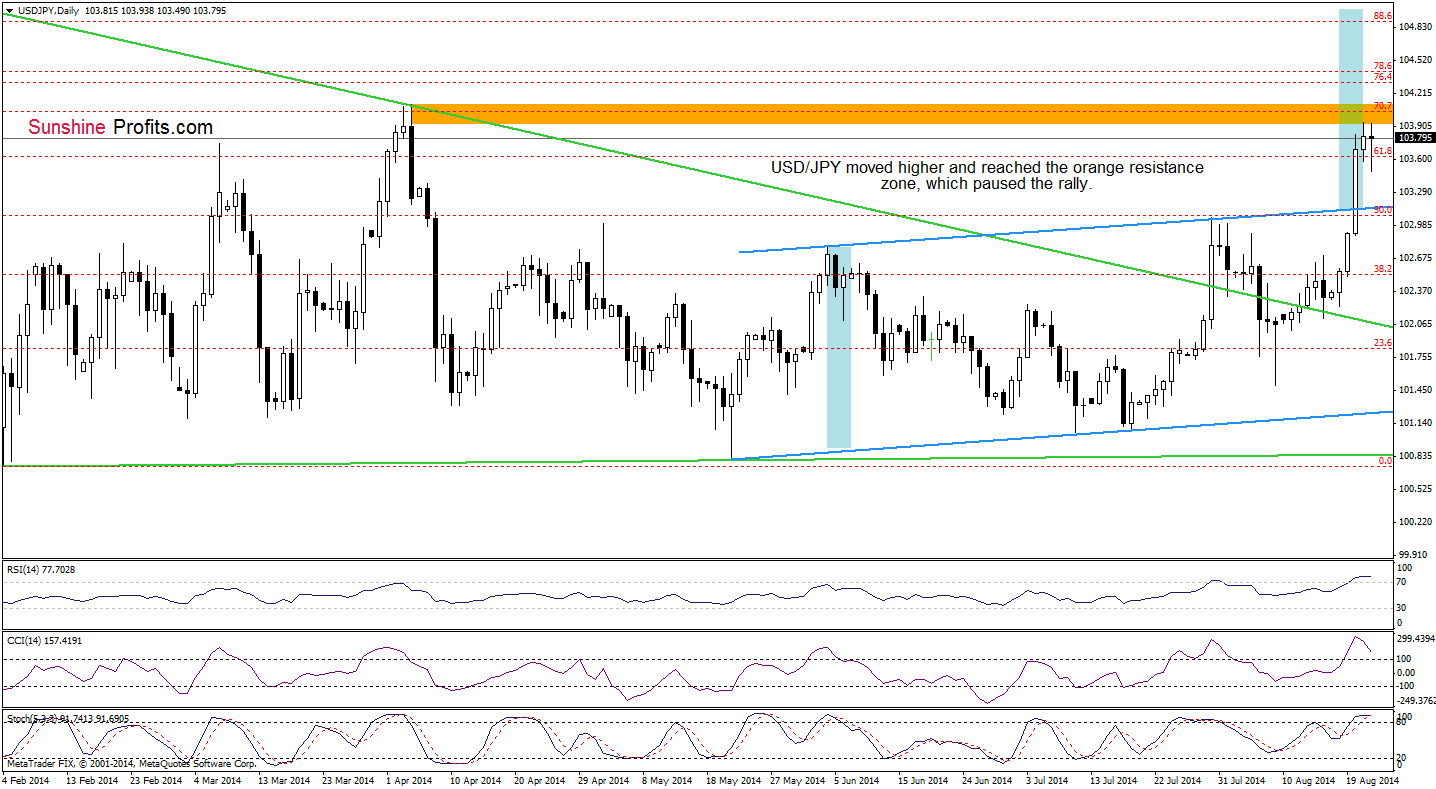
On the above chart, we see that USD/JPY extended rally and reached the orange resistance zone created by the April high and the 70.7% Fibonacci retracement. Earlier today, this area encouraged currency bears to act, which resulted in a pullback. Please note that although the pair is still trading near the recent highs, the current position of the indicators (the RSI still remains above the level of 70, while the CCI and Stochastic Oscillator are overbought) suggests that a pause (or a pullback) is just around the corner. If this is the case, the pair will likely reverse and come back to the upper line of the rising trend cannel, which serves as the nearest support. Nevertheless, taking into account the fundamental factor, which could have a great impact on today’s price action (the Federal Reserve Chair Janet Yellen's speech before the annual Jackson Hole economic symposium later in the day), we should also consider a bullish scenario. If USD/JPY breaks above the nearest resistance, we may see an increase even to around 104.81, where the size of the upswing will correspond to the height of the trend channel.
Very short-term outlook: mixed
Short-term outlook: mixed with bullish bias
MT outlook: mixed
LT outlook: bearish
Trading position (short-term): In our opinion no positions are justified from the risk/reward perspective at the moment. We will keep you informed should anything change, or should we see a confirmation/invalidation of the above.
USD/CAD
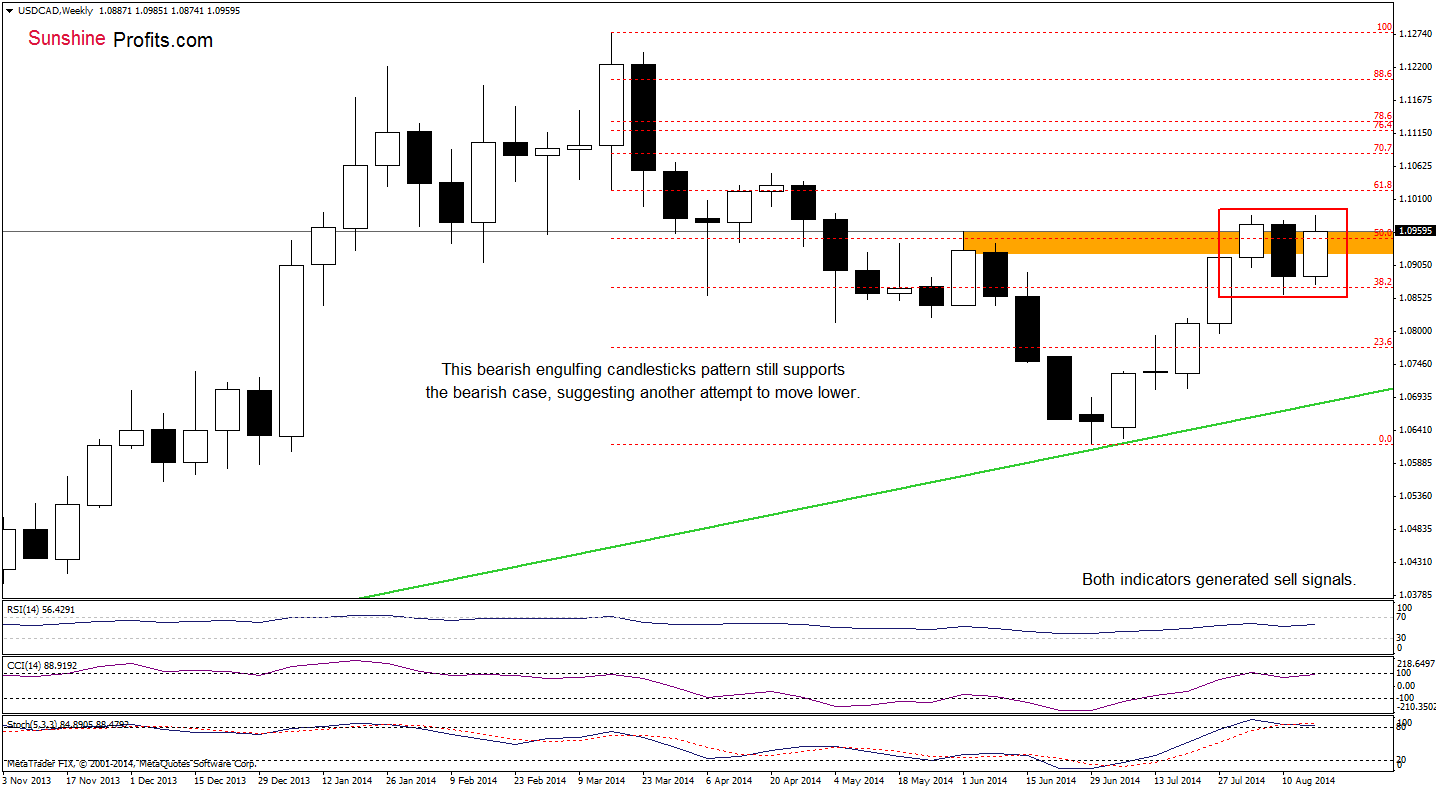
Although USD/CAD rebounded in the recent week, the situation in the medium term hasn’t changed mush as a bearish engulfing candlesticks pattern still supports currency bears, suggesting another attempt to move lower in the coming week (or even weeks). Will the daily chart give us more clues about future moves? Let’s check.
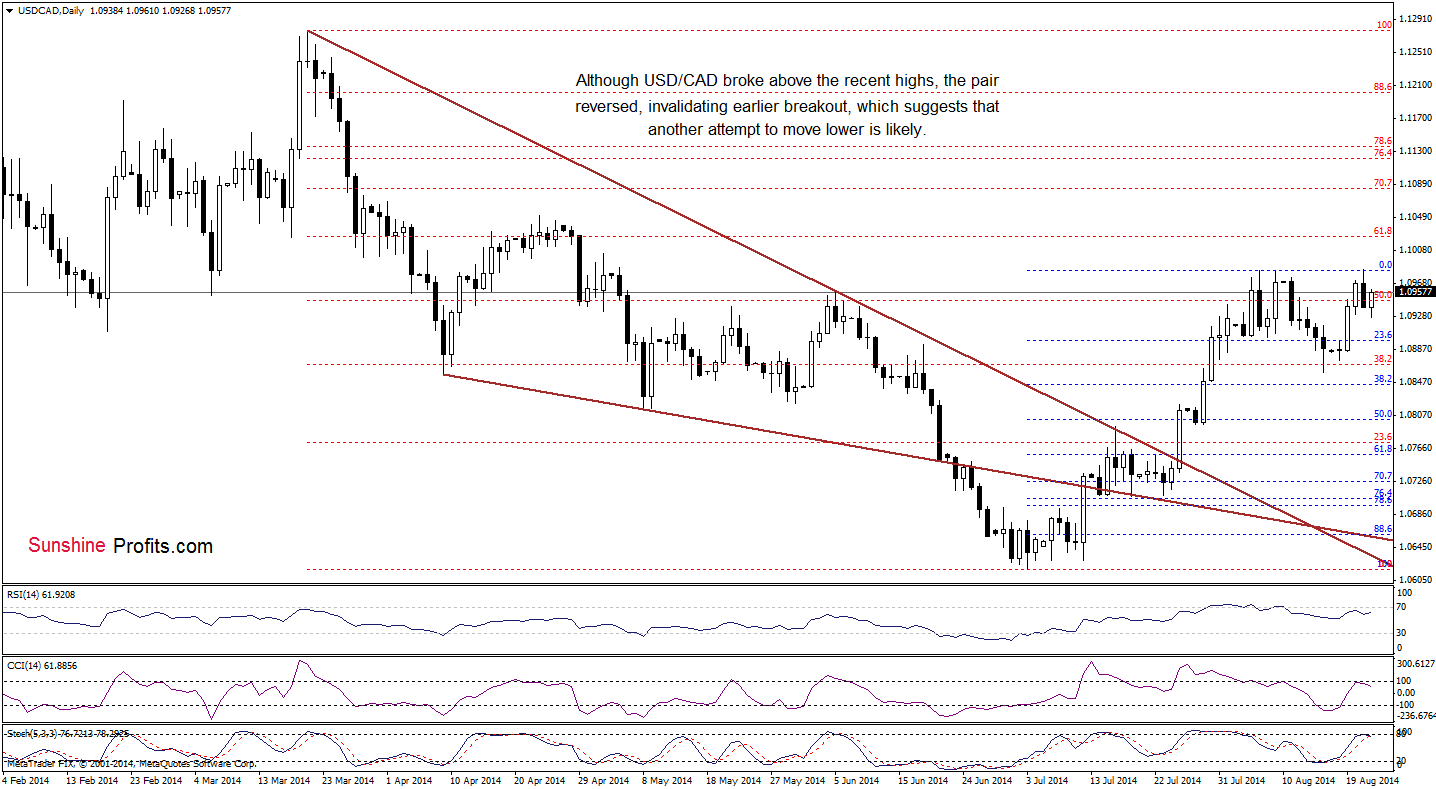
Looking at the above chart, we see that although USD/CAD rebounded and climbed above the recent high (which is barely visible from this perspective), the pair reversed and gave us some gains. As you know form our previous Forex Trading Alerts, an invalidation of the breakout is a bearish signal that suggests further deterioration. If this is the case, we’ll see a pullback from here and the first downside target will be the bottom of the recent correction (around 1.0860). At this point, it’s worth noting that the CCI and Stochastic Oscillator generated sell signals, which supports the bearish case at te moment.
Very short-term outlook: mixed with bearish bias
Short-term outlook: mixed with bearish bias
MT outlook: mixed
LT outlook: bearish
Trading position (short-term): In our opinion no positions are justified from the risk/reward perspective. We will keep you informed should anything change, or should we see a confirmation/invalidation of the above.
USD/CHF
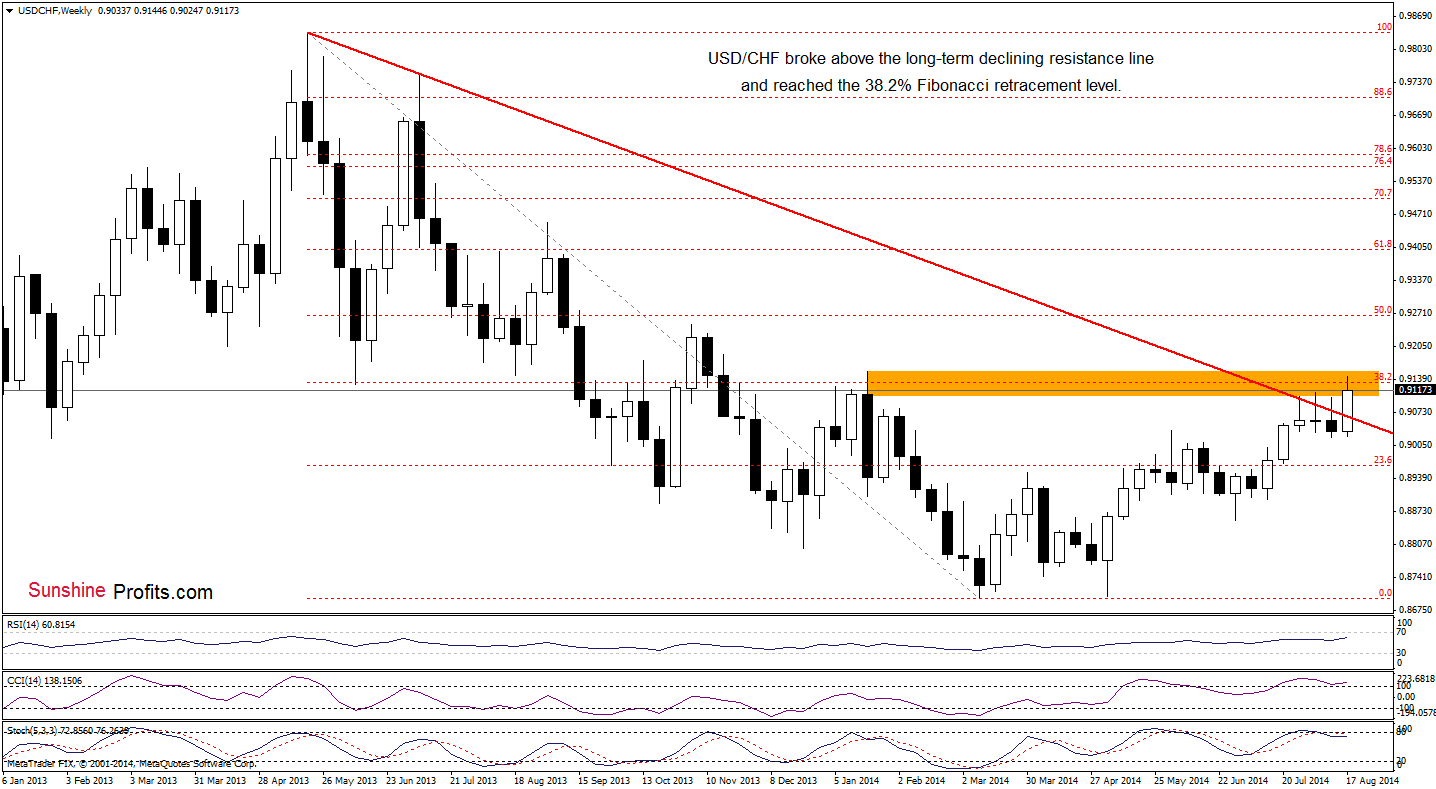
The medium term picture hasn’t changed since yesterday, therefore, our last commentary is up-to-date:
(…) USD/CHF broke above the long-term declining resistance line and reached the 38.2% Fibonacci retracement based on the entire May 2013-March 2014 decline. Despite this move, the exchange rate gave up some gains and is trading slightly below the orange resistance zone. If it holds, we may see a pullback from here and a comeback to the long-term red line. Nevertheless, if currency bulls do not give up and USD/CHF moves higher, the next upside target will be the 2014 high of 0.9155 or even the 50% Fibonacci retracement.
Having say that, let’s focus on the very short-term changes.
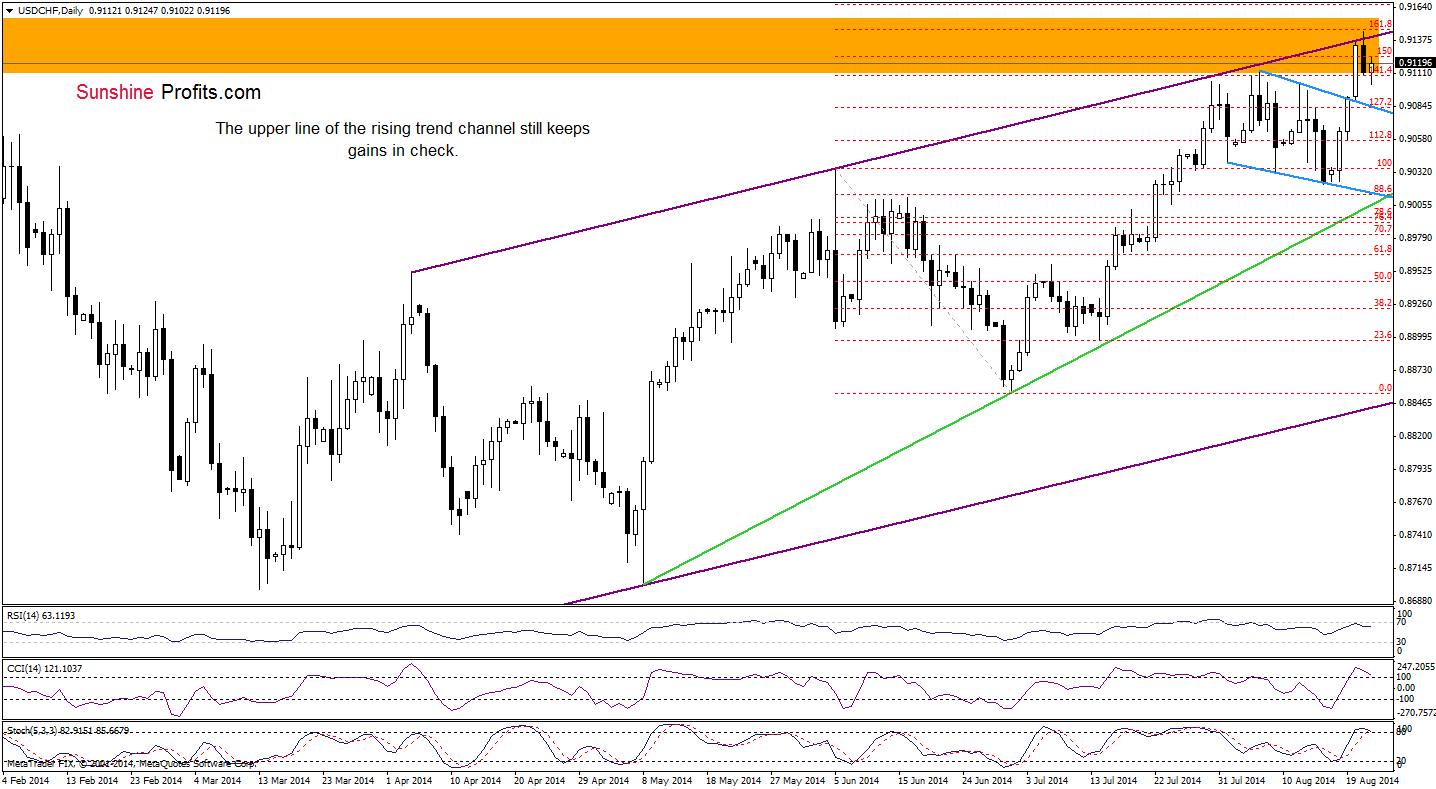
From this perspective, we see that although USD/CF rebounded slightly earlier today, the pair is still trading below the upper line of the purple trend channel. Taking this fact into account, we believe that hat we wrote yesterday is still valid:
(…) the combination of the 161.8% Fibonacci extension and the upper border of the purple rising trend channel encouraged currency bears to act. As a result, the exchange rate reversed and pulled back to the support level based on the recent highs. If it withstands the selling pressure, the pair will likely test the strength of the key resistance line. However, if it is broken, we’ll see further deterioration and a drop to (at least) the previously-broken upper blue line or even to the Aug 15 low of 0.9022. Please note that the current position of the indicators suggests that the bearish scenario is more likely in the coming days – especially if they generate sell signals.
Very short-term outlook: mixed with bearish bias
Short-term outlook: mixed
MT outlook: mixed with bullish bias
LT outlook: bearish
Trading position (short-term): In our opinion no positions are justified from the risk/reward perspective. We will keep you informed should anything change, or should we see a confirmation/invalidation of the above.
AUD/USD
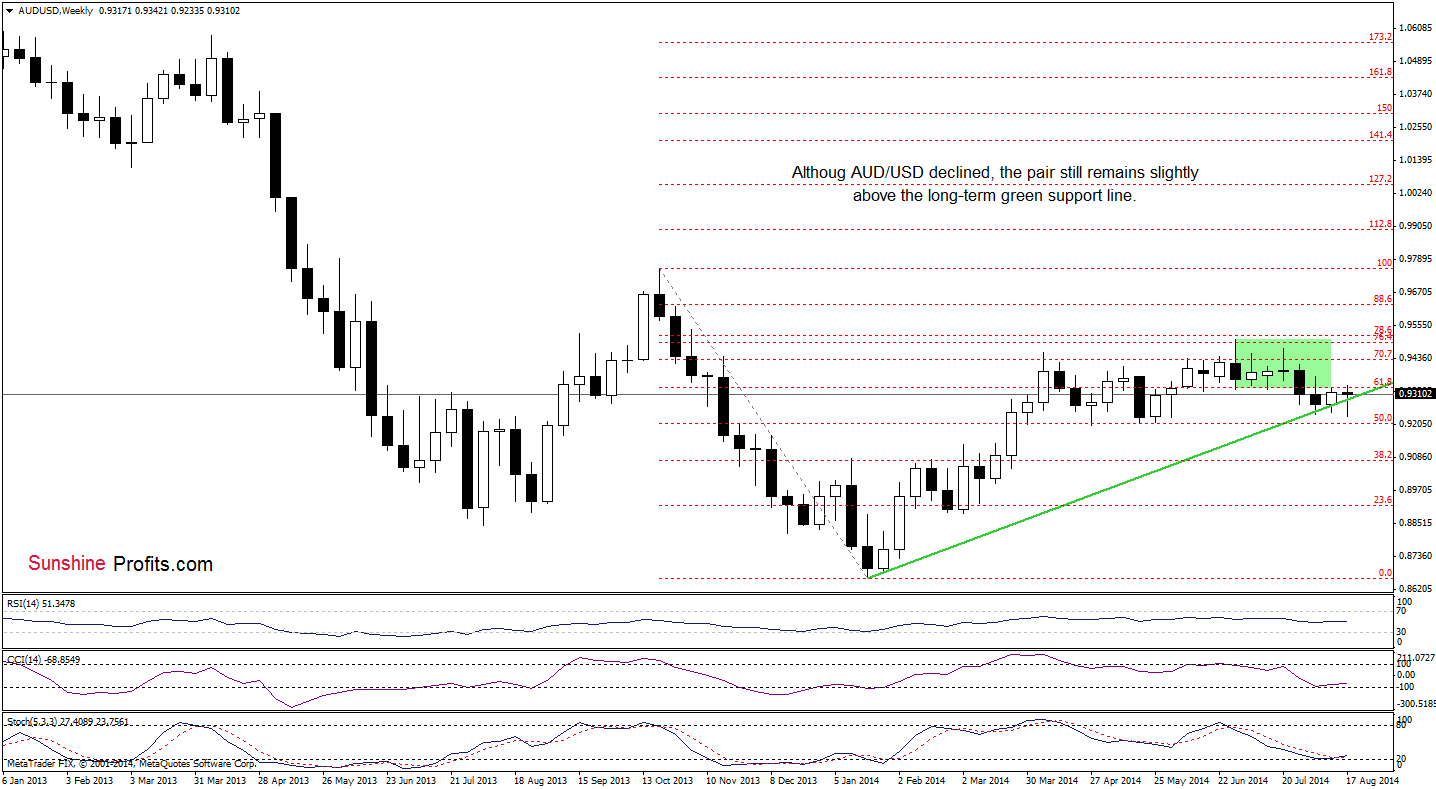
The medium-term picture hasn’t changed much as AUD/USD still remains between the long-term green line and the previously-broken lower border of the consolidation.
Can we infer something more from the daily chart?
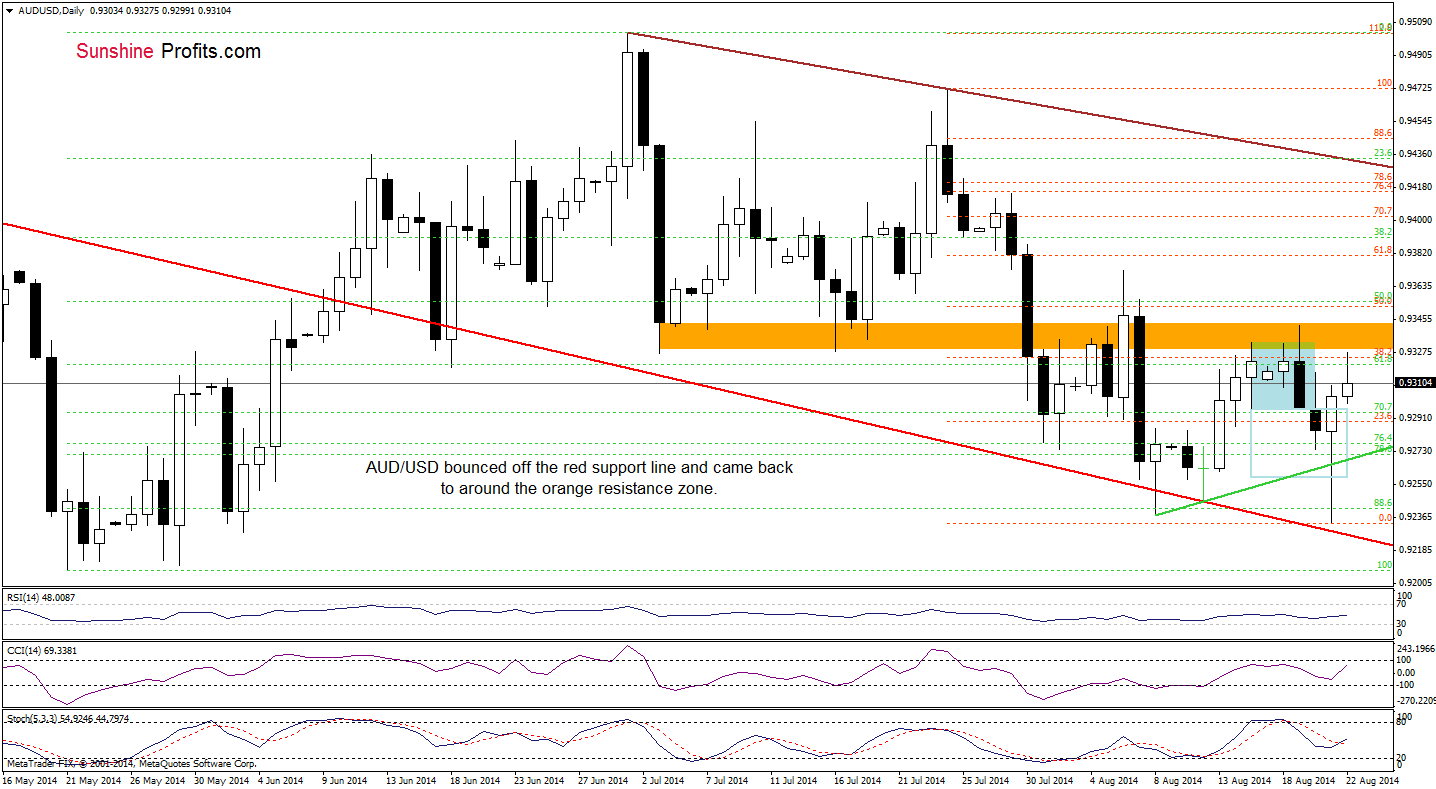
From this perspective, we see that although AUD/USD extended losses and it a fresh Aug low, the long-term declining red line successfully stopped further deterioration (similarly to what we saw earlier this month). As a result, the exchange rate rebounded sharply and came back to slightly below the orange resistance zone, which encouraged currency bears to push the sell button at the beginning of the week. What’s next? If this area holds, we’ll see another downswing and a test of the strength of the green support line (or even the recent low). Nevertheless, taking into account the current position of the indicators, it seems that currency bulls will try to push the pair higher. If they do not fail and broke above the nearest resistance, the next upside target will be around 0.9353, there the 50% Fibonacci retracement (based on the entire July-Aug decline) is.
Very short-term outlook: mixed with bullish bias
Short-term outlook: mixed
MT outlook: mixed
LT outlook: bearish
Trading position (short-term): In our opinion, no positions are justified from the risk/reward perspective. We will keep you informed should anything change, or should we see a confirmation/invalidation of the above.
Thank you.
Nadia Simmons
Forex & Oil Trading Strategist
Przemyslaw Radomski, CFA
Founder, Editor-in-chief
Gold & Silver Trading Alerts
Forex Trading Alerts
Oil Investment Updates
Oil Trading Alerts

