

Euro bears look to be wavering at first sight. And first impressions can be deceptive and costly. Both in trading and in life in general. It’s paramount not to lose the view of the forest for the individual trees. It’s not patience alone that pays off, it’s patience combined with sound analytical insights. Today, we also have a new promising candidate to go long to share with you. Let’s jump right in.
- EUR/USD: half of earlier existing short positions (a stop-loss order at 1.1330; the next downside target at 1.1180)
- GBP/USD: none
- USD/JPY: short (a stop-loss order at 112.32; the initial downside target at 109.82)
- USD/CAD:long (a stop-loss order at 1.3247; the initial upside target at 1.3530)
- USD/CHF: none
- AUD/USD: none
EUR/USD
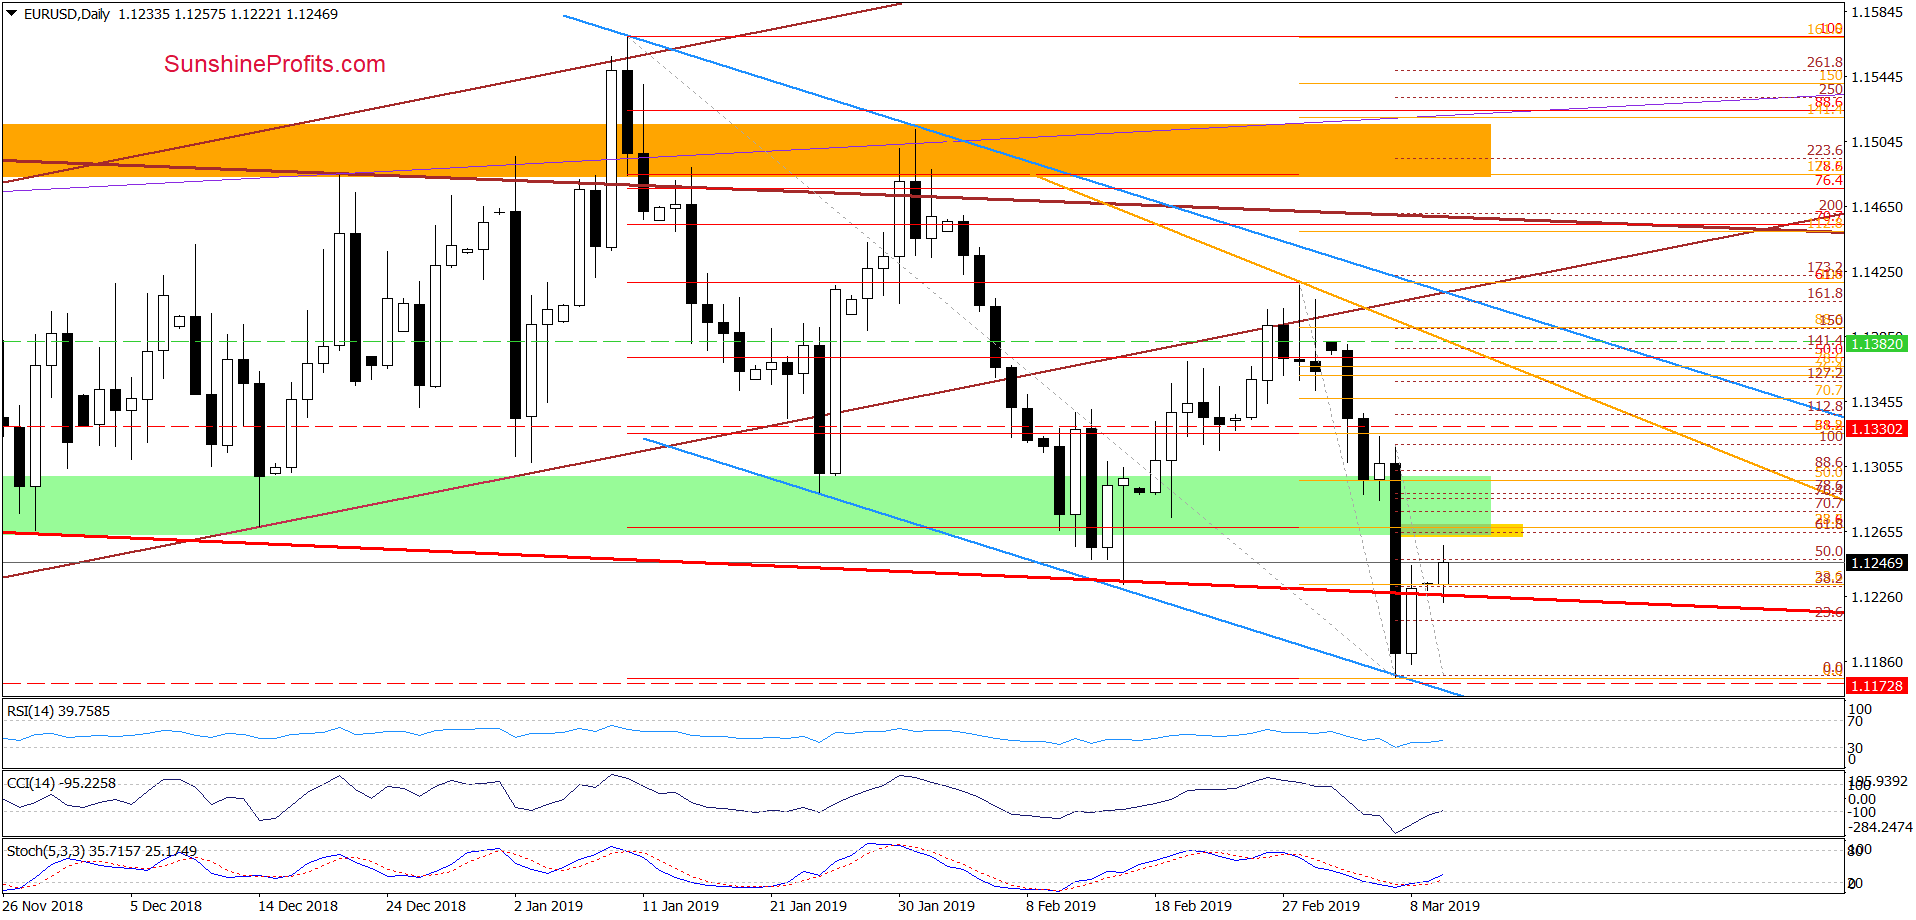
On Friday, EUR/USD recovered from its Thursday’s dive. The result was a close above the lower border of the red declining trend channel. This triggered further improvement earlier today, however the exchange rate is still trading below the very short-term yellow resistance zone created by three Fibonacci retracements: the 61.8% based on the Thursday’s sharp decline, the 38.2% based on the late-February-early March downward move and the 23.6% based on the entire October-March move.
Such a strong combination of retracements increases the probability that one more move to the downside is still ahead of us – especially when we factor in the size of Thursday’s candlestick. If that’s indeed the case, we’ll likely see at least a test of the last week’s lows or even the lower border of the blue declining trend channel in the following days.
Let’s not forget that the yellow resistance zone has another neighbor, the previously broken green support zone with its own set of Fibonacci retracements inside. It’s yet another argument for why any bullish price action is likely to run into headwinds sooner rather than later. Probably that’s the case indeed, as the pair is trading at around 1.1225 currently.
Trading position (short-term; our opinion): profitable half of earlier existing short positions with a stop-loss order at 1.1330 and the next downside target at 1.1180 are justified from the risk/reward perspective.
USD/CHF
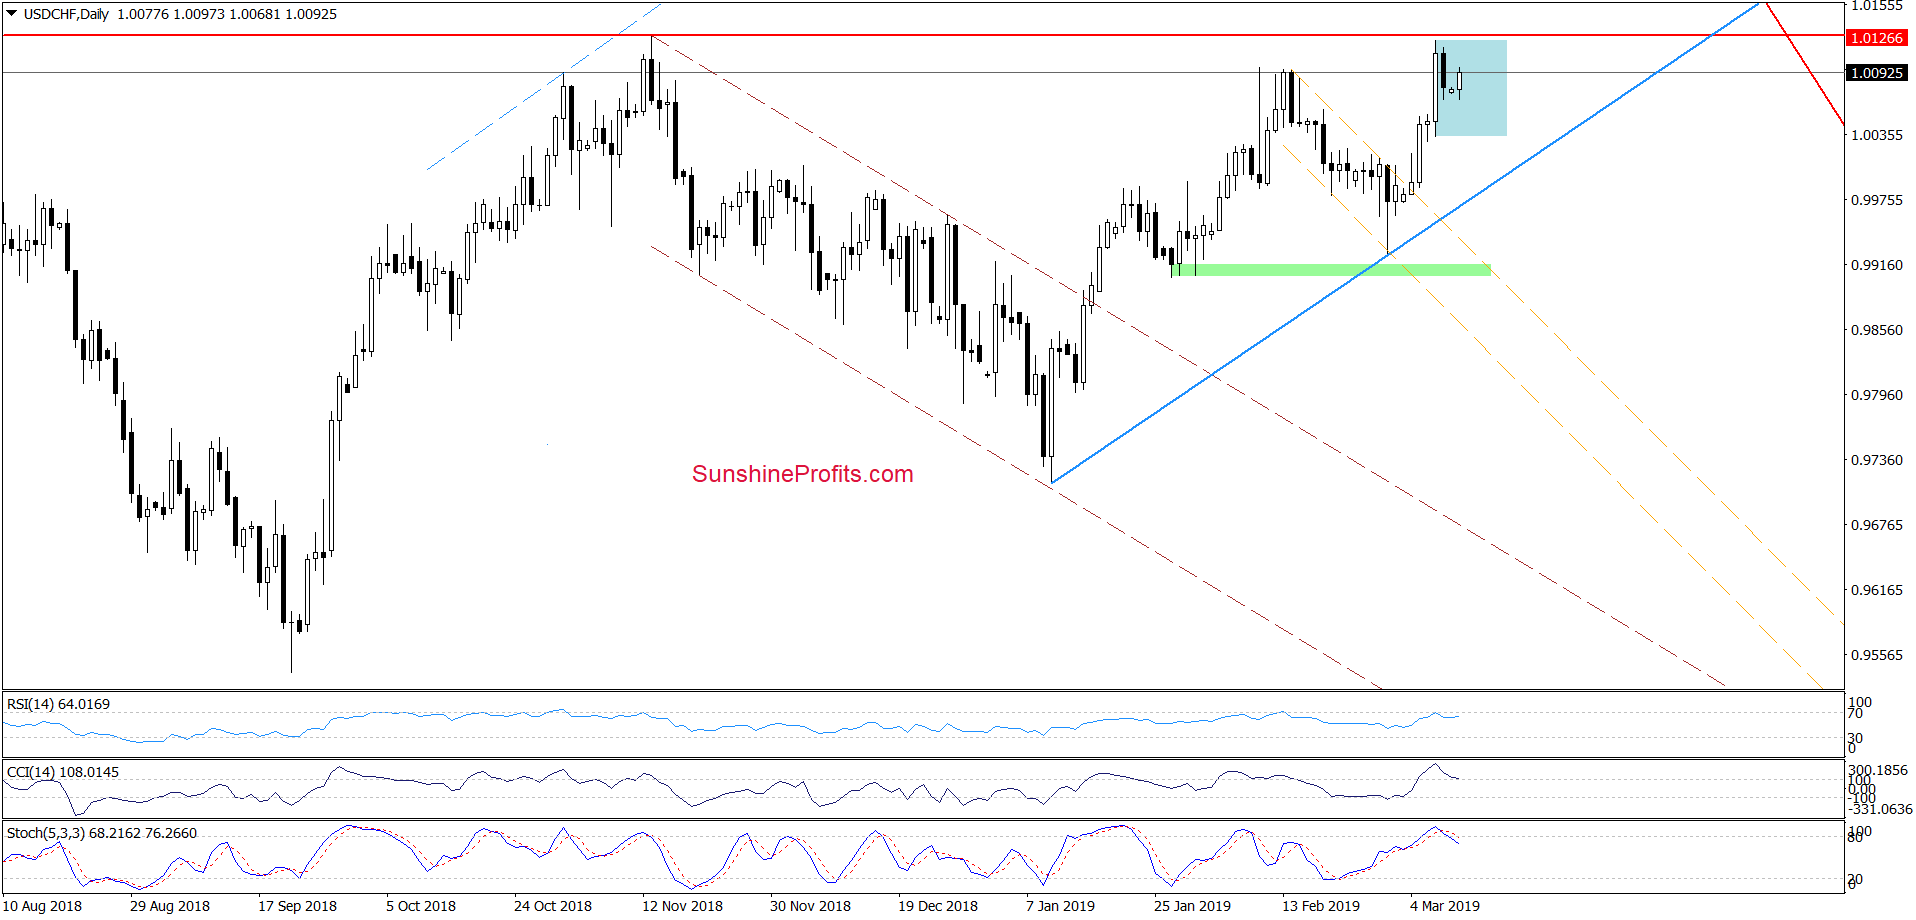
USD/CHF moved sharply higher on Thursday, which resulted in a breakout above the February peaks. However, the pair is still trading below the red horizontal line based on the mid-November peak, which is likely to keep further gains in check.
Additionally, the daily indicators generated their own sell signals, which suggest that even if the pair moves a bit higher, a bigger move to the downside nonetheless remains just around the corner. Especially so when we factor in the long-term picture of USD/CHF.
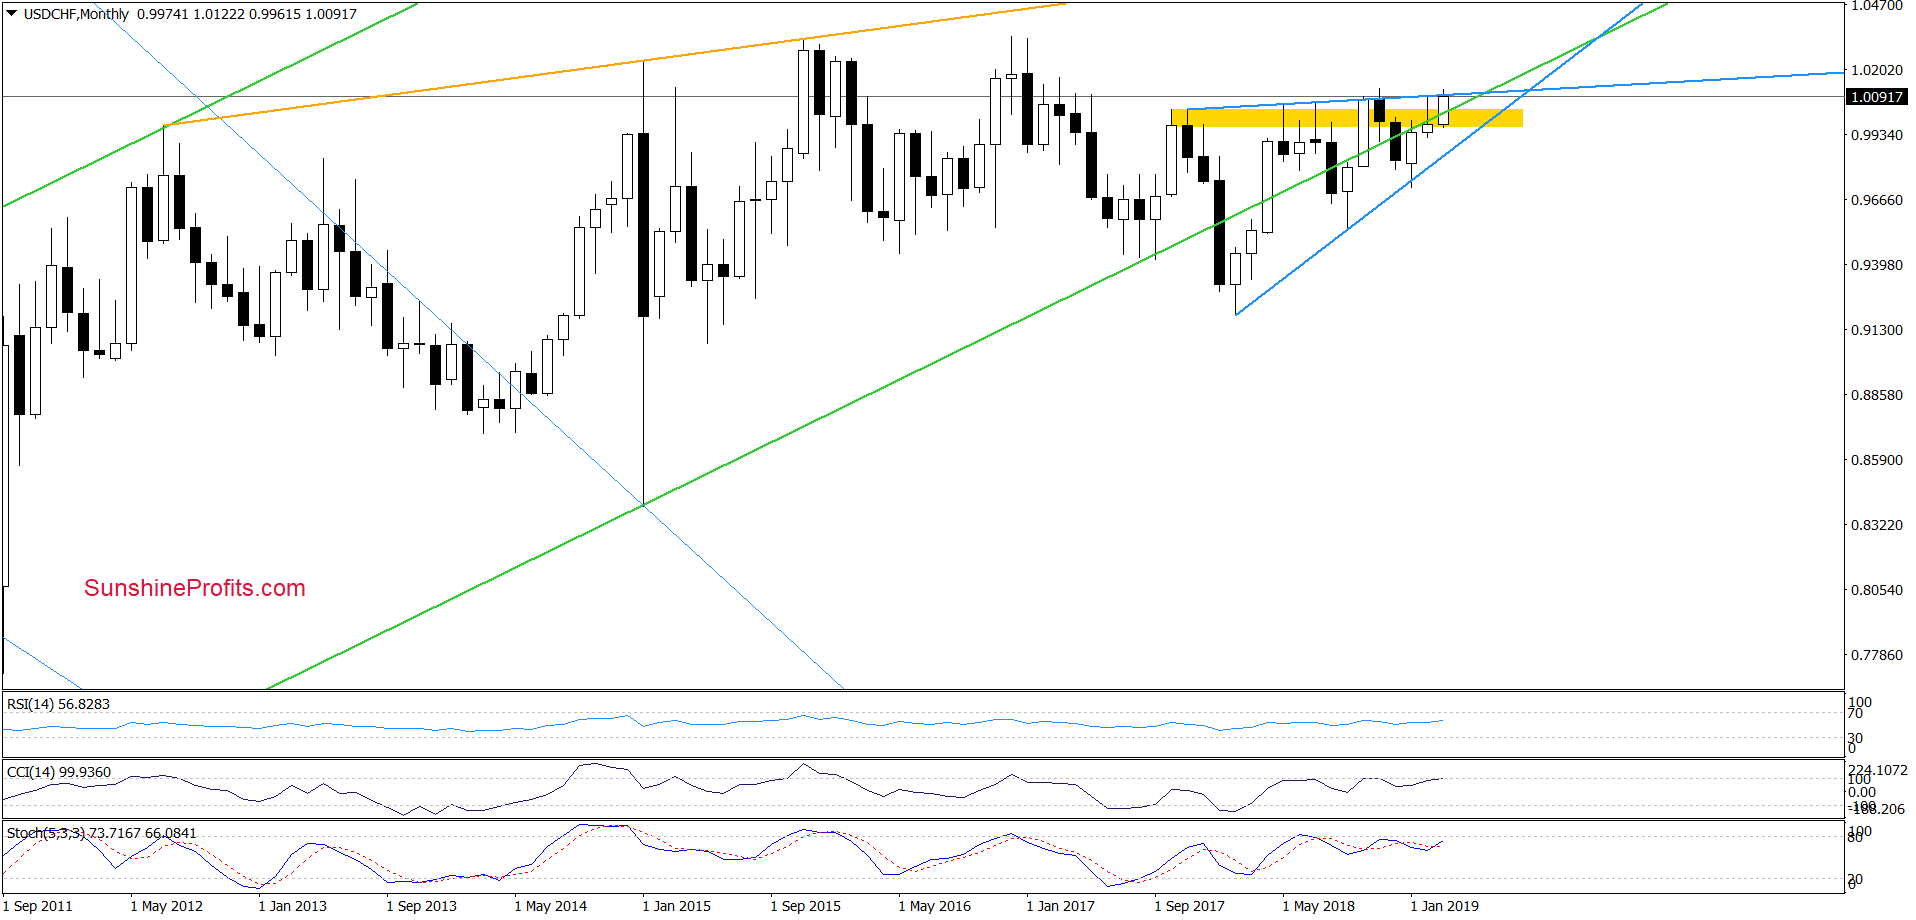
The monthly perspective shows that since late 2017, the pair still remains constrained by the blue rising wedge. It means that as long as there is no successful breakout above the upper line of the formation (or a breakdown below the lower line), another sizable move has a questionable shelf life and short-lived moves in both directions should not surprise us.
Trading position (short-term; our opinion): No positions are justified from the risk/reward perspective. We will keep you informed should anything change, or should we see a confirmation/invalidation of the above.
AUD/USD
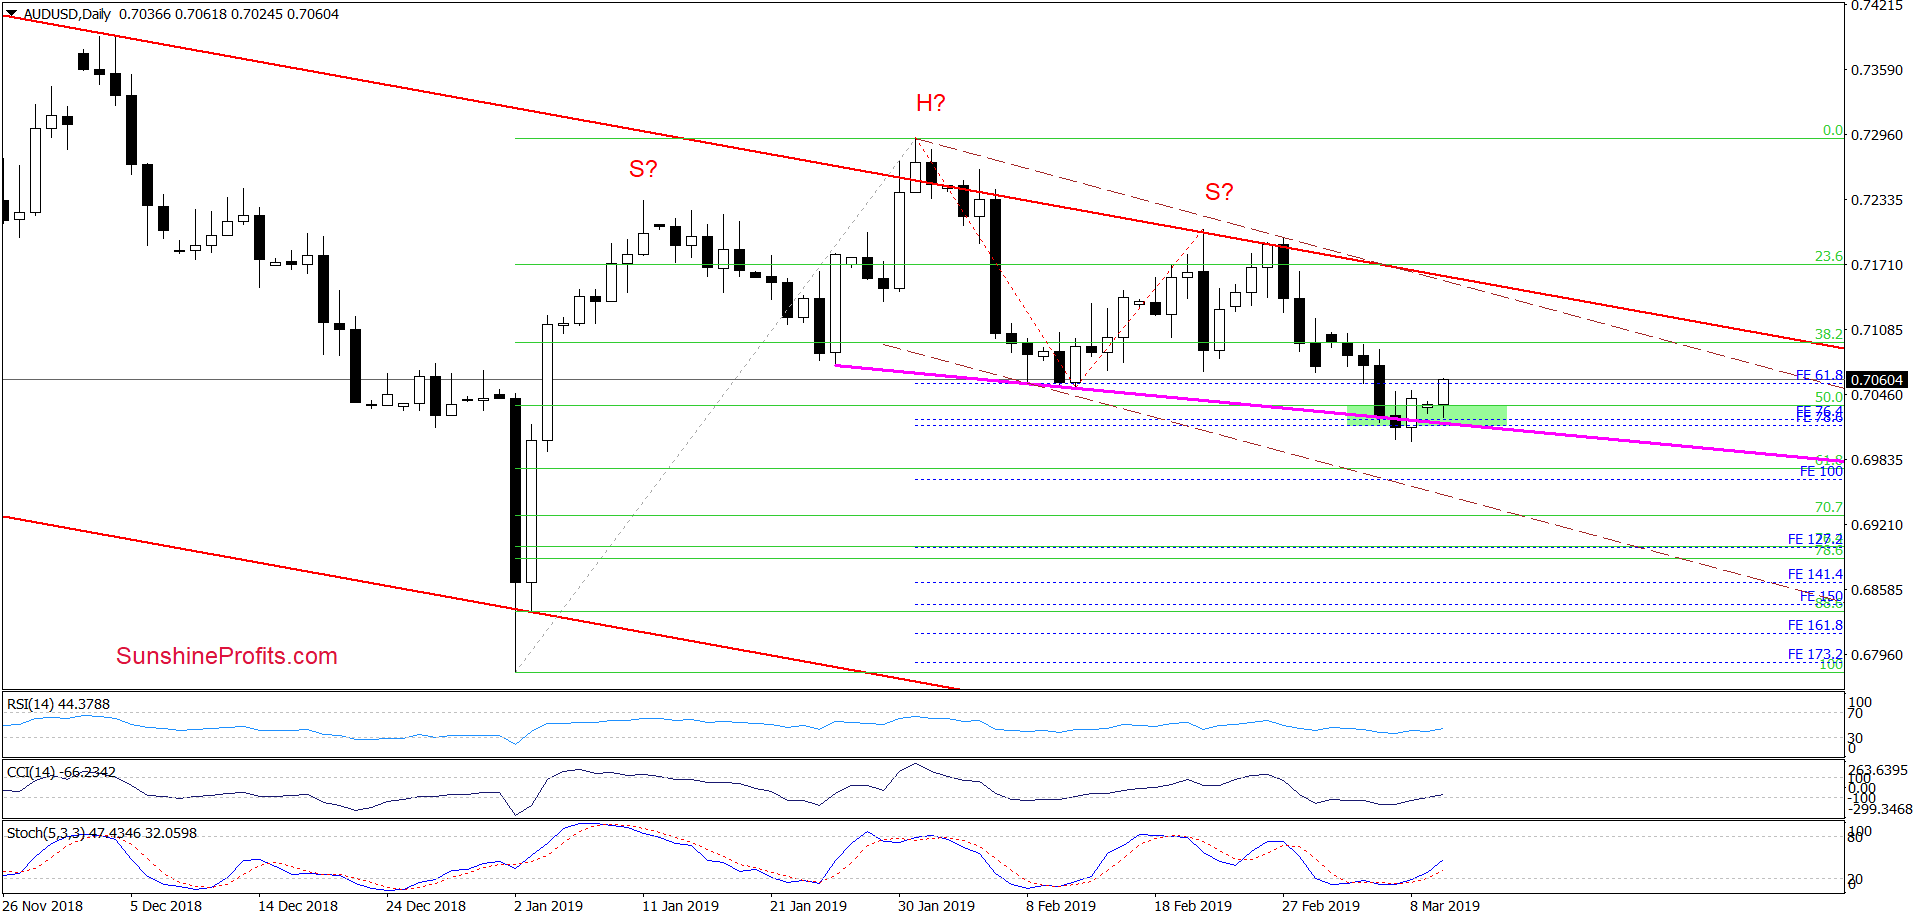
The daily chart shows that the green support zone reinforced by the declining pink support line (a neck line of a potential head and shoulders formation) encouraged the buyers to take the pair higher. How good that half of our recent profitable short position has been closed automatically on March 6th by the take-profit order (the previous half had been also profitably closed on February 7th).
The CCI and the Stochastic Oscillator generated their buy signals which lends support to higher values of AUD/USD in the coming days. How high could the pair go?
We can see a test of the upper border of brown dashed declining trend channel. Its upper border is based on the late-January and late-February peaks. Even a test of the previously broken upper border of the red declining trend channel is not out of the question.
The pro-growth scenario is also supported by the medium-term picture. As we discussed on Thursday, the green support zone:
(…) continues to keep declines in check since the beginning of October 2018. There was a short-lived breakdown attempt at the end of the previous year but the bulls swiftly took AUD/USD back above the green zone, which increases its importance as a support. Additionally, the current decline could be forming the right arm of another potential reverse head and shoulders formation.
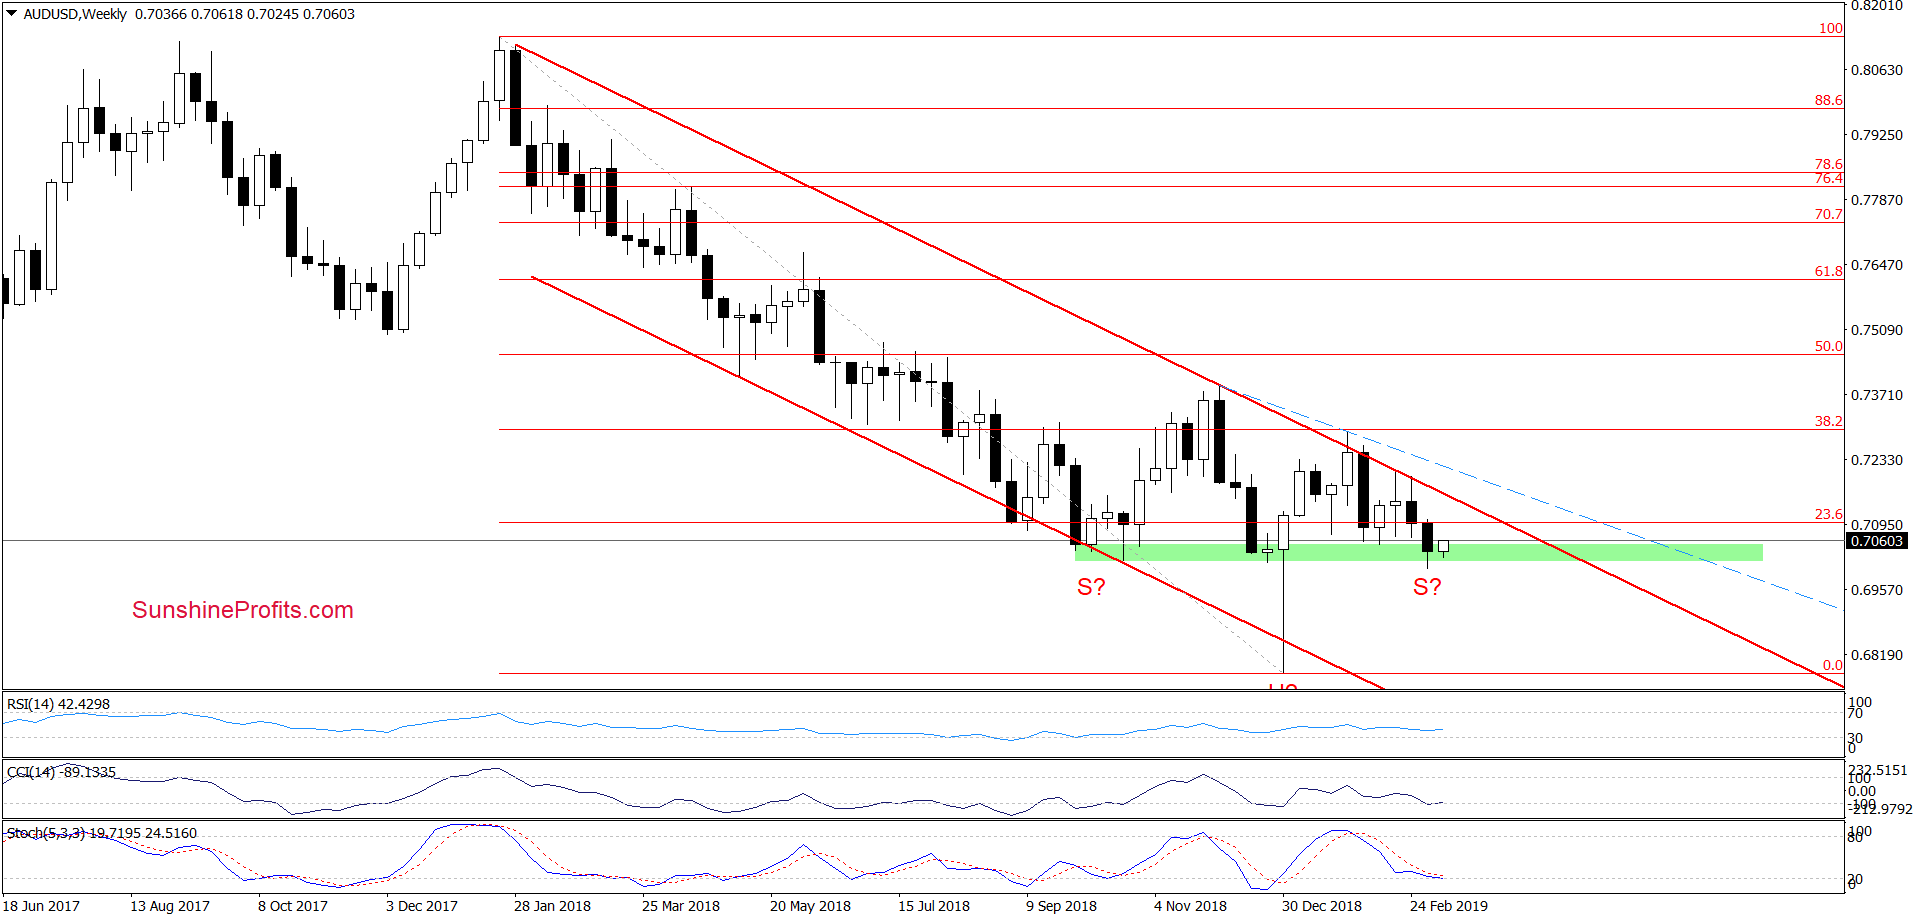
This observation remains up-to-date also today.
Connecting the dots, should we see another daily close above the green zone on the daily chart, we’ll consider opening long positions. We will keep you informed should anything change, or should we see a confirmation/invalidation of the above.
Trading position (short-term; our opinion): No short positions are justified from the risk/reward perspective, but opening long positions seems just a matter of time.
Thank you.
Nadia Simmons
Forex & Oil Trading Strategist

