

Oil Trading Alert originally sent to subscribers on May 26, 2015, 7:50 AM.
Trading position (short-term; our opinion): Short positions with a stop-loss order at $65.23 are justified from the risk/reward perspective.
The Stochastic indicator is quite a popular tool for commodity traders (including those interested in trading crude oil and precious metals) and it is not without a reason. This indicator has proven itself many times as something that can really indicate the next move in the market – however, it has to be applied carefully, as not all ways in which it works are really profitable. We have just seen 2 signals from this important indicator – one bullish (based on daily closing prices) and one bearish (based on weekly closing prices). Which should one focus on?
Generally, the more long-term the nature of a given signal or trend line is, the more important it is. This is particularly true for the Stochastic indicator. It is not only the case with gold and mining stocks that the Stochastic indicator based on weekly prices is much more reliable than the one based on daily prices (by the way, we have just published general gold trading tips in the Research section on our website, which you might find useful) – it is the case also with the crude oil market.
Let’s see how well the Stochastic indicator calculated using daily closing prices performed (charts courtesy of http://stockcharts.com).
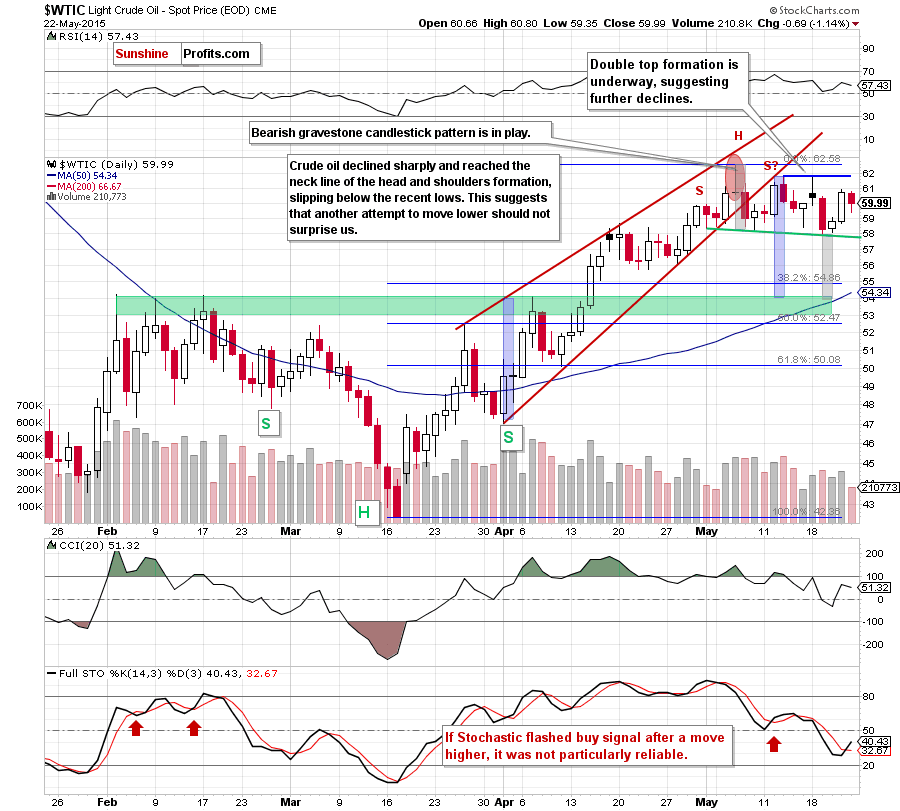
There were times then the buy signals (moments when the indicator – black line - moves above its average – red line) were real buying opportunities, but there were also a few cases when only very small rallies followed and then we saw declines. Overall, the performance of the Stochastic indicator in this perspective was nothing to call home about.
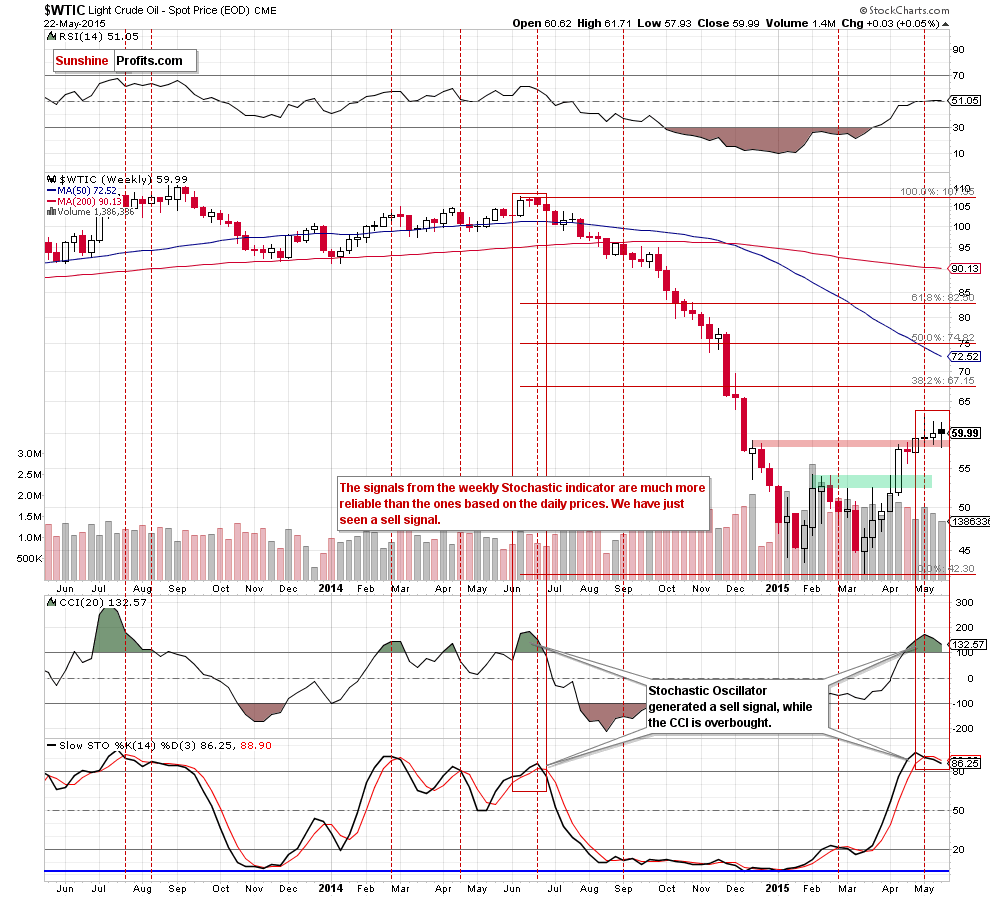
Now, if we consider weekly prices, we get a very different picture. The efficiency of the indicator’s sell signals (something that we just saw) is quite high. By a sell signal we mean a situation when the indicator breaks below its average while being above the 80 level (overbought).
What’s even more interesting is that the last time that we saw this kind of sell signal was when crude oil was trading above $100. Since we saw this kind of signal once again recently, it serves as a subtle clue that perhaps crude oil has corrected enough and is now ready to fall much further (or to the previous lows).
With a more reliable and evident signal from the weekly version of the Stochastic indicator, the overall implications of its analysis are bearish.
How much does it change in the short-term outlook?
Not much as the outlook was and still is bearish. Crude oil seems to have verified the move to the previously broken rising support/resistance line and is now about to slide further. As long as there is no breakout above this area, higher values of the commodity are not likely to be seen and further deterioration is more likely than not.
Summing up, the outlook for the crude oil market remains bearish.
Very short-term outlook: bearish
Short-term outlook: bearish
MT outlook: mixed with bearish bias
LT outlook: mixed with bearish bias
Trading position (short-term; our opinion): Short positions with a stop-loss order at $65.23 are justified from the risk/reward perspective. We will keep you – our subscribers – informed should anything change.
Thank you.
Nadia Simmons
Forex & Oil Trading Strategist
Przemyslaw Radomski, CFA
Founder, Editor-in-chief
Gold & Silver Trading Alerts
Forex Trading Alerts
Oil Investment Updates
Oil Trading Alerts
