
Based on the December 4th, 2013 Premium Update. Visit our archives for more gold articles.
In our last essay we examined the situation in the US Dollar Index (from many perspectives) and the Euro Index, as many times in the past it gave us important clues about future precious metals’ moves. Back then we wrote that the implications for the precious metal market were bearish just as the outlook for the Euro Index and just as it was bullish for the USD Index.
On the next trading day, after the essay was posted, gold, silver and mining stocks declined along with the European currency and hit their fresh monthly lows. Does it mean that the final bottom for the decline in gold, silver and mining stocks is already in?
Many times in our previous essays we wrote that if you want to be an effective and profitable investor, you should look at the situation from different perspectives and make sure that the actions that you are about to take are really justified. That's why in today's essay we’ll examine gold and silver mining stocks to find out what kind of impact they can have on precious metals’ future moves.
Additionally, it’s been almost a month since we wrote in greater detail about the precious metals mining stock sector, so we thought that you might appreciate an update. As a reminder, on Nov. 8 we wrote that the outlook remained bearish and even though we couldn’t rule out a few days of strength, it didn’t seem that a rally would be a sustainable development.
Let's start with two of the most followed commodity stock indices - the Philadelphia Gold/Silver XAU Index and the AMEX Gold Bugs HUI Index (charts courtesy of http://stockcharts.com).
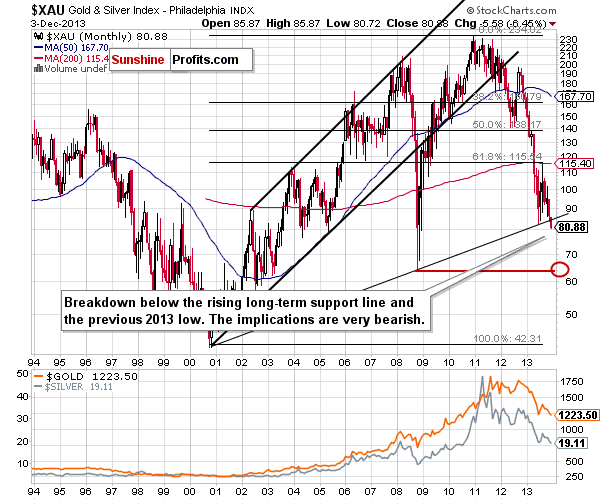
This week we saw a major breakdown below two critical support levels: the long-term rising support line and the 2013 low. Taking this fact into account, we can conclude that the implications are clearly bearish for the coming weeks.
Now, let's have a look at the HUI Index. The chart below expresses a simplicity that betrays potential information on where this market may ultimately be heading.
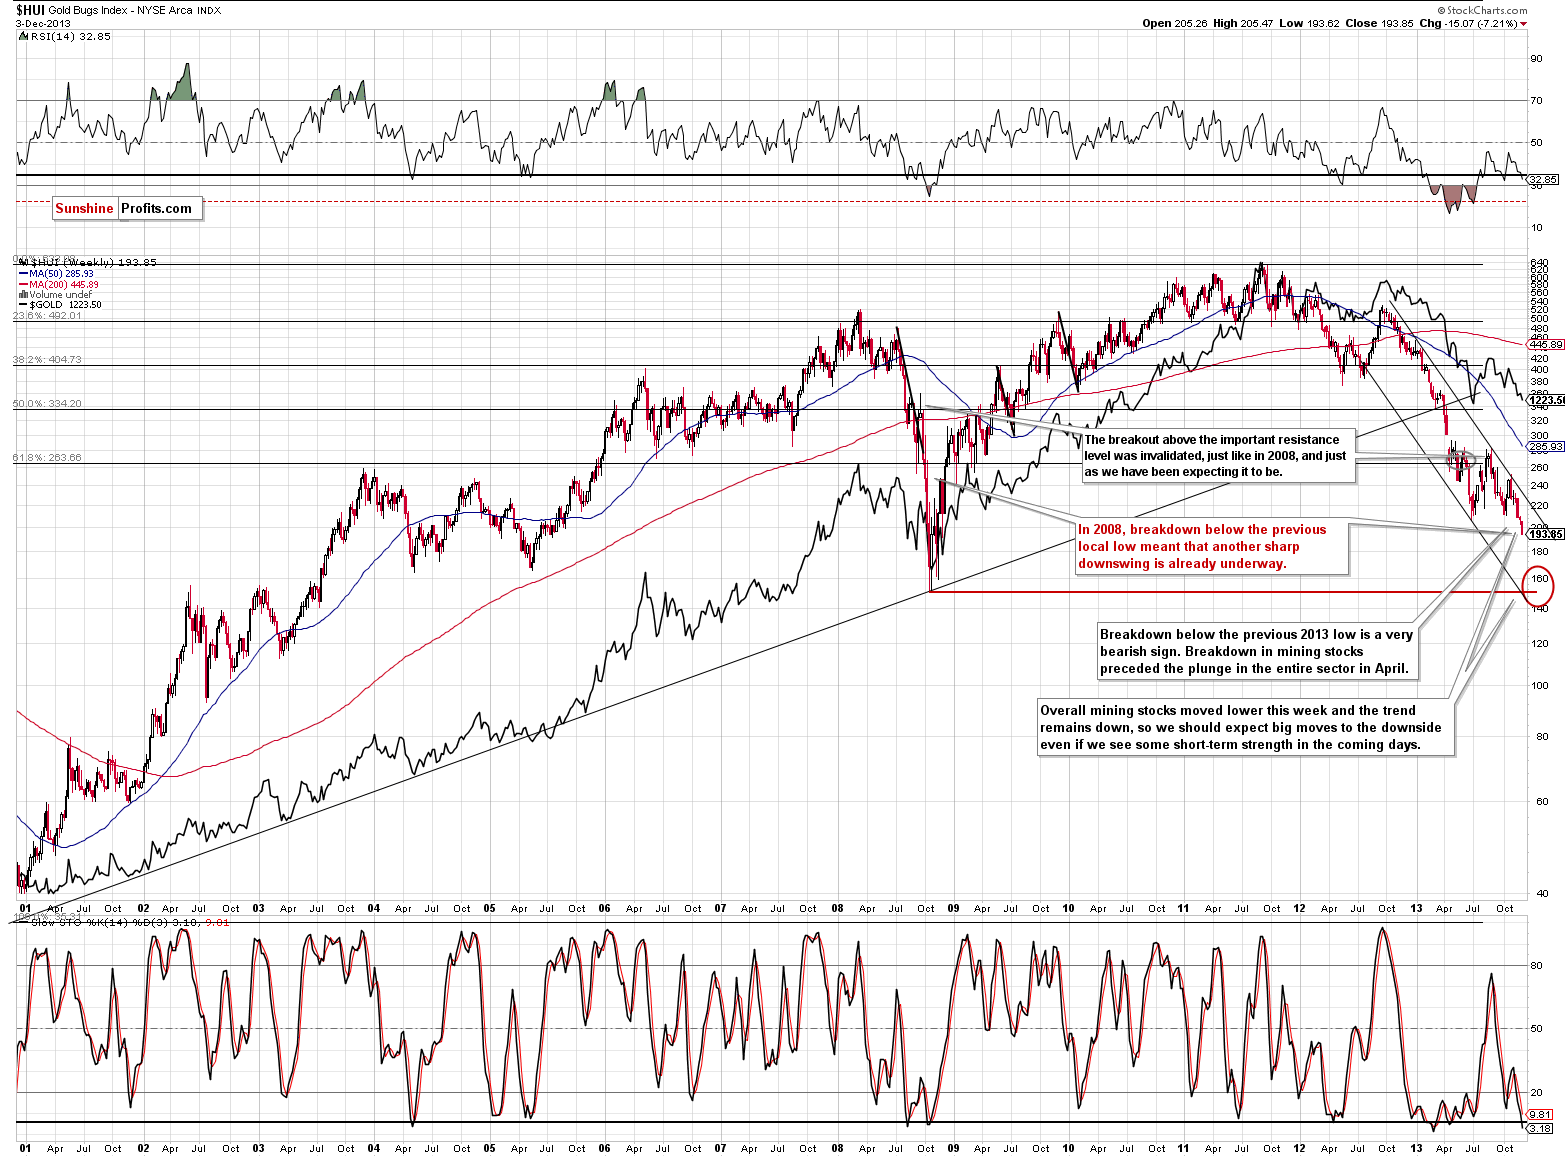
In our previous Premium Update, we wrote that the HUI Index extended declines and dropped below the previous 2013 low, which was a very bearish sign. Back then we also mentioned that a similar breakdown in mining stocks preceded the plunge in the entire precious metals sector in April and taking this fact into account we could expect big moves to the downside in the days or weeks ahead.
Looking at the above chart, we see that we have indeed seen a big move to the downside, even though it’s been only a few days since the above was posted. This is another bearish confirmation, as back in 2008 the breakdown below the previous local low meant that the final sharp downswing was already underway. We expect the final bottom to be seen close to the 150 level.
What about the short term?
Let’s start by quoting what we wrote in Friday’s Premium Update:
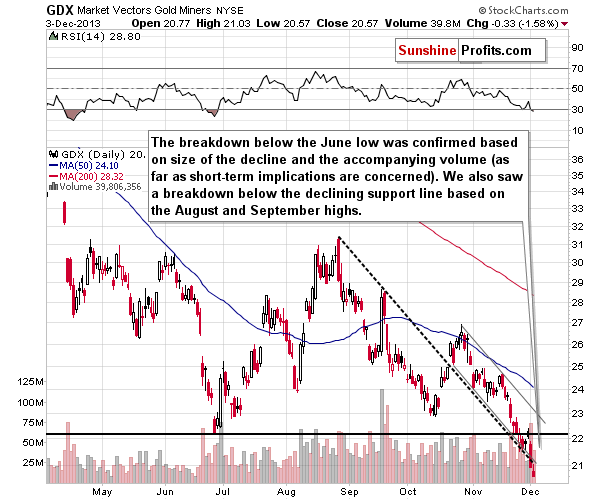
From the short-term point of view, we see that the situation has deteriorated recently. At the beginning of the week mining stocks declined below the previous 2013 low and stayed there for three consecutive trading days. This means that the breakdown is confirmed at the moment and the implications are bearish.
As you can see on the above chart, miners reached the medium-term declining support line created by the August and September high – similarly to what we saw at the beginning of the month. Back then, this line triggered a consolidation (just like now); however, as it turned out it was just a pause within a short-term decline.
Taking this fact into account and combining it with the confirmed breakdown below the previous 2013 low, the current decline could become a major, medium-term decline.
It seems that we indeed see mining stocks in a major medium-term term decline as they dropped significantly this week.
There was even another breakdown - below the declining support line based on the August and September highs. The implications of the above chart remain bearish.
Finally, we would like to discuss the current situation in the gold-stocks-to-gold ratio.
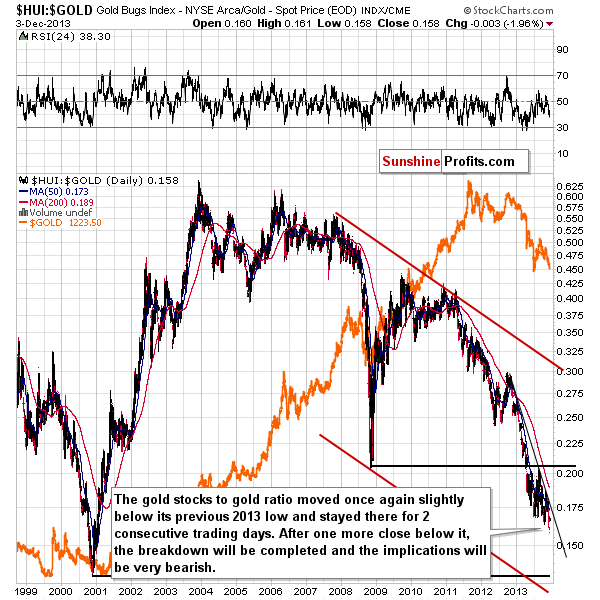
On the above chart, we clearly see that the situation has again deteriorated in recent days. On Monday, the HUI-to-gold ratio dropped slightly below its previous 2013 low and we saw it close there on Tuesday as well. The breakdown is not confirmed at the moment but just one more daily close below the previous 2013 low will make the situation much more bearish.
Summing up, the medium-term trend remains down, the decline is quite likely to accelerate shortly and the outlook for the mining stocks sector is very bearish. It seems that practically all markets – gold, silver, main stock indices – are going down right now (except for crude oil, where we just saw a major breakout on huge volume) and mining stocks are declining along with them. Actually, they are leading the way.
If you'd like to read the full version of today's analysis along with our current trading suggestions, please subscribe to the Premium Service.
Thank you.
Przemyslaw Radomski, CFA
Back