

Forex Trading Alert originally sent to subscribers on April 23, 2015, 5:44 AM.
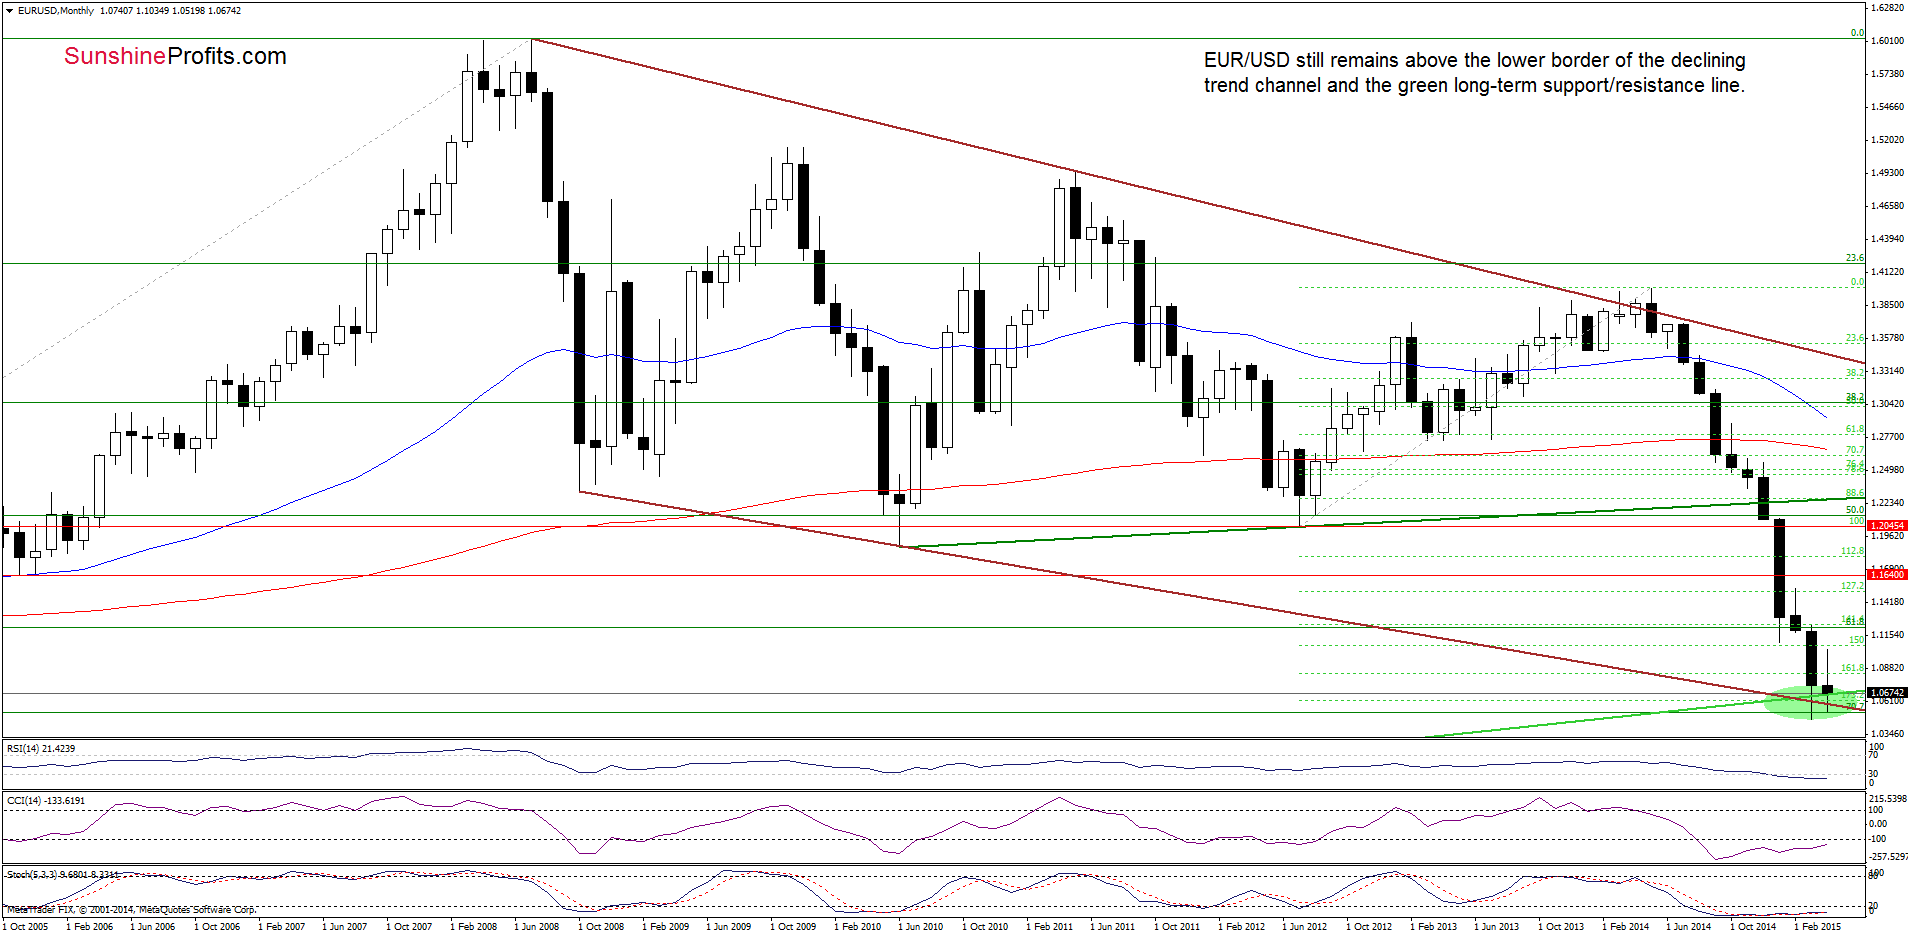
Earlier today, official data showed that the Gfk German consumer climate index increased to 10.1 in April, missing analysts’ expectations. As a result, EUR/USD declined below 1.0700 and approached the long-term support line once again. Will it encourage currency bulls to act in the coming days?
In our opinion the following forex trading positions are justified - summary:
- EUR/USD: none
- GBP/USD: none
- USD/JPY: none
- USD/CAD: short (stop loss order at 1.2876)
- USD/CHF: none
- AUD/USD: none
EUR/USD
Quoting our previous commentary:
(…) please keep in mind that the sell signal generated by the Stochastic Oscillator remains in place, supporting another downswing
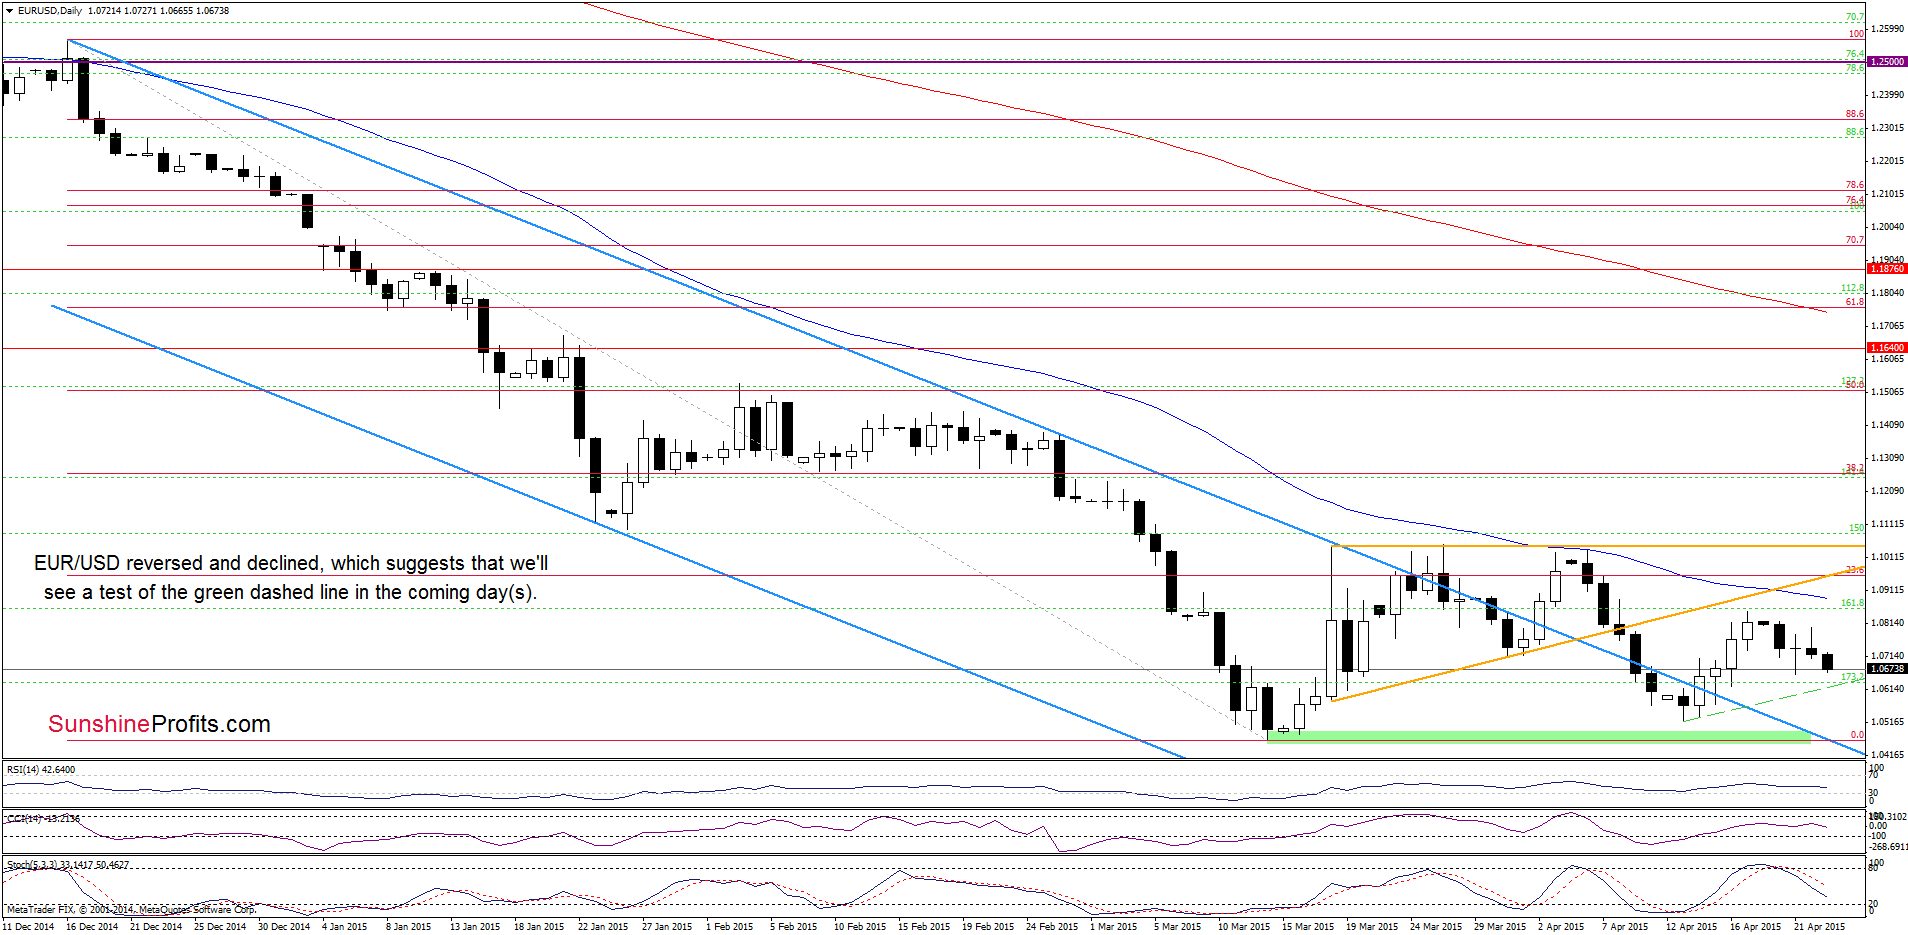
As you see on the charts, currency bears pushed the exchange rate lower as we expected. Taking into account yesterday’s reversal and sell signal generated by the Stochastic Oscillator remains, we think that the exchange rate will likely test the strength of the long-term green line and the green dashed line (marked on the daily chart) in the coming day(s). Nevertheless, in our opinion, as long as there is no breakdown below these lines (or a breakout above the resistance zone created by the 50-day moving average and the orange resistance line) another sizable move is not likely to be seen.
Very short-term outlook: mixed with bearish bias
Short-term outlook: mixed
MT outlook: mixed
LT outlook: mixed
Trading position (short-term; our opinion): No positions are justified from the risk/reward perspective at the moment. We will keep you informed should anything change, or should we see a confirmation/invalidation of the above.
USD/JPY
On Monday, we wrote the following:
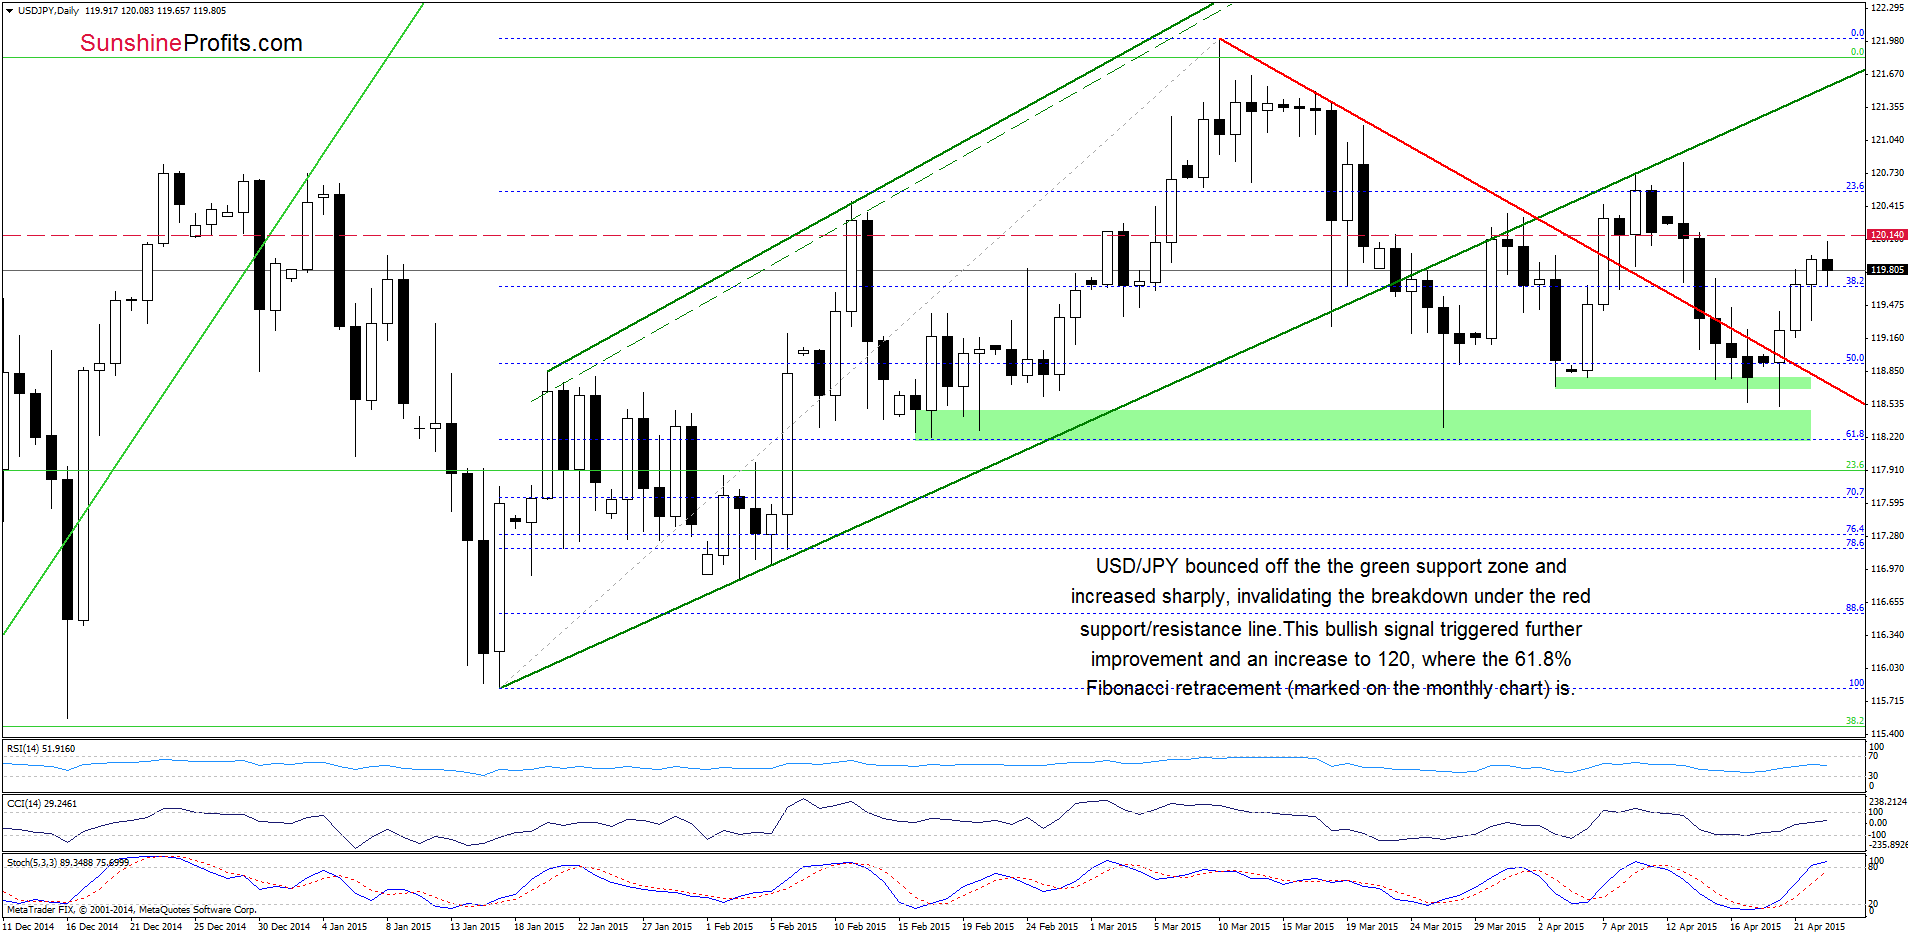
(…) the pair re-tested the green support zone, which triggered another rebound. Taking into account the current position of the inicators (the CCI and Stochstic Oscillator generated buy signals) it seems that currency bulls will try to break above the red line in the coming day(s). Nevertheless, even if we see a comeback above it, we believe that as long as there is no daily close above the red line a bigger upswing is not likely to be seen
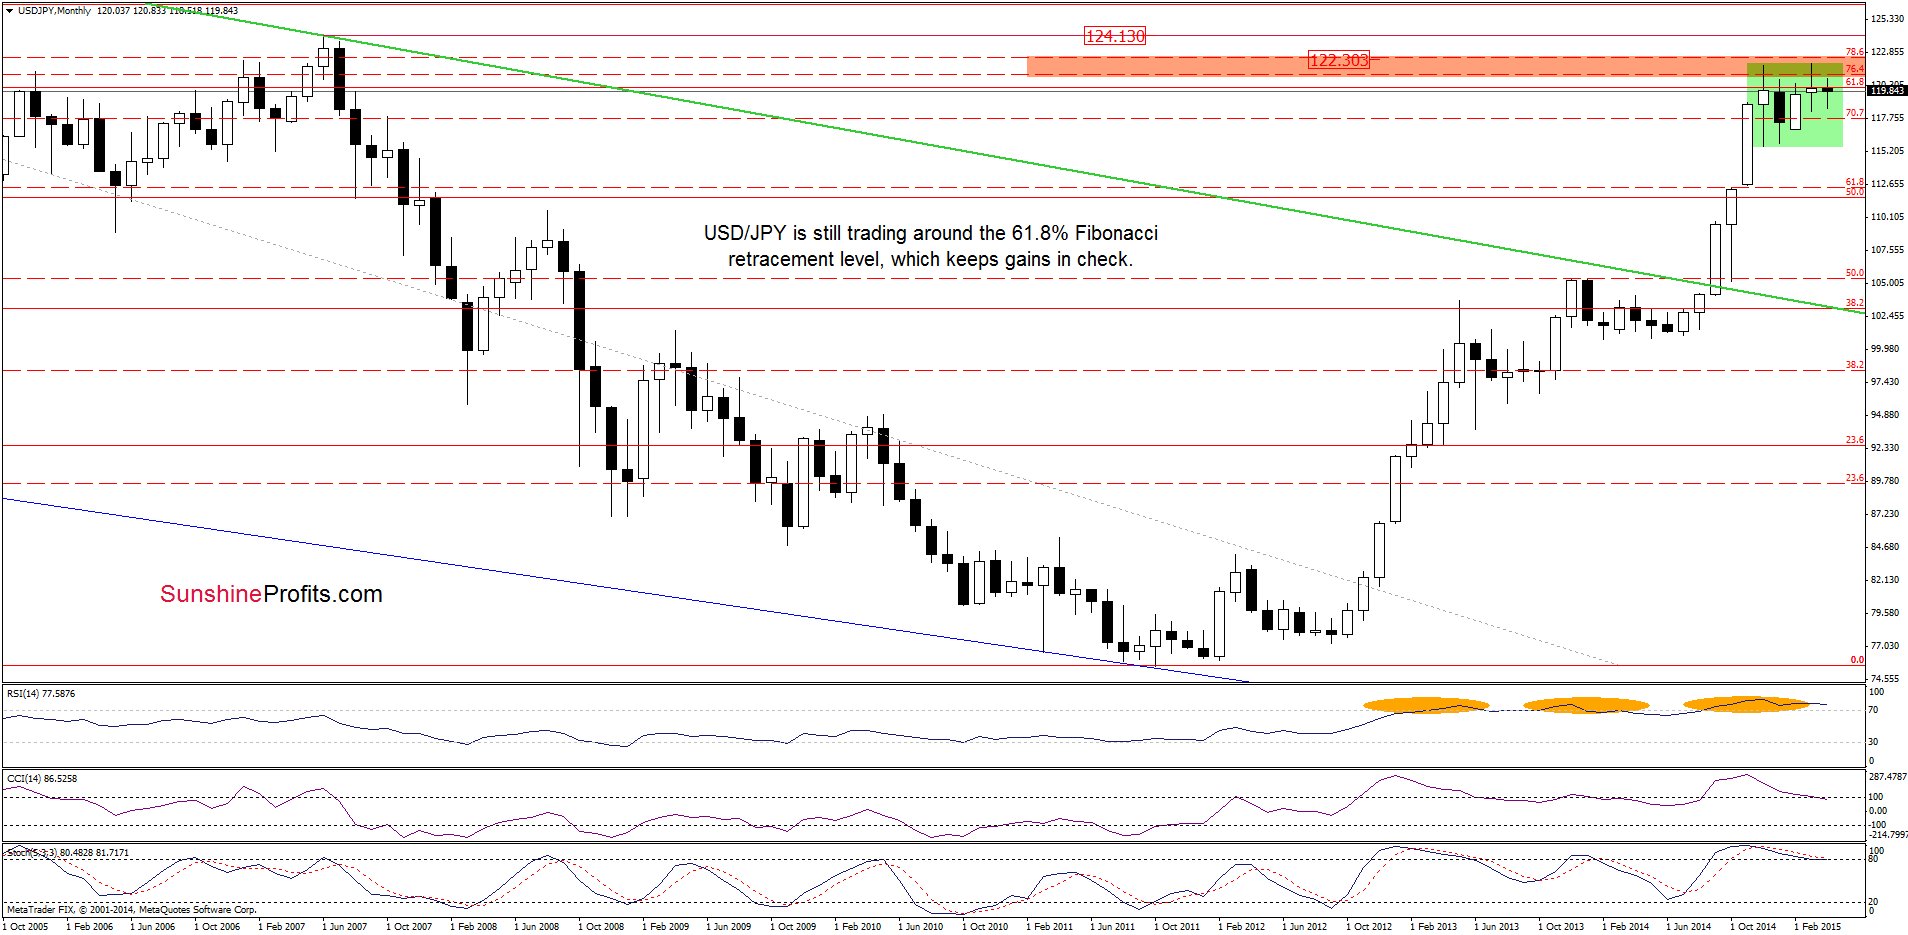
Looking at the charts, we see that the situation developed in line with the above scenario as USD/JPY bounced off the green support zone and closed Monday’s session above the red support/resistance line. An invalidation of the breakdown triggered further improvement in the following days and resulted in an increase to around 120, where the 61.8% Fibonacci retracement level (based on the entire 1998-2011 declines) is. Although the pair moved little lower earlier today, we think that as long as there are no sell signals generated by the indicators another attempt to move higher is likely. If this is the case, the initial upside target would be around 120.32-120.38, where the 76.4% and 78.6% Fibonacci retracements (based on the Apr 13-Apr 20 declines) are. If this area is broken, we might see test of the last week’s high of 120.83.
Very short-term outlook: mixed with bullish bias
Short-term outlook: mixed
MT outlook: mixed
LT outlook: bullish
Trading position (short-term; our opinion): No positions are justified from the risk/reward perspective at the moment. We will keep you informed should anything change, or should we see a confirmation/invalidation of the above.
USD/CHF
Quoting our Forex Trading Alert posted on Apr 21:
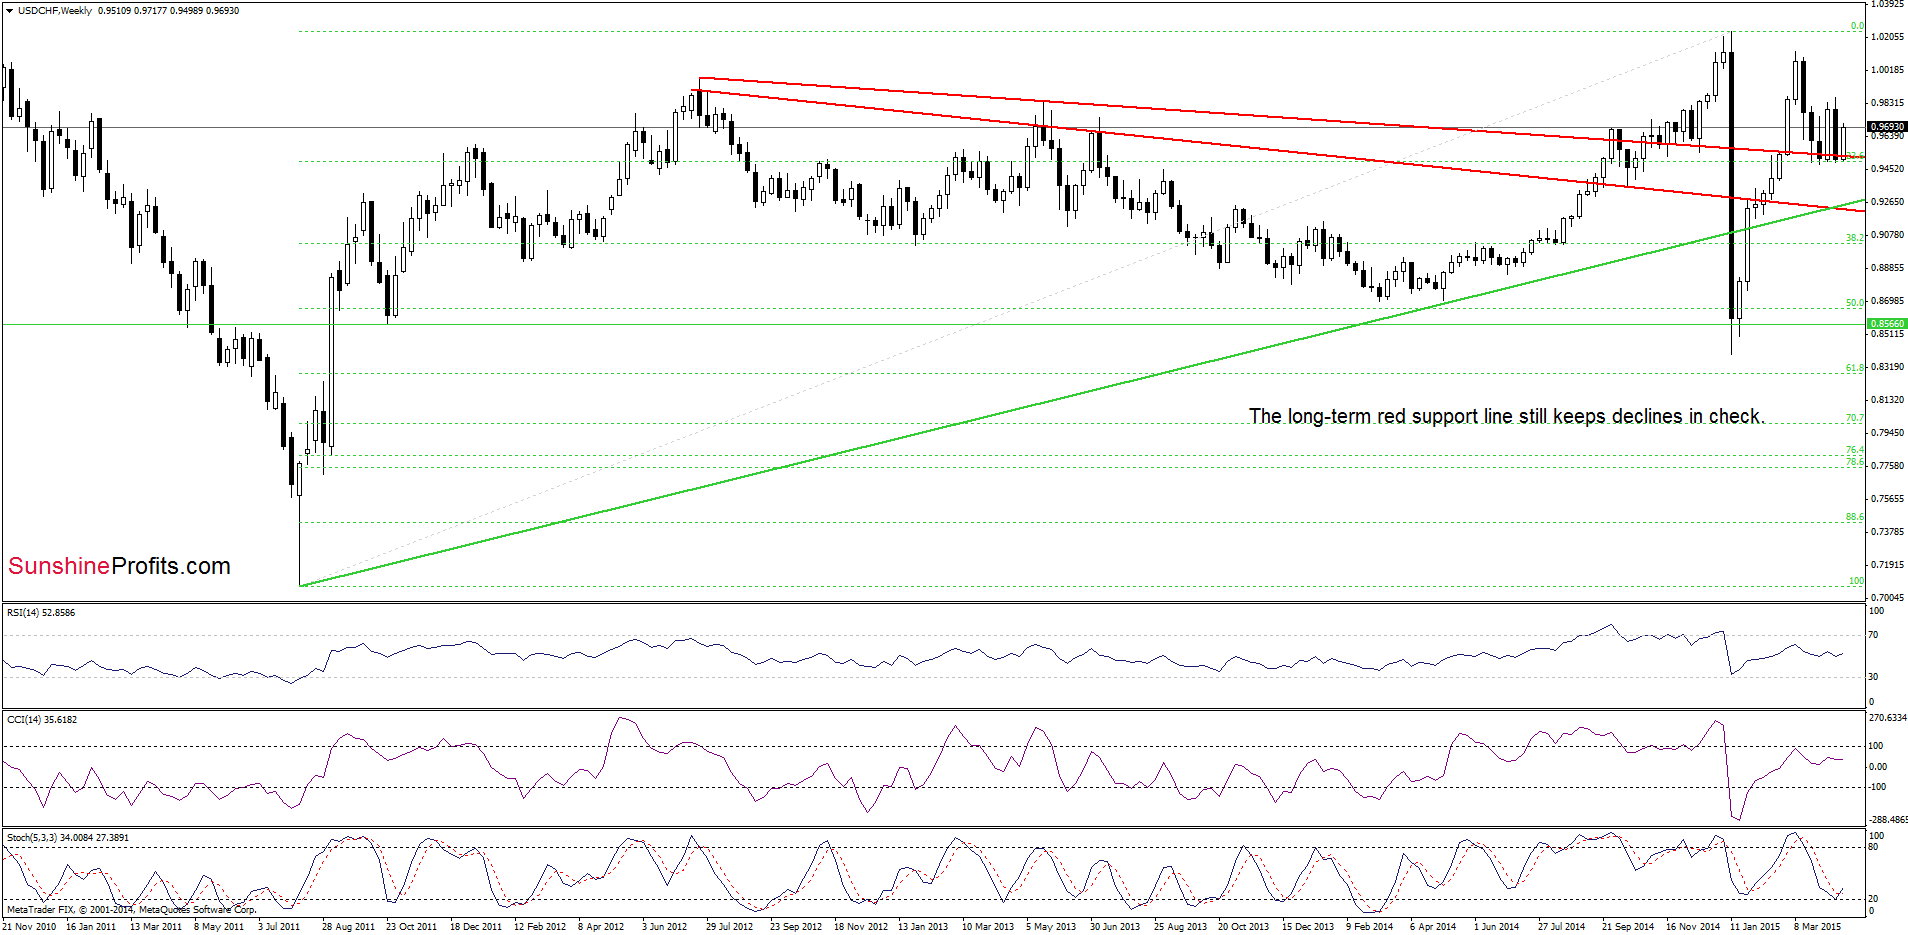
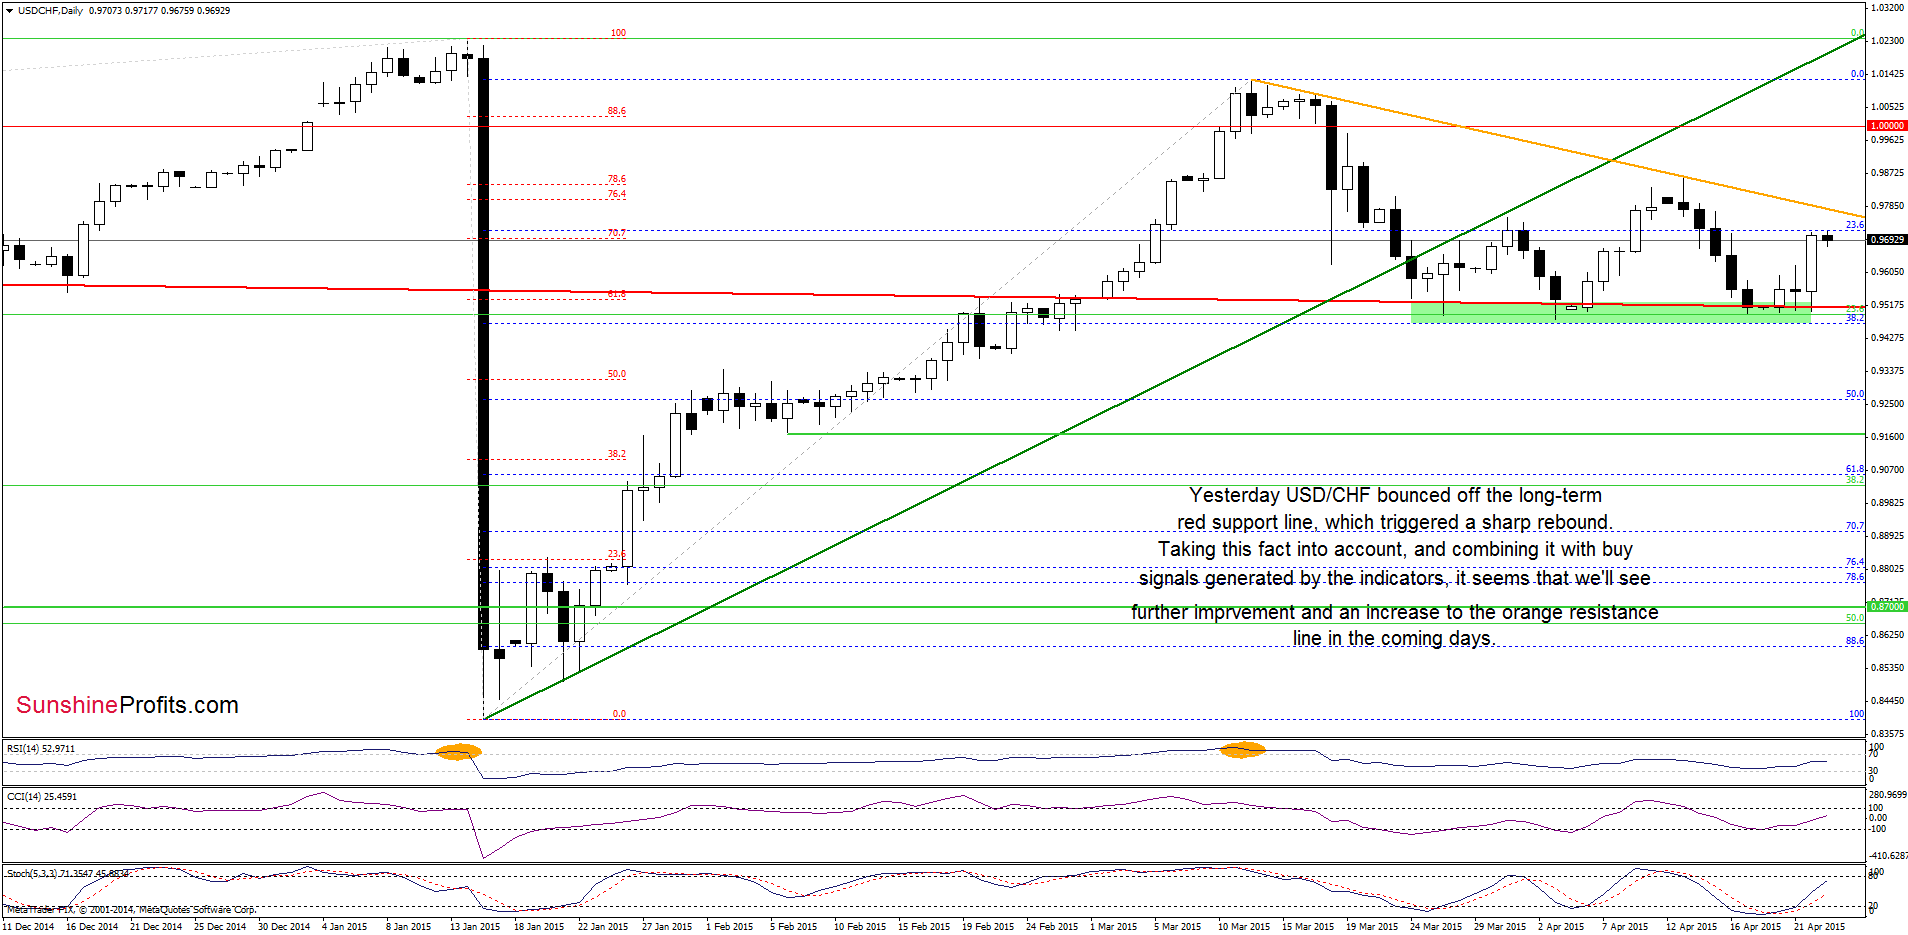
The first thing that catches the eye on the charts is an invalidation of a small breakdown under the long-term red line. Taking this positive fact into account, and combining it with the current position of the indicators (they generated buy signals), it seems that we’ll see further improvement and an increase to the orange resistance line (…) in the coming days.
From today’s point of view, we see that USD/CHF bounced off the long-term red support line once again, which triggered a sharp rebound and took the exchange rate to the previously-broken 23.6% Fibonacci retracement. Although the pair moved little lower earlier today, it seems that buy signals generated by the indicators will encourage currency bulls to act and result in an increase to our upside target (currently around 0.9770) in the coming day(s).
Very short-term outlook: bullish
Short-term outlook: mixed
MT outlook: mixed
LT outlook: bearish
Trading position (short-term; our opinion): No positions are justified from the risk/reward perspective at the moment. We will keep you informed should anything change, or should we see a confirmation/invalidation of the above.
Thank you.
Nadia Simmons
Forex & Oil Trading Strategist
Przemyslaw Radomski, CFA
Founder, Editor-in-chief
Gold & Silver Trading Alerts
Forex Trading Alerts
Oil Investment Updates
Oil Trading Alerts
