

Briefly: In our opinion, speculative short positions are favored (with stop-loss at 2,330, and profit target at 2,150, S&P 500 index).
Our intraday outlook remains bearish, and our short-term outlook is bearish. Our medium-term outlook remains neutral, following S&P 500 index breakout above last year's all-time high:
Intraday outlook (next 24 hours): bearish
Short-term outlook (next 1-2 weeks): bearish
Medium-term outlook (next 1-3 months): neutral
Long-term outlook (next year): neutral
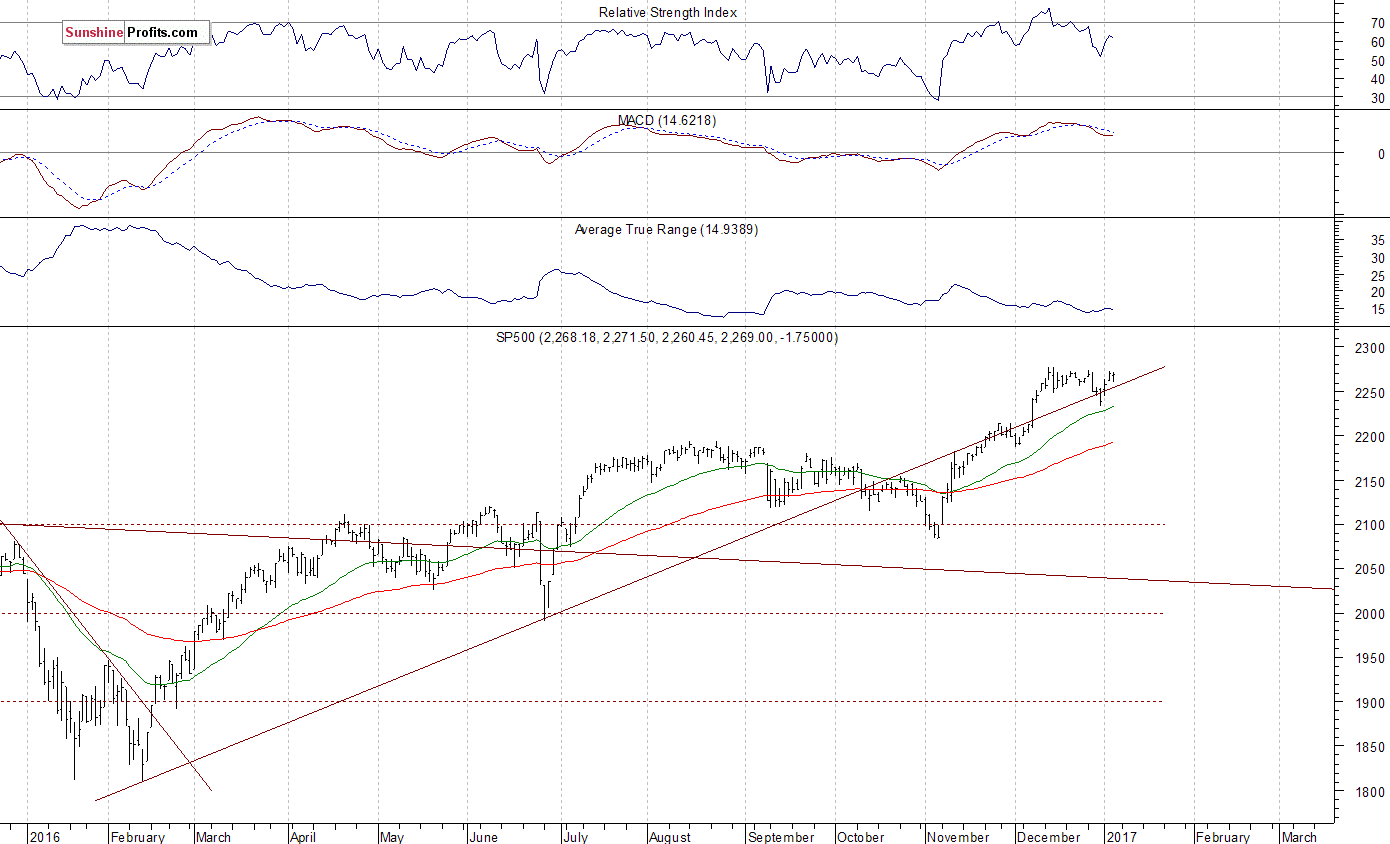
The U.S stock market indexes were mixed between -0.2% and +0.6% on Thursday, as investors took some short-term profits off the table following Tuesday - Wednesday rally. Overall, there has been no clear short-term direction. The S&P 500 index continues to trade relatively close to its December 13 all-time high of 2,277.53. For now, it looks like a flat correction within an uptrend from last year's early November low. But will the market extend its year-long uptrend even further before some more meaningful downward correction? The next possible resistance level is at 2,300 mark. The nearest important resistance level remains at around 2,280, marked by all-time high. On the other hand, support level is at 2,230-2,250, marked by recent local lows. The next support level remains at 2,200-2,220. The index continues to trade along its medium-term upward trend line. It is also within a few-week long consolidation, as we can see on the daily chart:
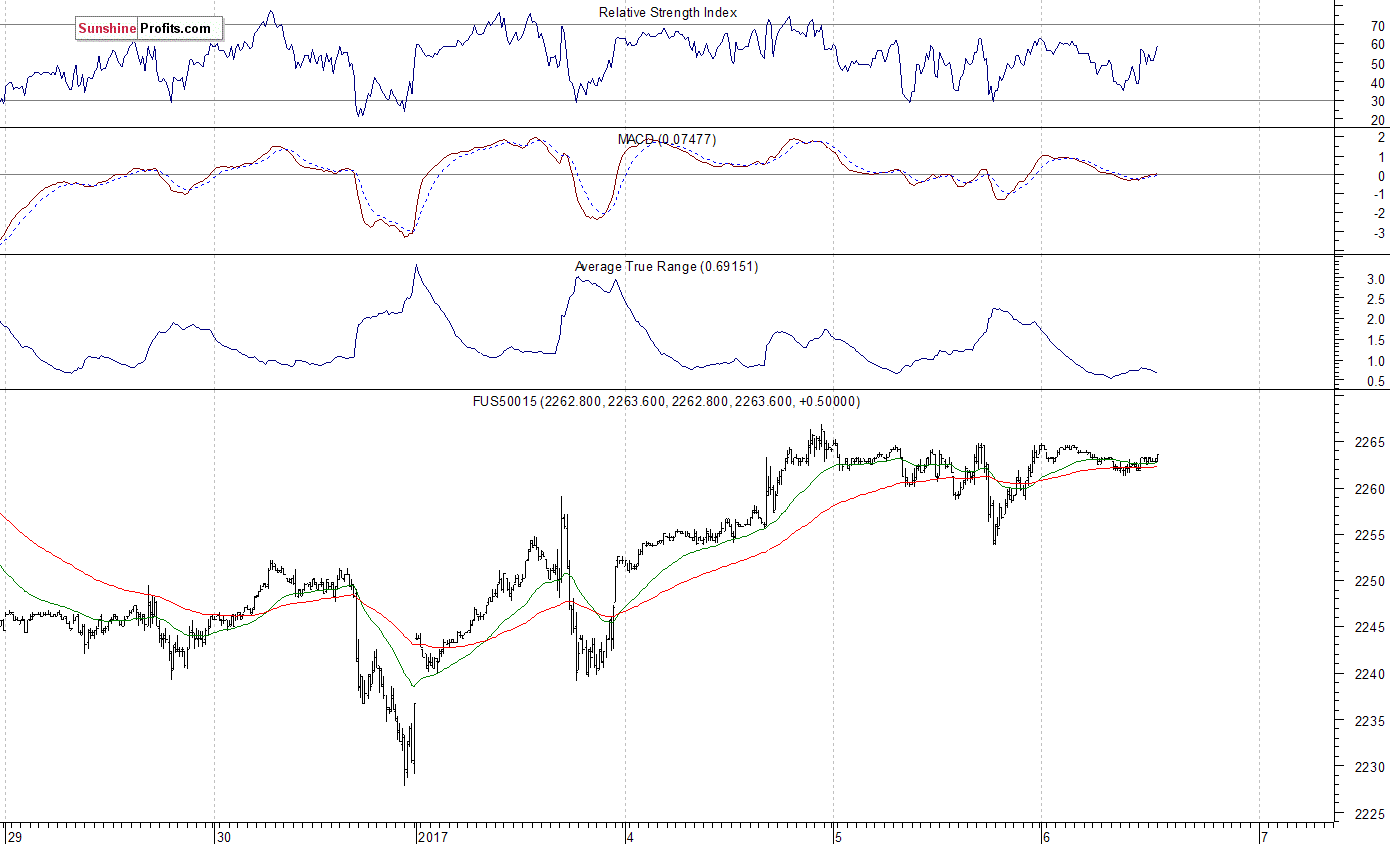
Expectations before the opening of today's trading session are virtually flat, as short-term uncertainty extends. The main European stock market indexes have lost between 0.1% and 0.4% so far. Investors will now wait for the economic data announcements: Nonfarm Payrolls, Unemployment Rate, Trade Balance at 2:20 a.m., Factory Orders release at 10:00 a.m. The monthly jobs data release from the Bureau of Labor Statistics may lead to an increase in market volatility. The S&P 500 futures contract trades within an intraday consolidation, following yesterday's bounce off support level at around 2,250-2,255. It continues to trade above Friday's local highs along the level of 2,250. The next important level of resistance is at around 2,270-2,280, marked by previous consolidation along record highs. The next support level is at around 2,240, marked by recent local low. For now, it looks like a flat correction within a short-term uptrend. However, the market remains below the resistance level marked by December consolidation. Will it break above its record highs following today's economic data releases?
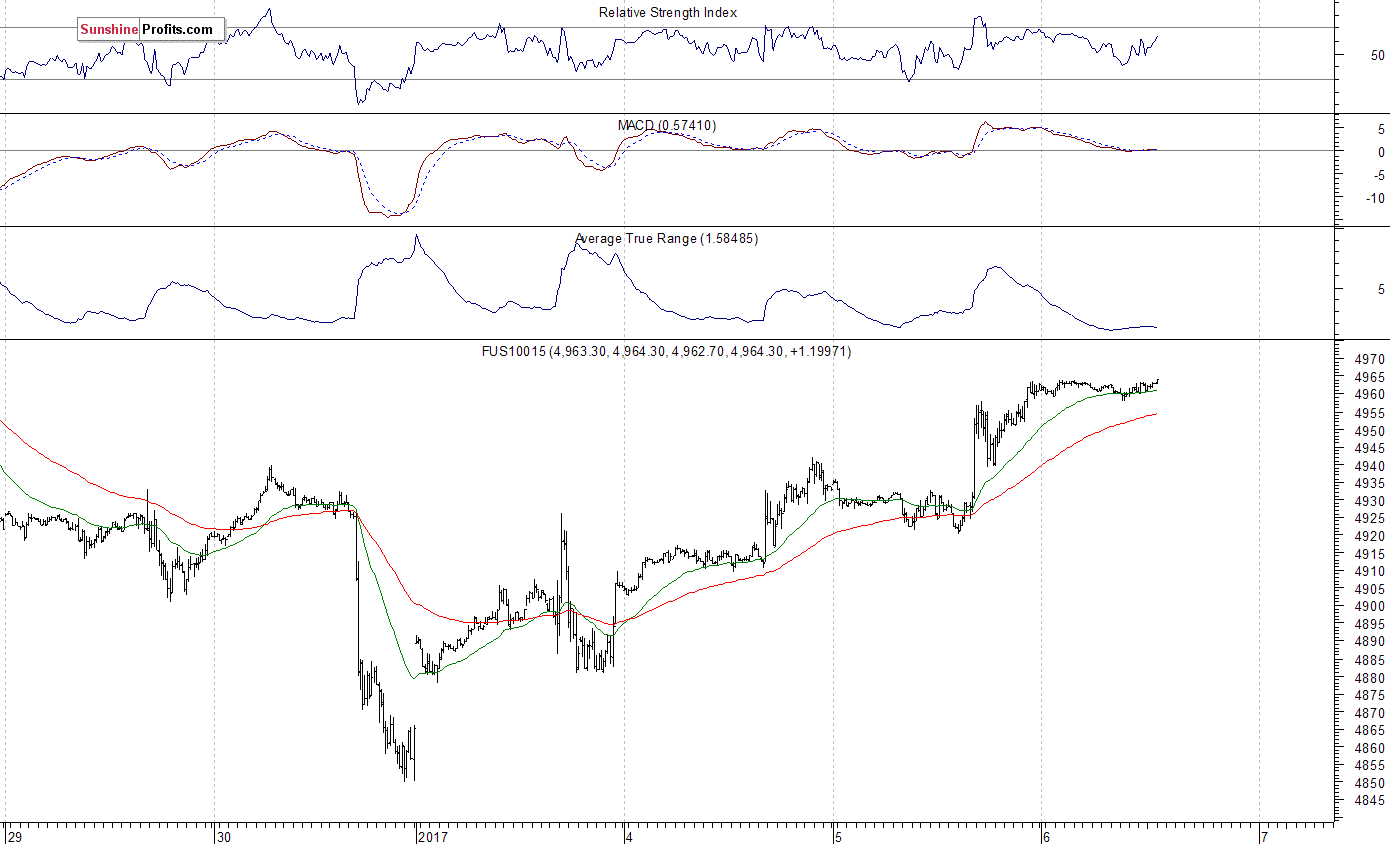
The technology Nasdaq 100 futures contract has been relatively stronger than the broad stock market recently. It is currently trading within an intraday consolidation along the level of 4,960. The nearest important level of resistance is at around 4,980-5,000, marked by record highs. For now, it looks like a flat correction within a short-term uptrend. Will the technology Nasdaq 100 futures contract continue its medium-term uptrend and break above round resistance level of 5,000? There have been no confirmed negative signals so far. However, we can see some short-term overbought conditions:
Concluding, the broad stock market remained within a short-term consolidation on Thursday, as the S&P 500 index continued to trade relatively close to its record high of 2,277.53. It has quickly retraced its late December decline on the two first trading sessions of the new year. It is back in its December trading range again. Is this a new short-term uptrend or just move up within a few-week long consolidation? We still can see some medium-term overbought conditions accompanied by negative technical divergences. Therefore, we continue to maintain our speculative short position (opened on December 14 at 2,268.35 - opening price of the S&P 500 index). Stop-loss level remains at 2,330 and potential profit target is at 2,150 (S&P 500 index). You can trade S&P 500 index using futures contracts (S&P 500 futures contract - SP, E-mini S&P 500 futures contract - ES) or an ETF like the SPDR S&P 500 ETF - SPY. It is always important to set some exit price level in case some events cause the price to move in the unlikely direction. Having safety measures in place helps limit potential losses while letting the gains grow.
To summarize: short position in S&P 500 index is justified from the risk/reward perspective with the following entry prices, stop-loss orders and profit target price levels:
S&P 500 index - short position: profit target level: 2,150; stop-loss level: 2,330
S&P 500 futures contract (March 2017) - short position: profit target level: 2,145; stop-loss level: 2,325
SPY ETF (SPDR S&P 500, not leveraged) - short position: profit target level: $214; stop-loss level: $232
SDS ETF (ProShares UltraShort S&P500, leveraged: -2x) - long position: profit target level: $16.35; stop-loss level: $14.00 (calculated using trade's opening price on Dec 14 at $14.78).
Thank you.
Paul Rejczak
Stock Trading Strategist
Stock Trading Alerts

