

Briefly: In our opinion, speculative short positions are favored (with stop-loss at 2,330, and profit target at 2,150, S&P 500 index).
Our intraday outlook remains bearish, and our short-term outlook is bearish. Our medium-term outlook remains neutral, following S&P 500 index breakout above last year's all-time high:
Intraday outlook (next 24 hours): bearish
Short-term outlook (next 1-2 weeks): bearish
Medium-term outlook (next 1-3 months): neutral
Long-term outlook (next year): neutral
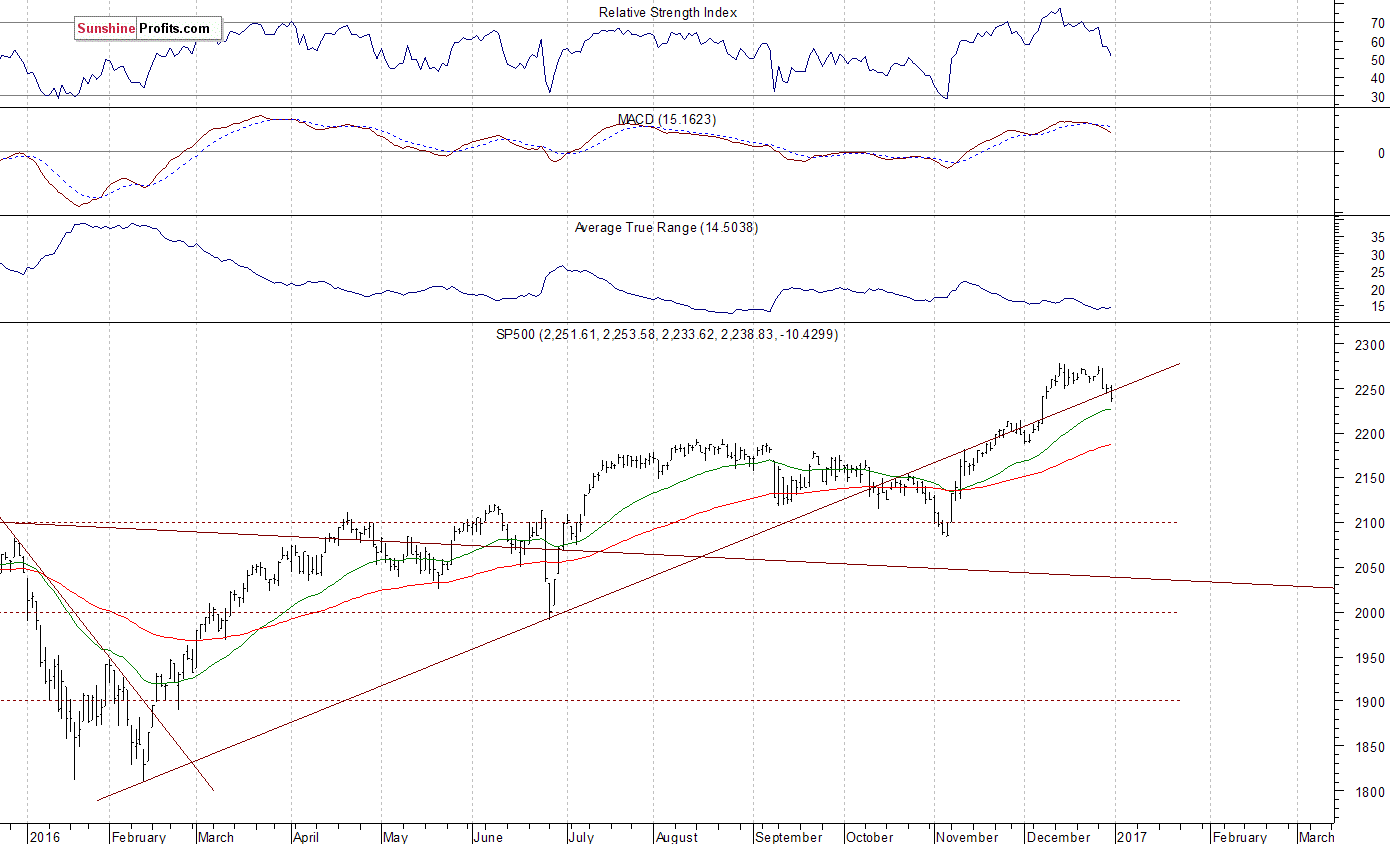
The main U.S. stock market indexes lost between 0.3% and 1.1% on Friday, extending their short-term downtrend, as investors continued to take profits off the table following November - December rally from medium-term support level at 2,100. The S&P 500 index has retraced some of its early December advance recently. The nearest important level of resistance remains at around 2,260-2,280, marked by the December 13 all-time high of 2,277.53, among others. On the other hand, support level is at 2,200-2,220, marked by previous level of resistance. The next support level is at 2,150, marked by November consolidation, among others. The index continues to trade along its medium-term upward trend line. Is this a topping pattern or just some quick downward correction before another leg up? There have been no confirmed negative signals so far. However, we still can see medium-term overbought conditions along with negative technical divergences. The S&P 500 index remains within an almost year-long uptrend off February 2016 low, as the daily chart shows:
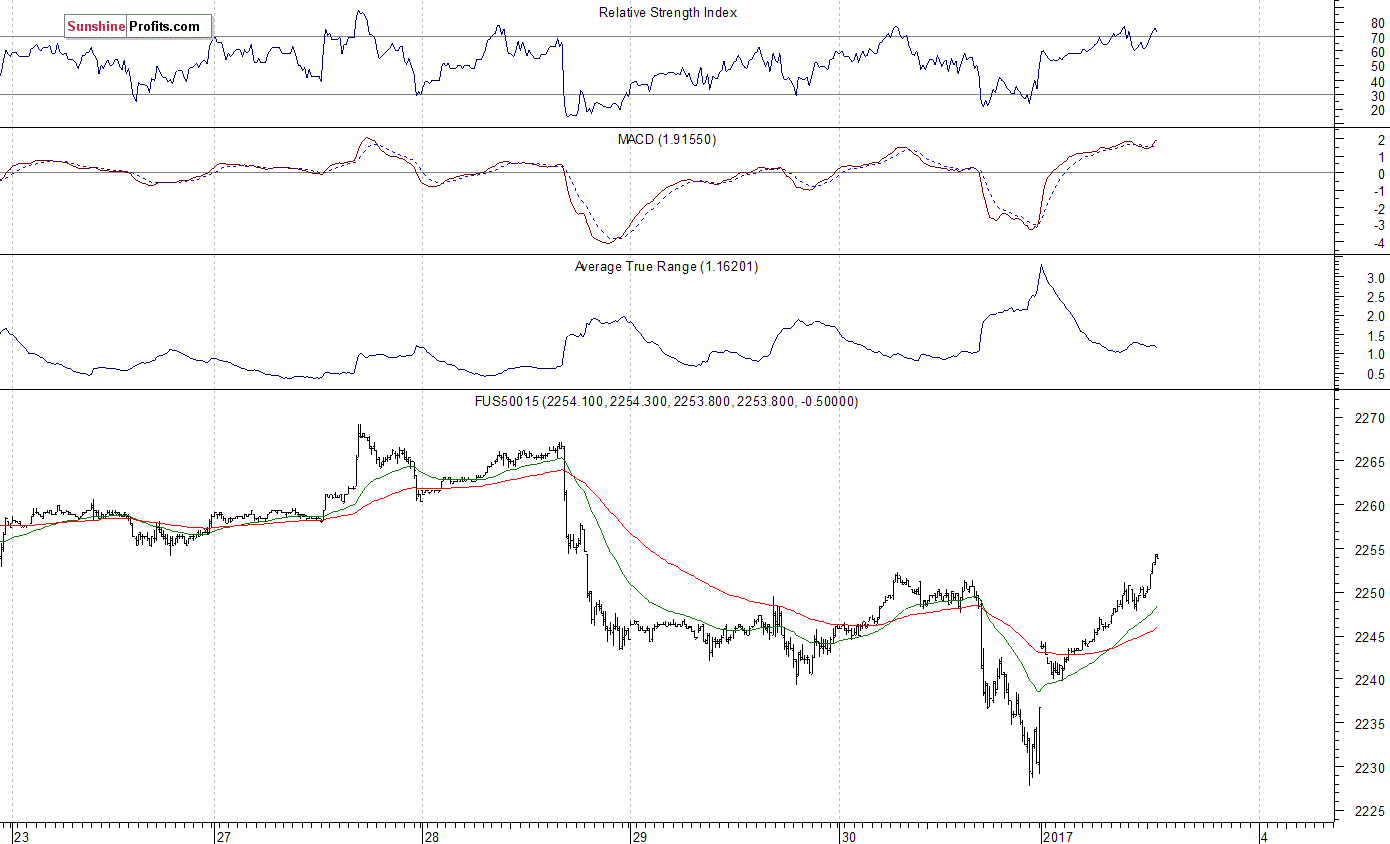
Expectations before the opening of today's trading session are very positive, following the first day of the new year's European stock markets' rally. The index futures are currently up between 0.8% and 0.9%. The European stock market indexes have gained 0.2-0.5% so far. Investors will now wait for some economic data announcements: Construction Spending number, ISM Index at 10:00 a.m. The S&P 500 futures contract trades within a relatively strong intraday uptrend following an overnight gap-up opening. It currently trades above its Friday's local highs along the level of 2,250. The next important level of resistance is at around 2,260-2,280, marked by previous consolidation along record highs. On the other hand, support level is at 2,240, marked by today's local low, among others. The next support level is at around 2,225-2,230, marked by Friday's local low. For now, it looks like an upward correction within a short-term downtrend. The market remains slightly below its recent trading range, as we can see on the 15-minute chart:
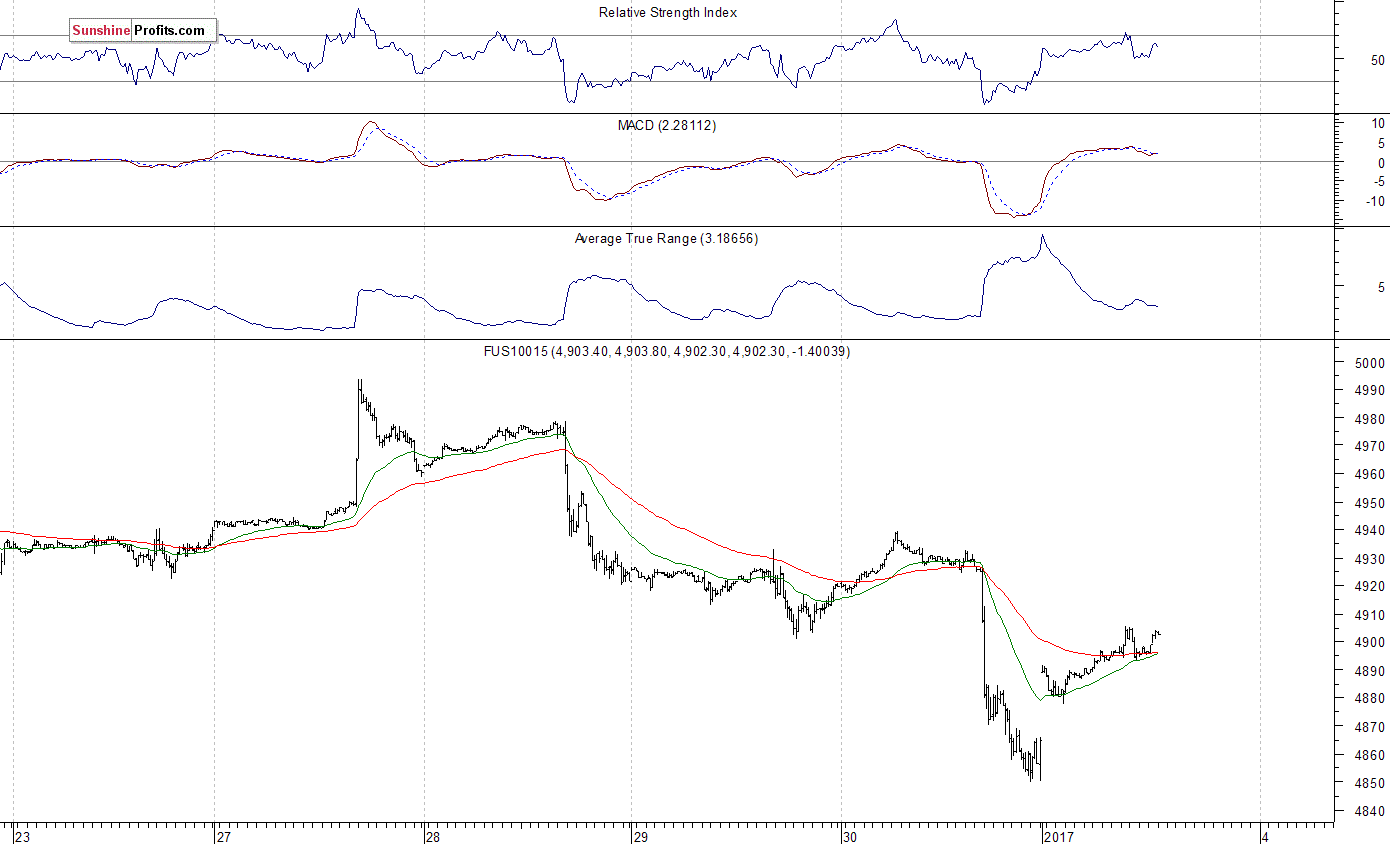
The technology Nasdaq 100 futures contract follows a similar path, as it currently trades within an intraday uptrend following a gap-up opening. The market retraces some of its Friday's sell-off following a bounce off support level at around 4,850. The nearest important level of resistance remains at 4,900-4,950, marked by recent consolidation, and the next resistance level is at 5,000 mark. For now, it looks like an upward correction within a short-term downtrend. Will the technology Nasdaq 100 futures contract resume its medium-term uptrend and break above round resistance level of 5,000?
Concluding, the broad stock market extended its short-term downtrend on Friday, as the S&P 500 index broke slightly below 2,250 mark. Is this just a downward correction following November - December rally? Will the S&P 500 index retrace its recent weakness today? We still can see some medium-term overbought conditions accompanied by negative technical divergences. Therefore, we continue to maintain our speculative short position (opened on December 14 at 2,268.35 - opening price of the S&P 500 index). Stop-loss level is at 2,330 and potential profit target is at 2,150 (S&P 500 index). You can trade S&P 500 index using futures contracts (S&P 500 futures contract - SP, E-mini S&P 500 futures contract - ES) or an ETF like the SPDR S&P 500 ETF - SPY. It is always important to set some exit price level in case some events cause the price to move in the unlikely direction. Having safety measures in place helps limit potential losses while letting the gains grow.
To summarize: short position in S&P 500 index is justified from the risk/reward perspective with the following entry prices, stop-loss orders and profit target price levels:
S&P 500 index - short position: profit target level: 2,150; stop-loss level: 2,330
S&P 500 futures contract (March 2017) - short position: profit target level: 2,145; stop-loss level: 2,325
SPY ETF (SPDR S&P 500, not leveraged) - short position: profit target level: $214; stop-loss level: $232
SDS ETF (ProShares UltraShort S&P500, leveraged: -2x) - long position: profit target level: $16.35; stop-loss level: $14.00 (calculated using trade's opening price on Dec 14 at $14.78).
Thank you.
Paul Rejczak
Stock Trading Strategist
Stock Trading Alerts

