

Briefly: In our opinion, no speculative positions are justified.
Our intraday outlook is neutral, and our short-term outlook is neutral. Our medium-term outlook remains bearish, as the S&P 500 index extends its lower highs, lower lows sequence:
Intraday outlook (next 24 hours): neutral
Short-term outlook (next 1-2 weeks): neutral
Medium-term outlook (next 1-3 months): bearish
Long-term outlook (next year): neutral
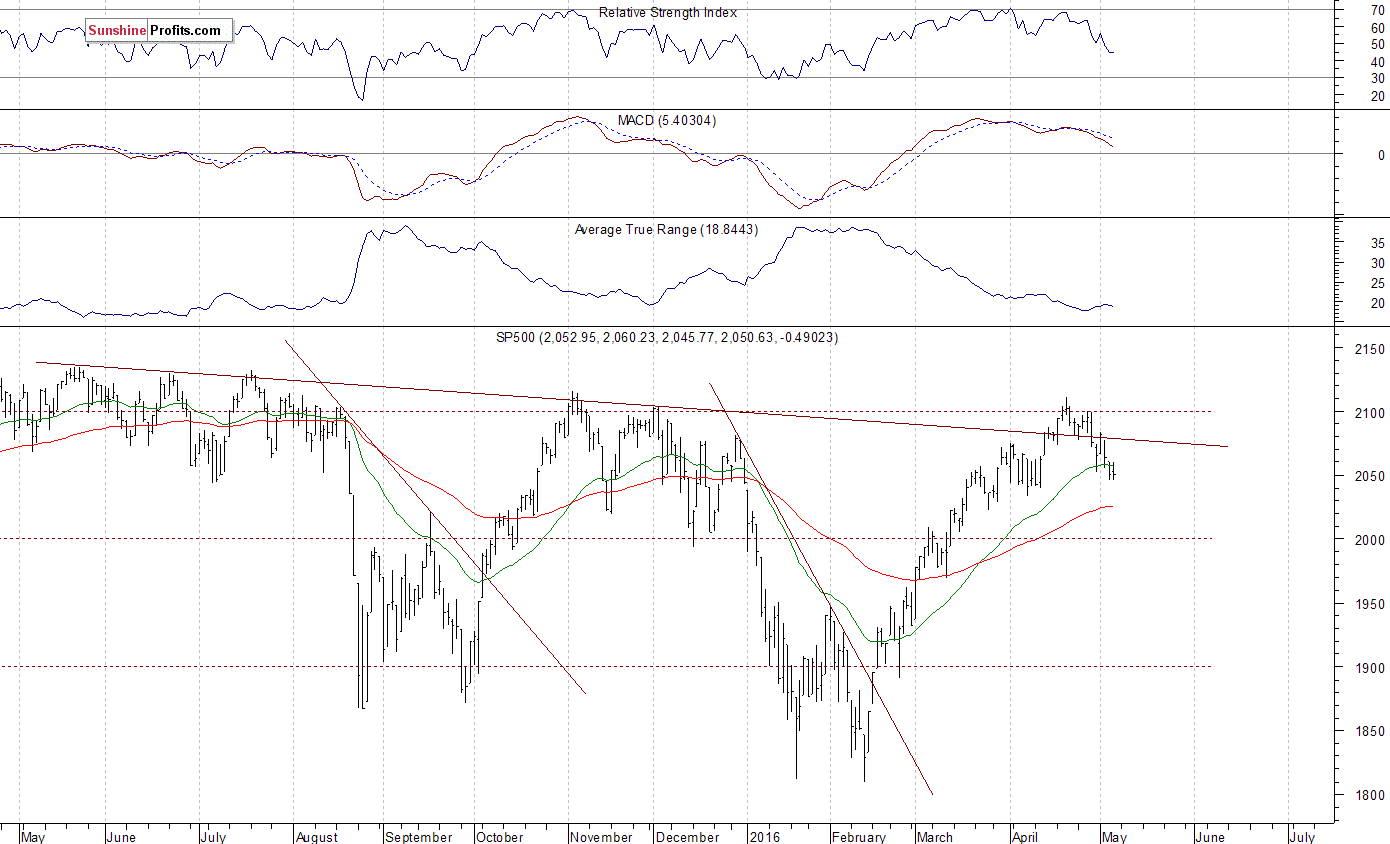
The U.S. stock market indexes were virtually flat on Thursday, as investors hesitated following recent move down. The S&P 500 index continues to trade along its support level of 2,050. The next important level of support is at around 2,030-2,035, marked by previous local lows. On the other hand, resistance level is at 2,070-2,075, marked by the late April short-term consolidation. The next level of resistance remains at 2,100-2,115, marked by medium-term local highs. Is this the end of two-month long uptrend? Or is it just a correction before another leg up reaching last year's all-time high? Last year's highs along the level of 2,100 continue to act as medium-term resistance level, as we can see on the daily chart:
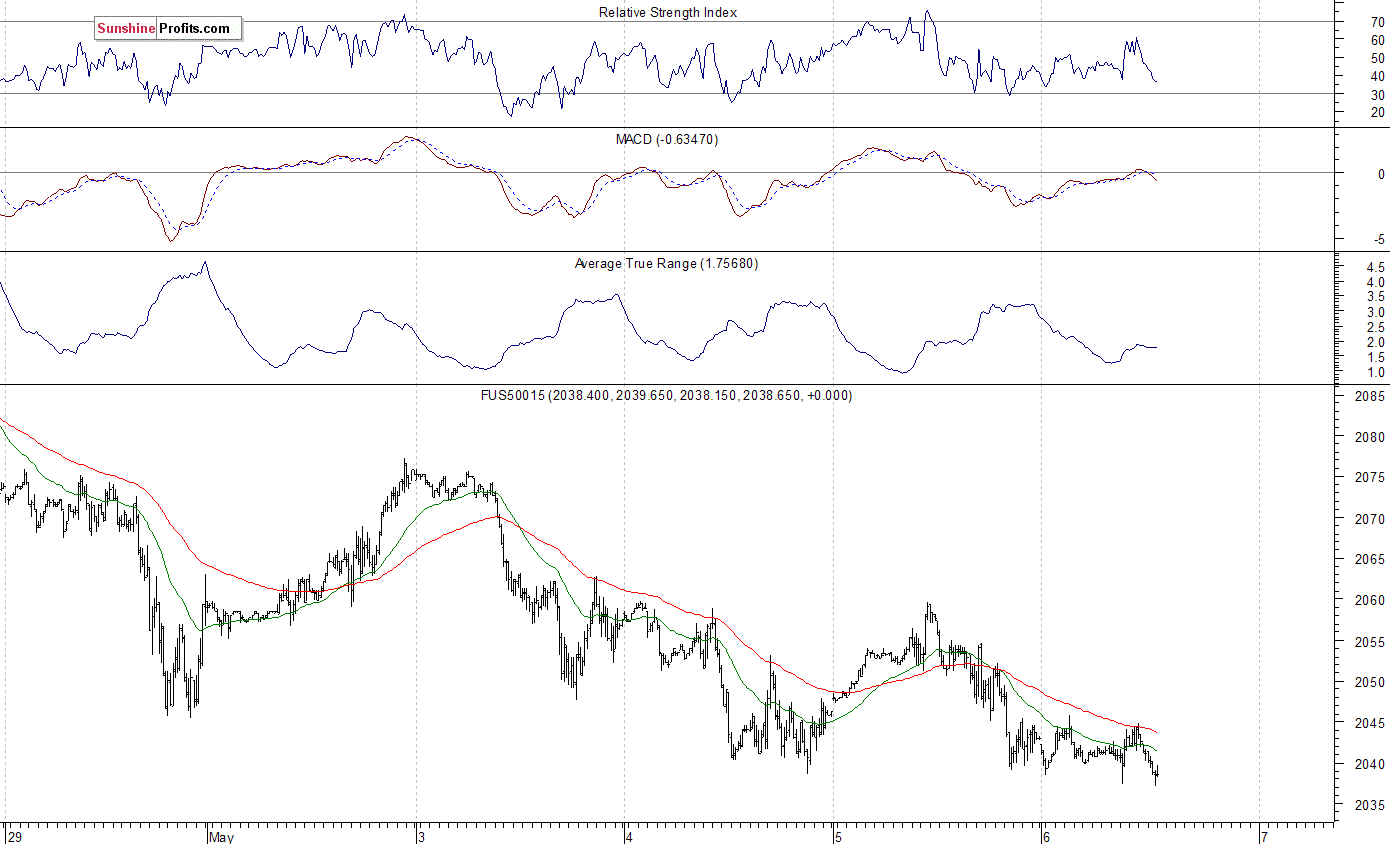
Expectations before the opening of today's trading session are slightly negative, with index futures currently down 0.2%. The European stock market indexes have lost 0.9-1.2% so far. Investors will now wait for the Monthly Nonfarm Payrolls number along with the Unemployment Rate announcement at 8:30 a.m. The S&P 500 futures contract trades within an intraday consolidation, following yesterday's move down towards support level of 2,030-2,040. The nearest important level of resistance is at 2,045-2,050, marked by local highs. The market extends its descending short-term trading channel, as we can see on the 15-minute chart:
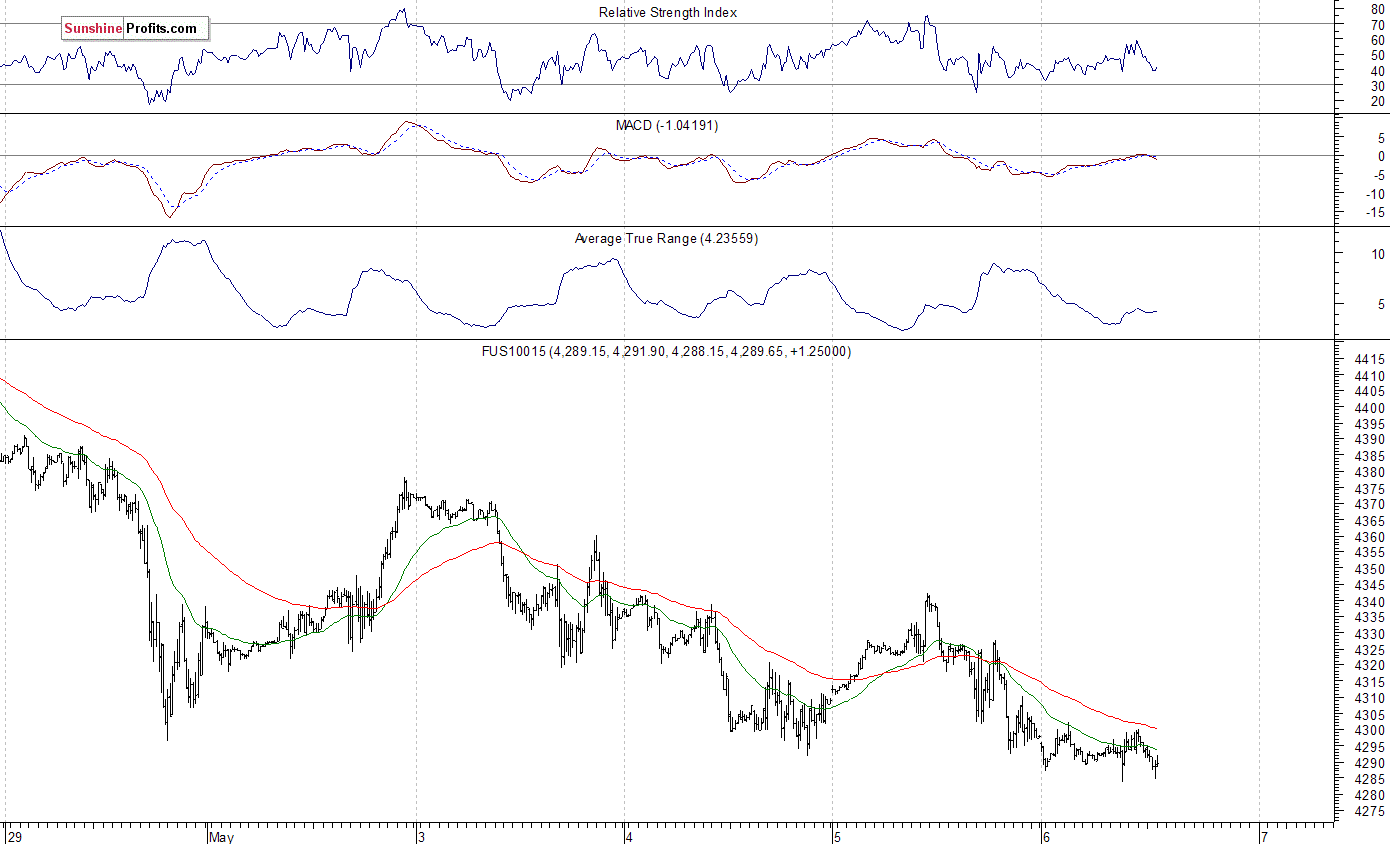
The technology Nasdaq 100 futures contract follows a similar path, as it currently trades slightly below the level of 4,300. The nearest important level of resistance is at 4,320-4,340, marked by recent local highs. The nearest important support level is at 4,280, as the 15-minute chart shows:
Concluding, the broad stock market continued to fluctuate within a relatively narrow trading range on Thursday, as it extended its short-term consolidation along the level of 2,050. Is this just a downward correction following over two-month long rally or new medium-term downtrend? The S&P 500 index continues to trade above its late March - early April local lows. It still looks like a downward correction, so we prefer to be out of the market, avoiding low risk/reward ratio trades. We will let you know when we think it is safe to get back in the market.
Thank you.
Paul Rejczak
Stock Trading Strategist
Stock Trading Alerts

