
Briefly: In our opinion, no speculative positions are justified.
Our intraday outlook is neutral, and our short-term outlook is neutral. Our medium-term outlook remains bearish, as the S&P 500 index extends its lower highs, lower lows sequence. However, we decided to change our long-term outlook to neutral recently, following recent move down below medium-term lows:
Intraday outlook (next 24 hours): neutral
Short-term outlook (next 1-2 weeks): neutral
Medium-term outlook (next 1-3 months): bearish
Long-term outlook (next year): neutral
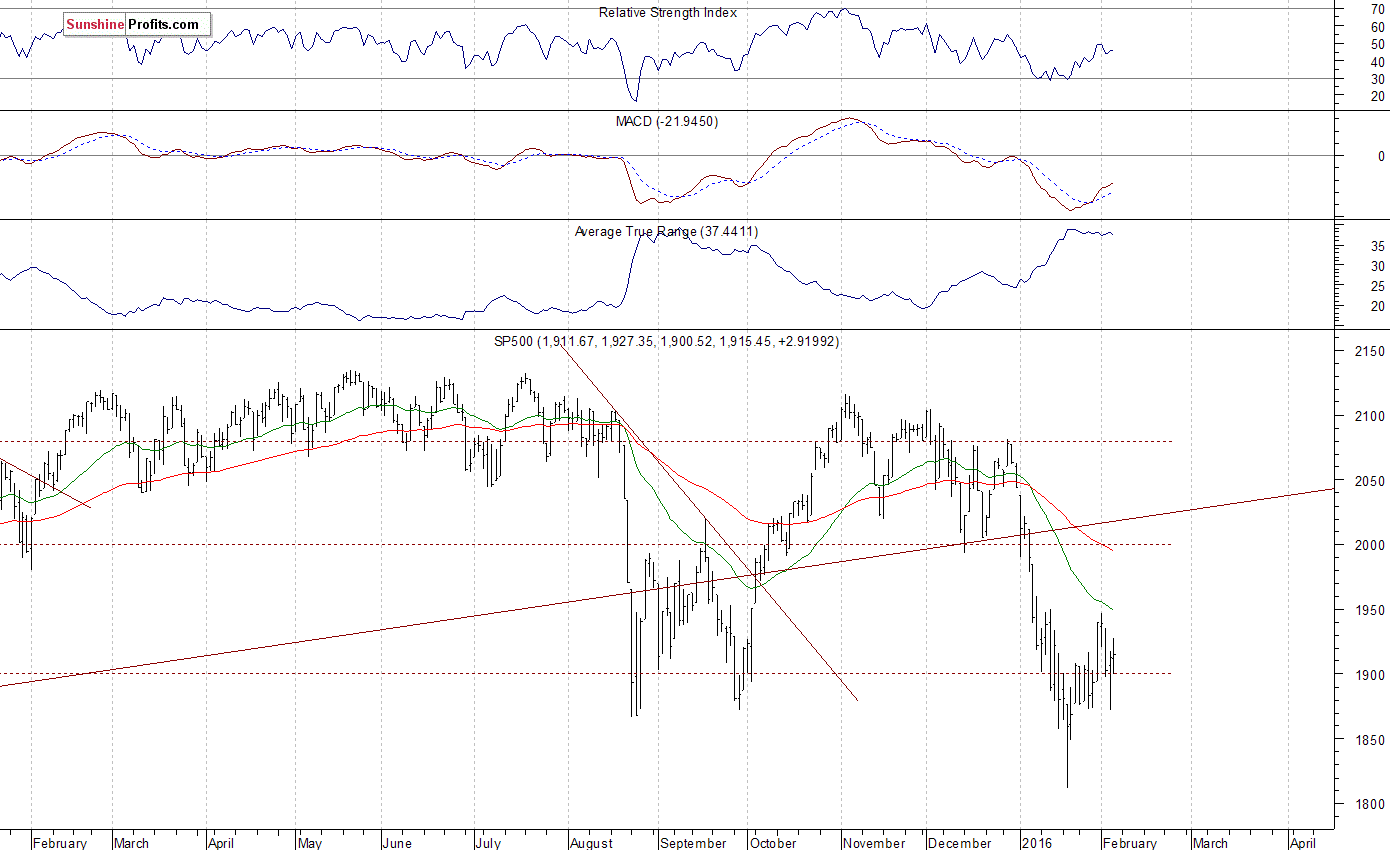
The U.S. stock market indexes were mixed between -0.1% and +0.5% on Thursday, extending their short-term consolidation further, as investors awaited today's monthly employment data release, among others. Our yesterday's neutral intraday outlook has proved accurate. The S&P 500 index remains close to 1,900 mark, as it fluctuates following first half of January sell-off. There have been no confirmed positive signals so far. Last year's August - September lows continue to act as a medium-term support level. The nearest important level of resistance is at around 1,950, marked by Monday's local high. On the other hand, short-term support level is at 1,870, marked by recent local lows. Which direction is next? For now, it looks like a relatively flat correction following January move down, as we can see on the daily chart:
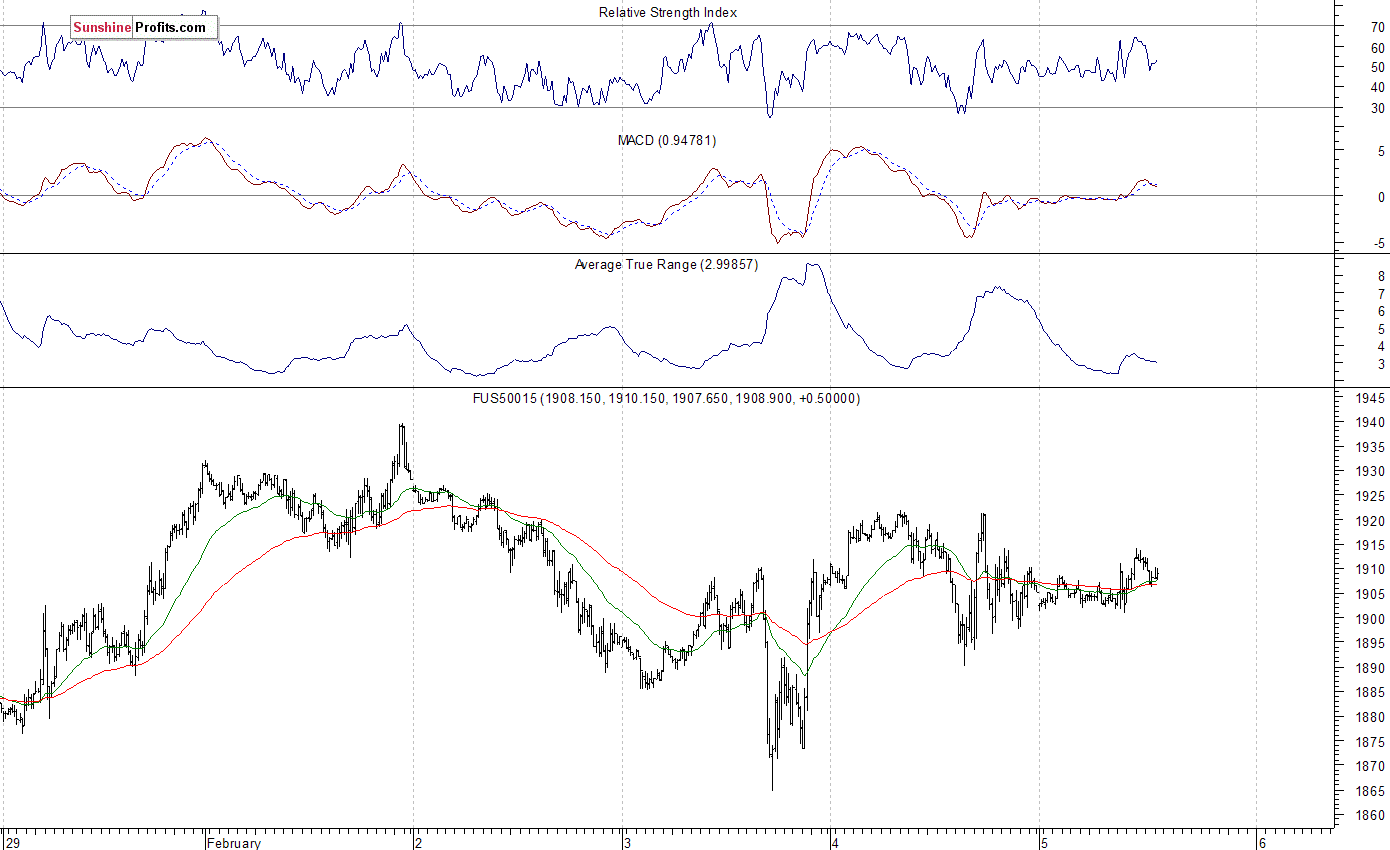
Expectations before the opening of today's trading session are virtually flat, with index futures currently down 0.1%. The main European stock market indexes have been mixed so far. Investors will now wait for the economic data announcements: Nonfarm Payrolls, Unemployment Rate, Trade Balance at 8:30 a.m. The S&P 500 futures contract trades within an intraday consolidation, as it fluctuates along the level of 1,900. There is no clear short-term direction, however, it looks like a flat correction following Wednesday's rebound off support level at 1,850-1,870. On the other hand, level of resistance remains at 1,920-1,950, marked by some recent local highs, as the 15-minute chart shows:
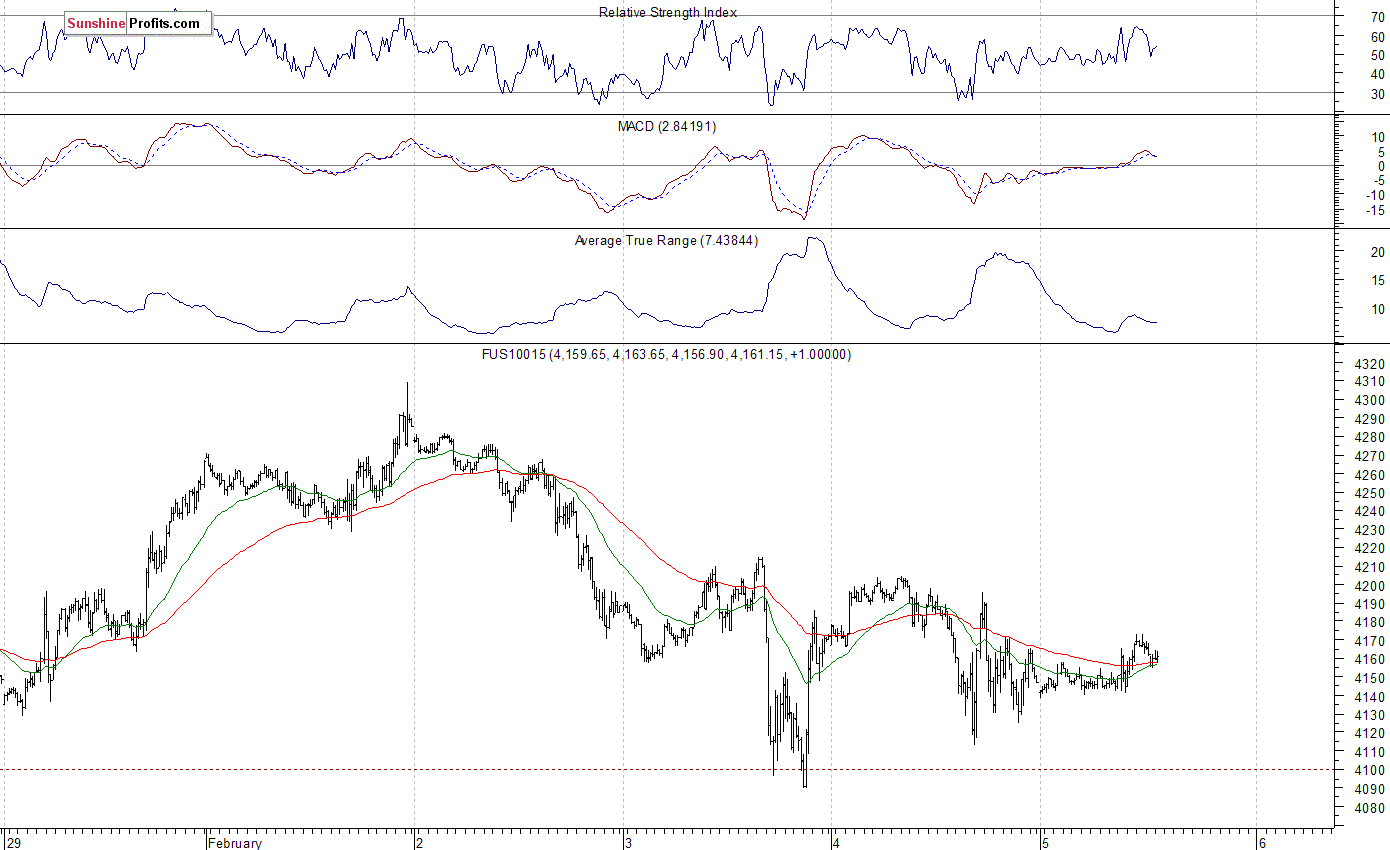
The technology Nasdaq 100 futures contract follows a similar path, as it currently trades along the level of 4,150. The nearest important level of resistance is at around 4,200, and support level remains at 4,080-4,100, marked by recent local low. Is this a flat correction following January sell-off or some bottoming pattern before a meaningful downtrend's reversal?
Concluding, the broad stock market continued to fluctuate on Thursday, as the S&P 500 index remained close to the level of 1,900. Investors will wait for today's important monthly employment data announcement. So, we may see some volatile short-term action today. Will the market continue its January's move down, or is this a bottoming consolidation before more meaningful medium-term downtrend's reversal? For now, the index continues to trade along its last year's August - September local lows, as they act as a medium-term level of support. We still prefer to be out of the market, avoiding low risk/reward ratio trades. We will let you know when we think it is safe to get back in the market.
Thank you.
Paul Rejczak
Stock Trading Strategist
Stock Trading Alerts

