
Briefly: In our opinion, no speculative positions are justified.
Our intraday outlook is neutral, and our short-term outlook is neutral. Our medium-term outlook remains bearish, as the S&P 500 index extends its lower highs, lower lows sequence. However, we decided to change our long-term outlook to neutral recently, following recent move down below medium-term lows:
Intraday outlook (next 24 hours): neutral
Short-term outlook (next 1-2 weeks): neutral
Medium-term outlook (next 1-3 months): bearish
Long-term outlook (next year): neutral
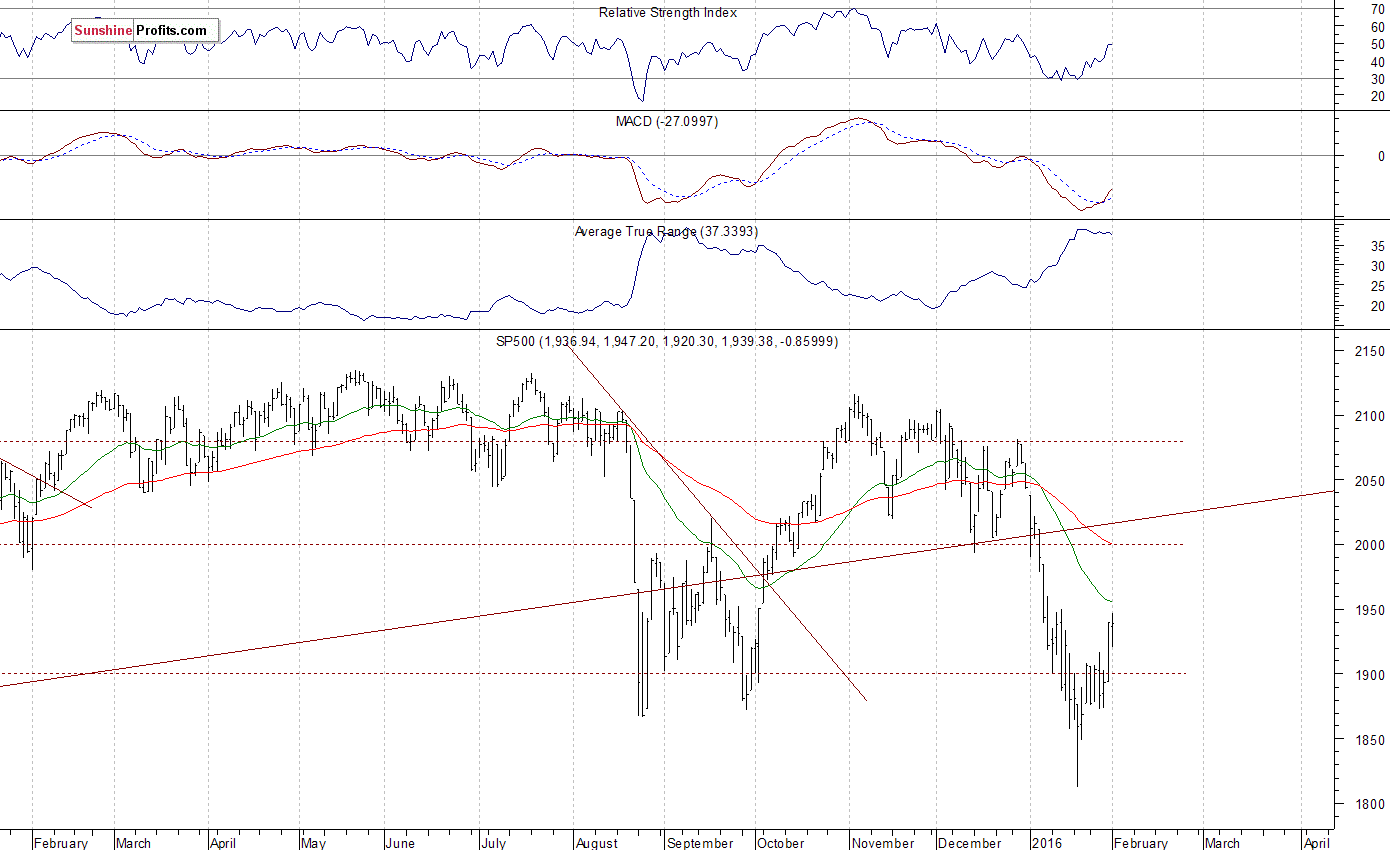
The main U.S. stock market indexes were mixed between -0.1% and +0.2% on Monday, as investors hesitated following recent rally. The S&P 500 index extended its short-term uptrend slightly, as it got closer to resistance level of 1,950. On the other hand, the nearest important level of support remains at around 1,900-1,920, marked by previous resistance level. Is this a new uptrend or just correction following January sell-off? For now, it looks like an upward correction. However, there have been no confirmed short-term negative signals so far:
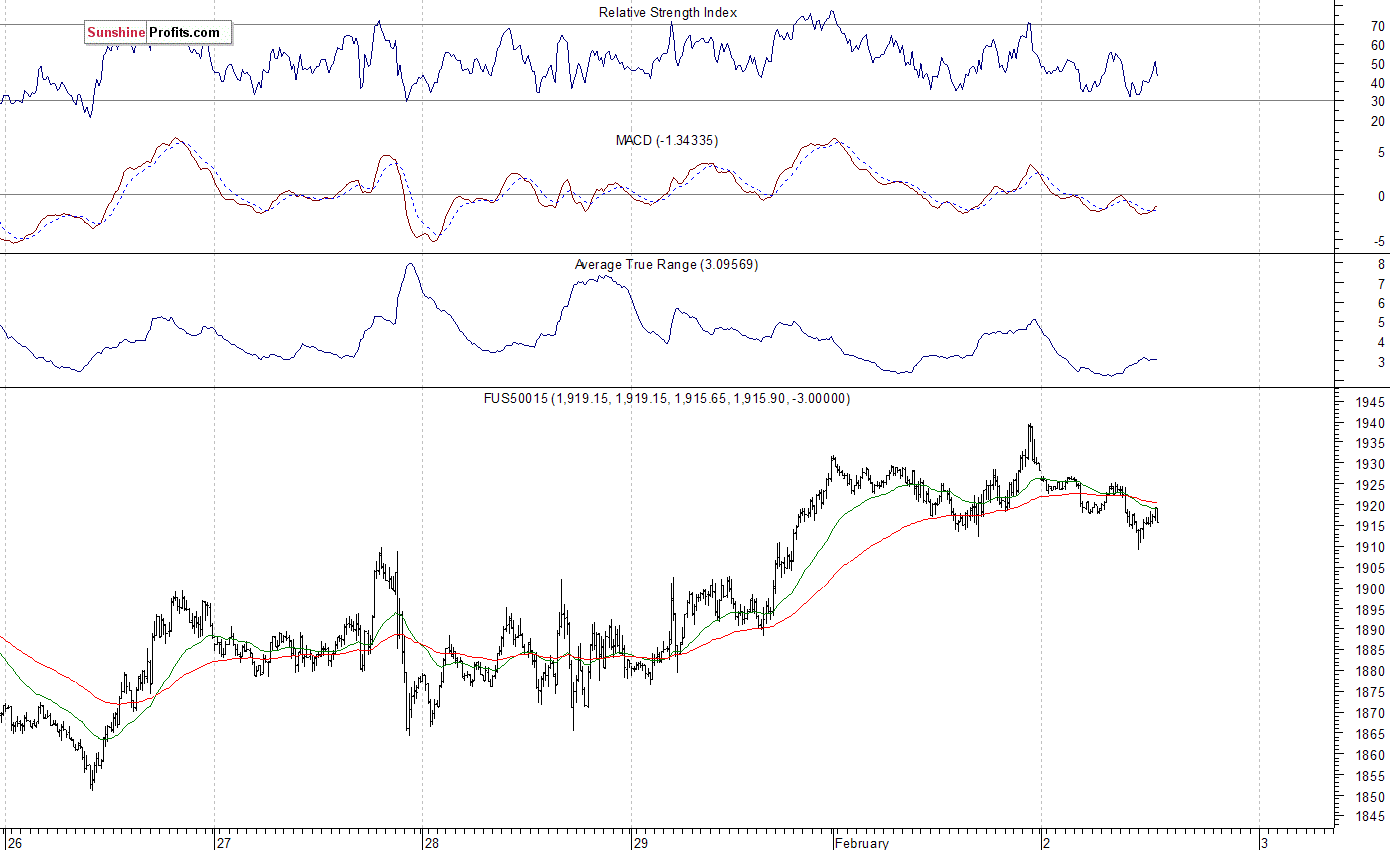
Expectations before the opening of today's trading session are negative, with index futures currently down 0.7-0.8%. The main European stock market indexes have lost 1.0-1.8% so far. Investors will wait for more quarterly corporate earnings releases. The S&P 500 futures contract trades within an intraday downtrend, as it extends flat correction following Friday's move up. The nearest important level of support is at 1,900 mark, and resistance level is at 1,930-1,940, marked by local high. There have been no confirmed short-term negative signals so far. However, it still looks like a correction following first half of January sell-off:
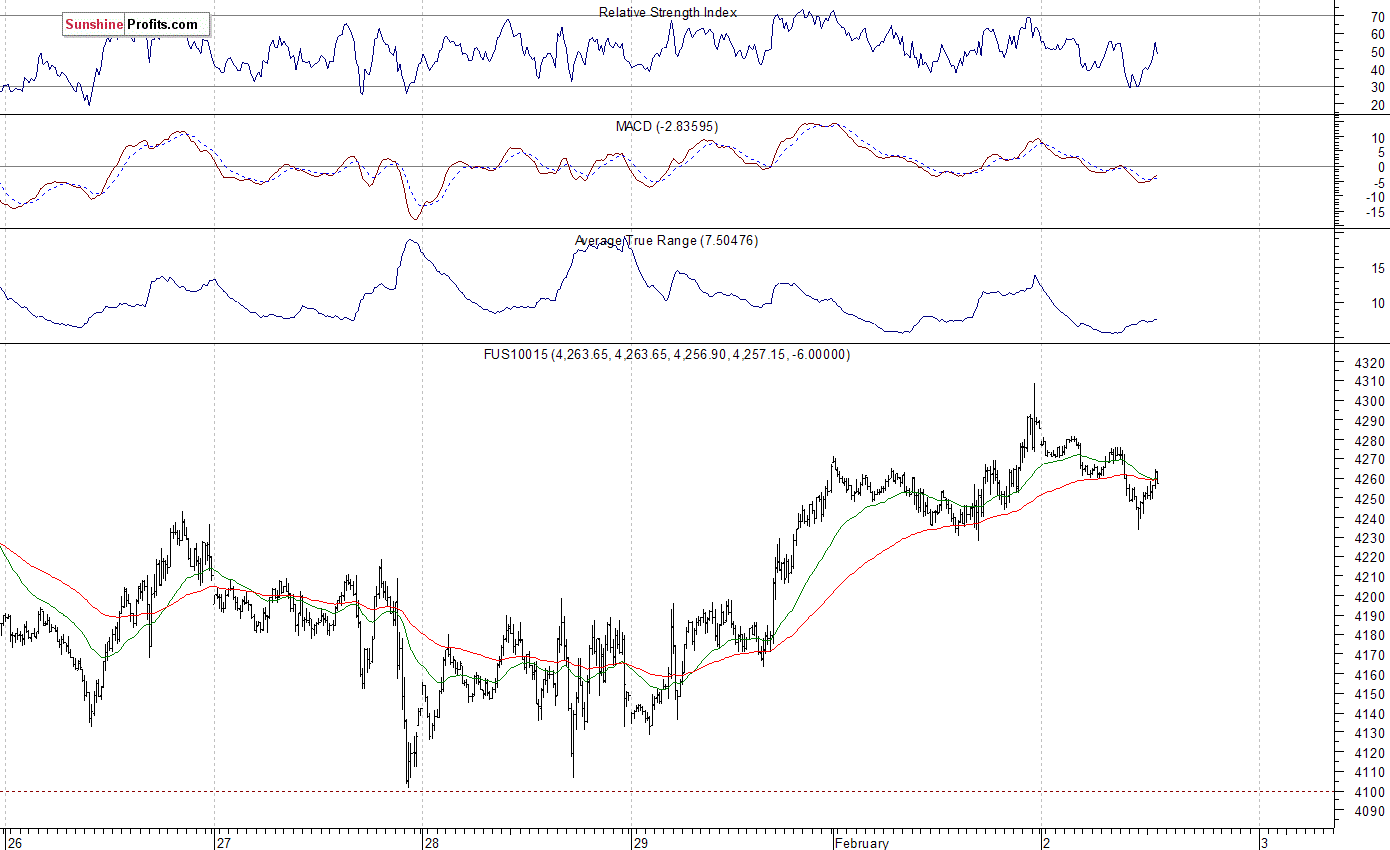
The technology Nasdaq 100 futures contract continues to trade along the level of 4,250 since yesterday. The nearest important level of resistance is at 4,270-4,300, and support level is at around 4,200, among others. The market is just above its last week's high, as technology stocks remain relatively weaker than the broad stock market, following some mixed quarterly earnings releases:
Concluding, the broad stock market fluctuated within a relatively tight trading range on Monday, as investors hesitated following Friday's rally. Is this just an upward correction following January sell-off or new uptrend towards above 2,000 mark? It looks like a correction, but the "V-shaped" medium-term reversal is not out of question. For now, the index continues to trade along its last year's August - September local lows, as they act as a medium-term level of support. We still prefer to be out of the market, avoiding low risk/reward ratio trades. We will let you know when we think it is safe to get back in the market.
Thank you.
Paul Rejczak
Stock Trading Strategist
Stock Trading Alerts

