
Briefly: In our opinion, no speculative positions are justified.
Our intraday outlook is neutral, and our short-term outlook is neutral. Our medium-term outlook remains bearish, as the S&P 500 index extends its lower highs, lower lows sequence. However, we decided to change our long-term outlook to neutral recently, following recent move down below medium-term lows:
Intraday outlook (next 24 hours): neutral
Short-term outlook (next 1-2 weeks): neutral
Medium-term outlook (next 1-3 months): bearish
Long-term outlook (next year): neutral
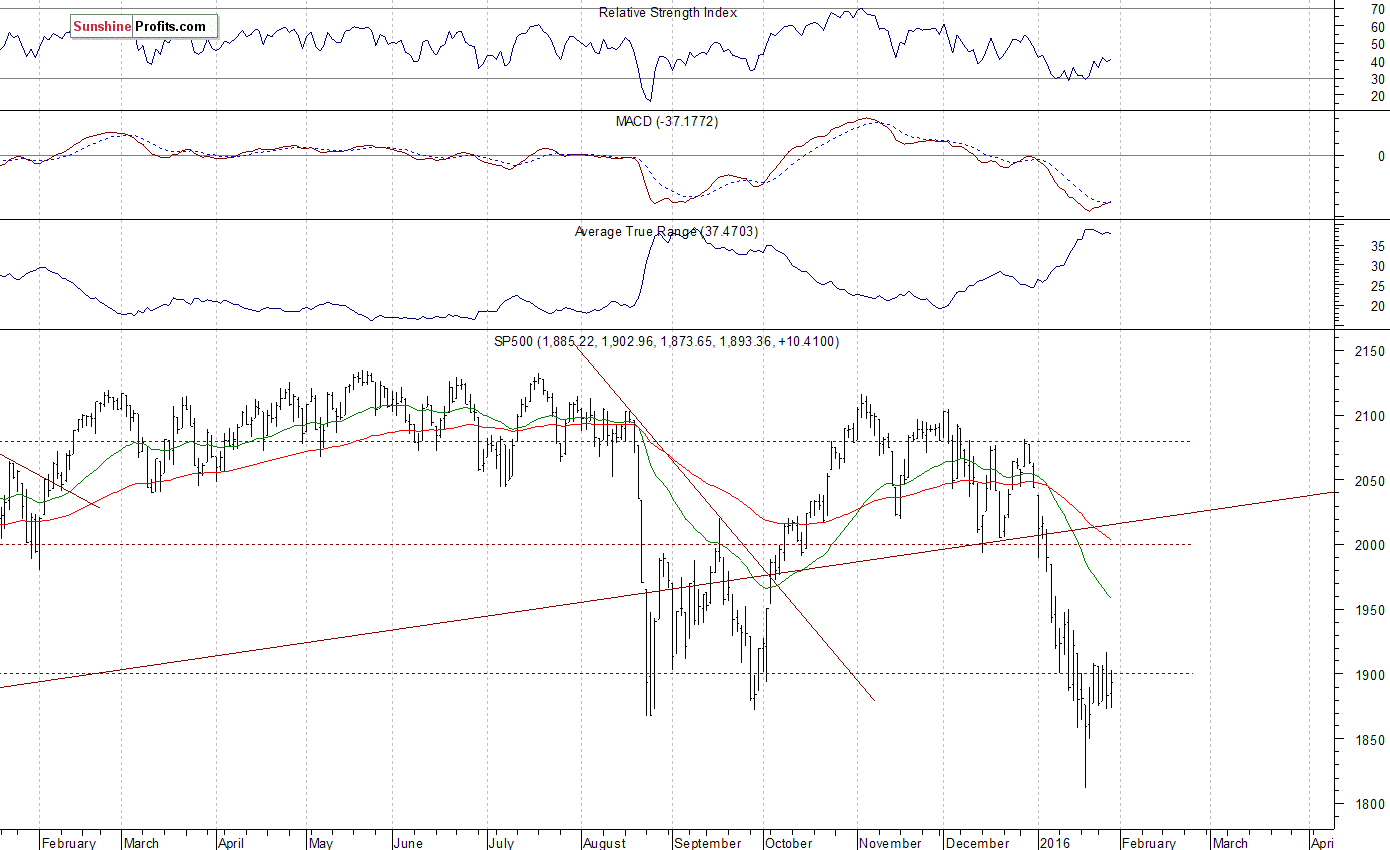
The main U.S. stock market indexes gained 0.8-1.4% on Thursday, retracing some of their Wednesday's decline while extending short-term consolidation, as investors reacted to quarterly corporate earnings releases, economic data announcements. The S&P 500 index continues to trade along the level of 1,900. It remains within a relatively tight trading range this week. The nearest important level of resistance is at around 1,900-1,920, marked by local highs. On the other hand, support level is at 1,850-1,880, marked by recent local lows. For now, it looks like a correction within a downtrend. The market fluctuates following first half of the month sell-off. There have been no confirmed positive signals so far. Last year's August - September lows continue to act as a medium-term support level, as we can see on the daily chart:
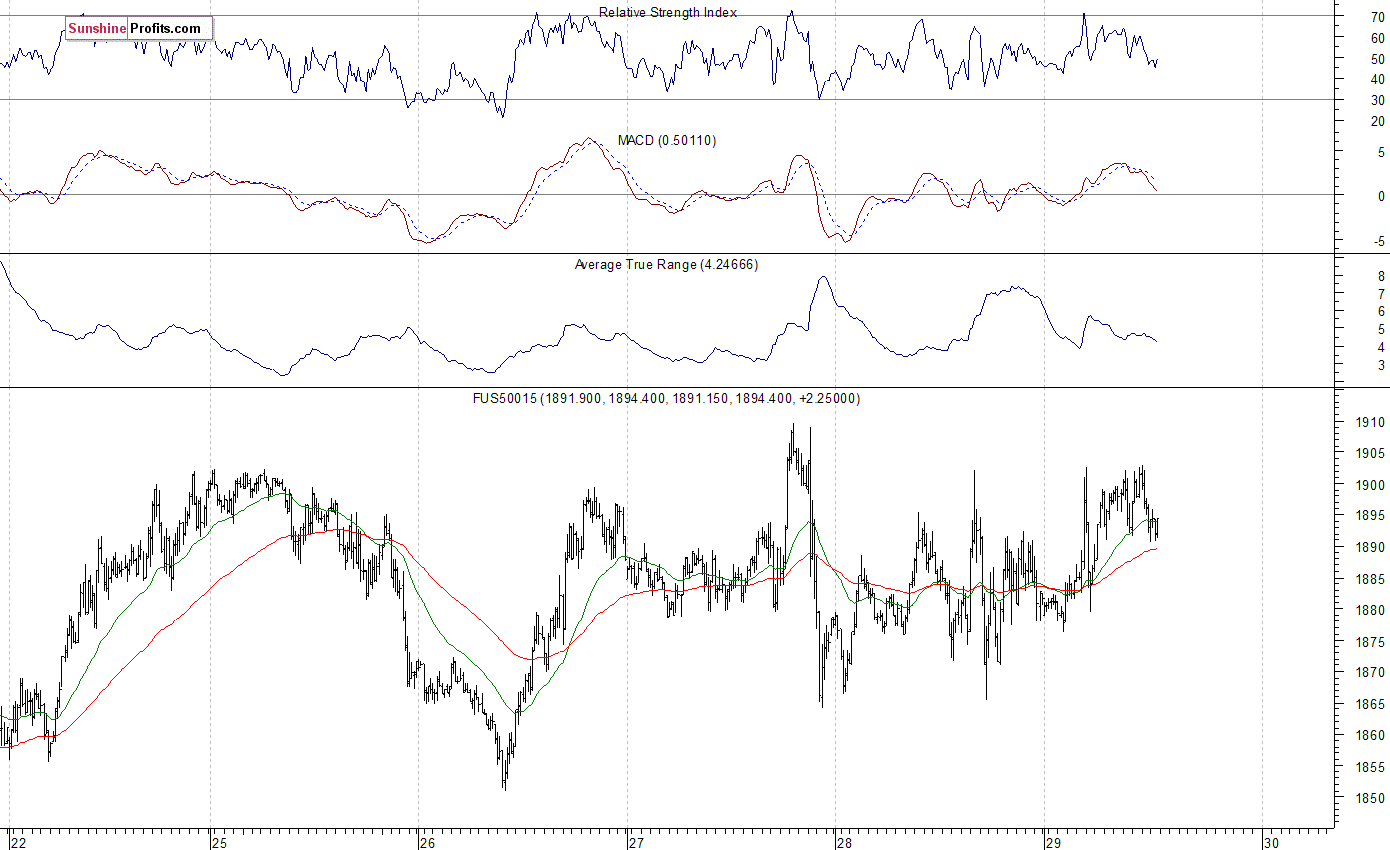
Expectations before the opening of today's trading session are positive, with index futures currently up 0.5-0.6%. The main European stock market indexes have gained 0.6-0.8% so far. Investors will now wait for economic data releases: GDP number at 8:30 a.m., Chicago PMI at 9:45 a.m., Michigan Sentiment - Final at 10:00 a.m. The S&P 500 futures extends its yesterday's move up, as investors react to Bank of Japan's negative interest rate decision release. However, the nearest important level of resistance remains at around 1,900-1,910, marked by recent local highs. On the other hand, support level is at 1,850-1,860. There is no clear short-term direction, as the market extends its fluctuations along the level of 1,900:
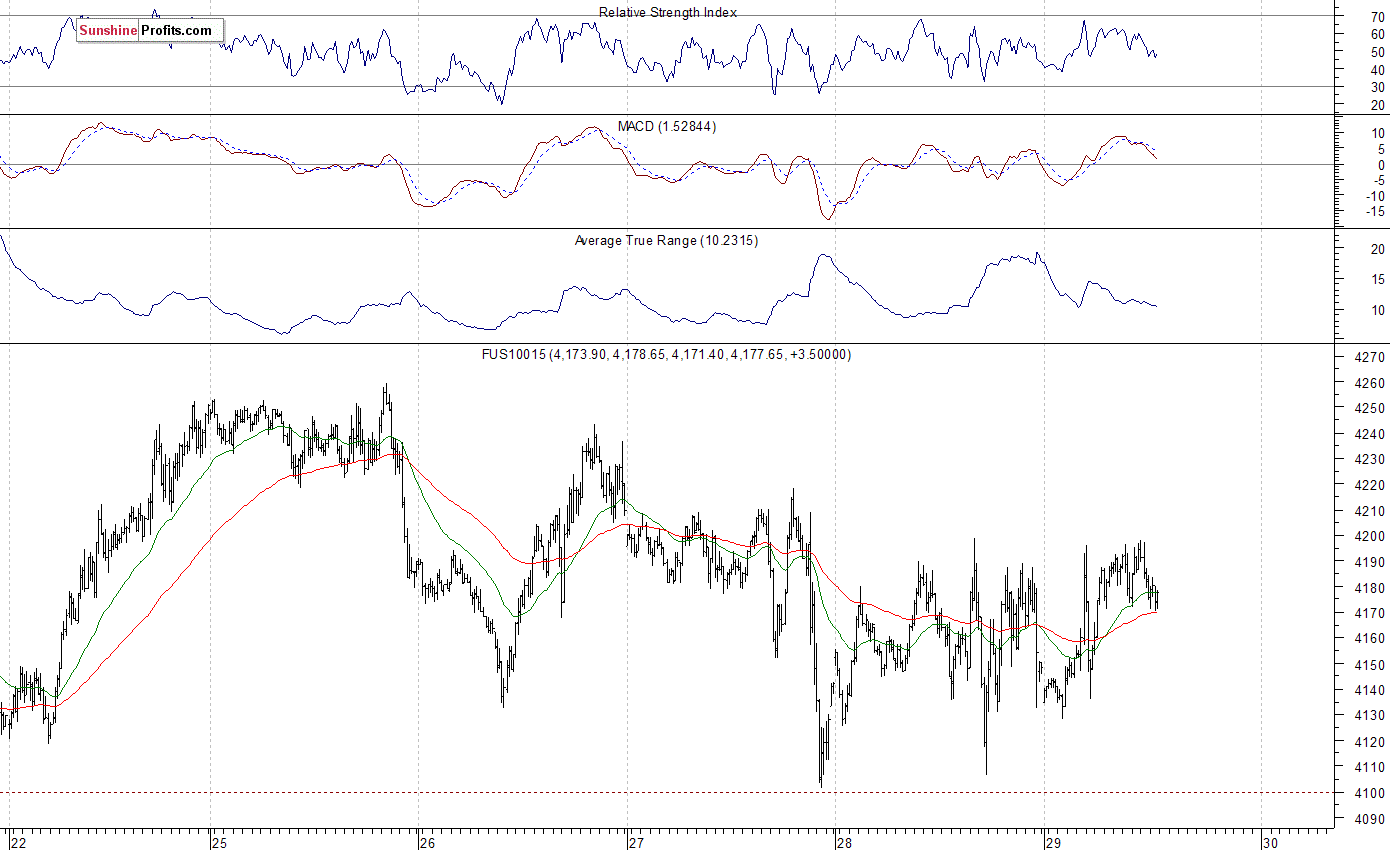
The technology Nasdaq 100 futures contract follows a similar path, as it continues to trade below the level of 4,200. The nearest important level of support is at around 4,100-4,150. Is this a consolidation before new uptrend, or just correction following first half of the month sell-off?
Concluding, the broad stock market extended its short-term fluctuations on Thursday, as the S&P 500 index remained close to 1,900 mark. These short-term fluctuations follow first half of the month move down. There have been no confirmed positive signals so far. The index may continue to trade along its last year's August - September local lows for some time, as they act as a medium-term level of support. We still prefer to be out of the market, avoiding low risk/reward ratio trades. We will let you know when we think it is safe to get back in the market.
Thank you.
Paul Rejczak
Stock Trading Strategist
Stock Trading Alerts

