
Briefly: In our opinion, no speculative positions are justified.
Our intraday outlook is neutral, and our short-term outlook is neutral. Our medium-term outlook remains bearish, as the S&P 500 index extends its lower highs, lower lows sequence. However, we decided to change our long-term outlook to neutral recently, following recent move down below medium-term lows:
Intraday outlook (next 24 hours): neutral
Short-term outlook (next 1-2 weeks): neutral
Medium-term outlook (next 1-3 months): bearish
Long-term outlook (next year): neutral
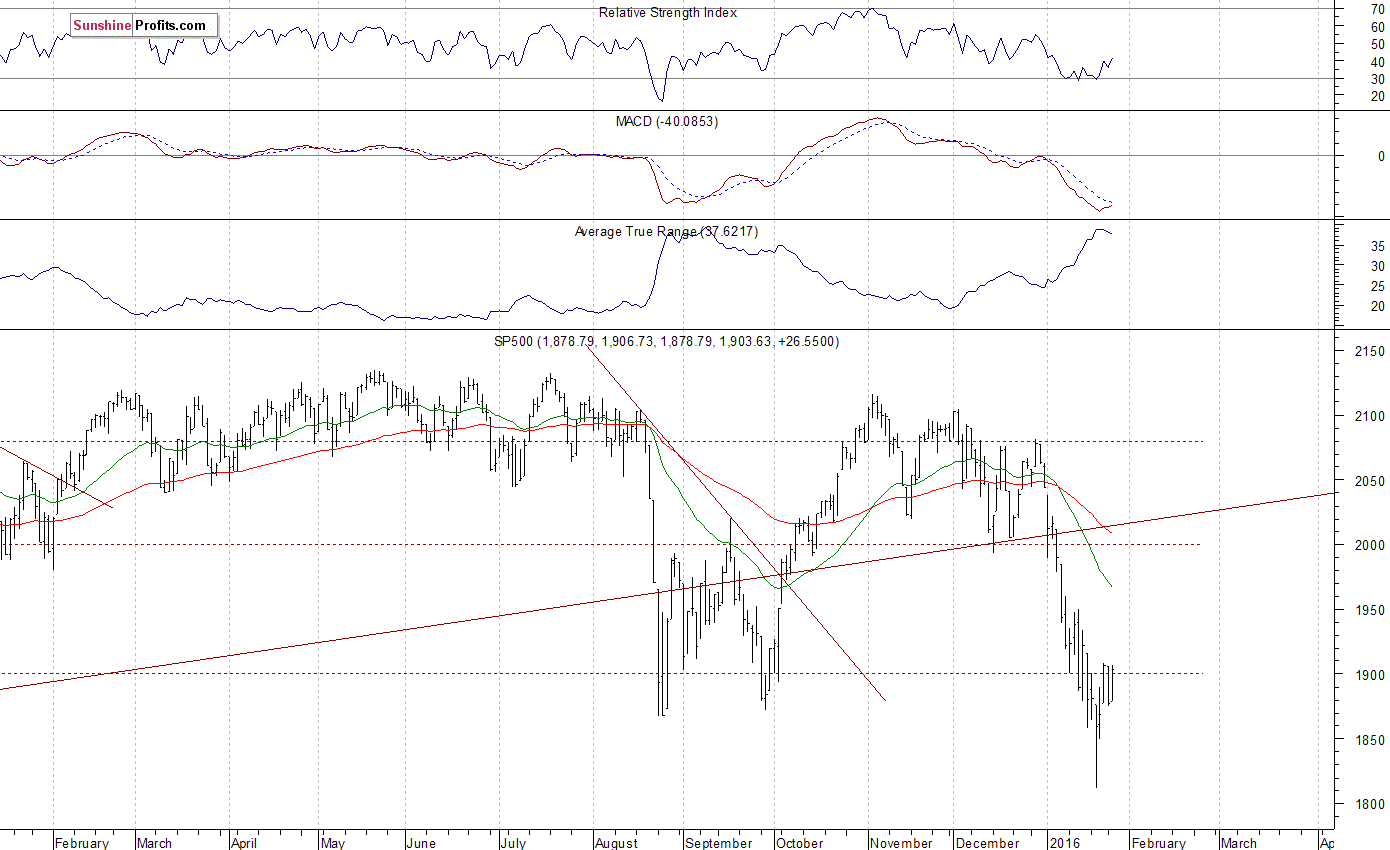
The U.S. stock market indexes gained 0.9-1.8% on Tuesday, retracing their Monday's move down, as investors continued to hesitate following first half of the month's move down. The S&P 500 index remains within a short-term consolidation along the level of 1,900. It currently trades around 10 percent below its last year's May all-time high. For now, it looks like a correction within a short-term downtrend. There have been no confirmed positive signals so far. The nearest important level of resistance is at 1,900-1,920. On the other hand, support level is at 1,850-1,880, marked by recent local lows, as we can see on the daily chart:
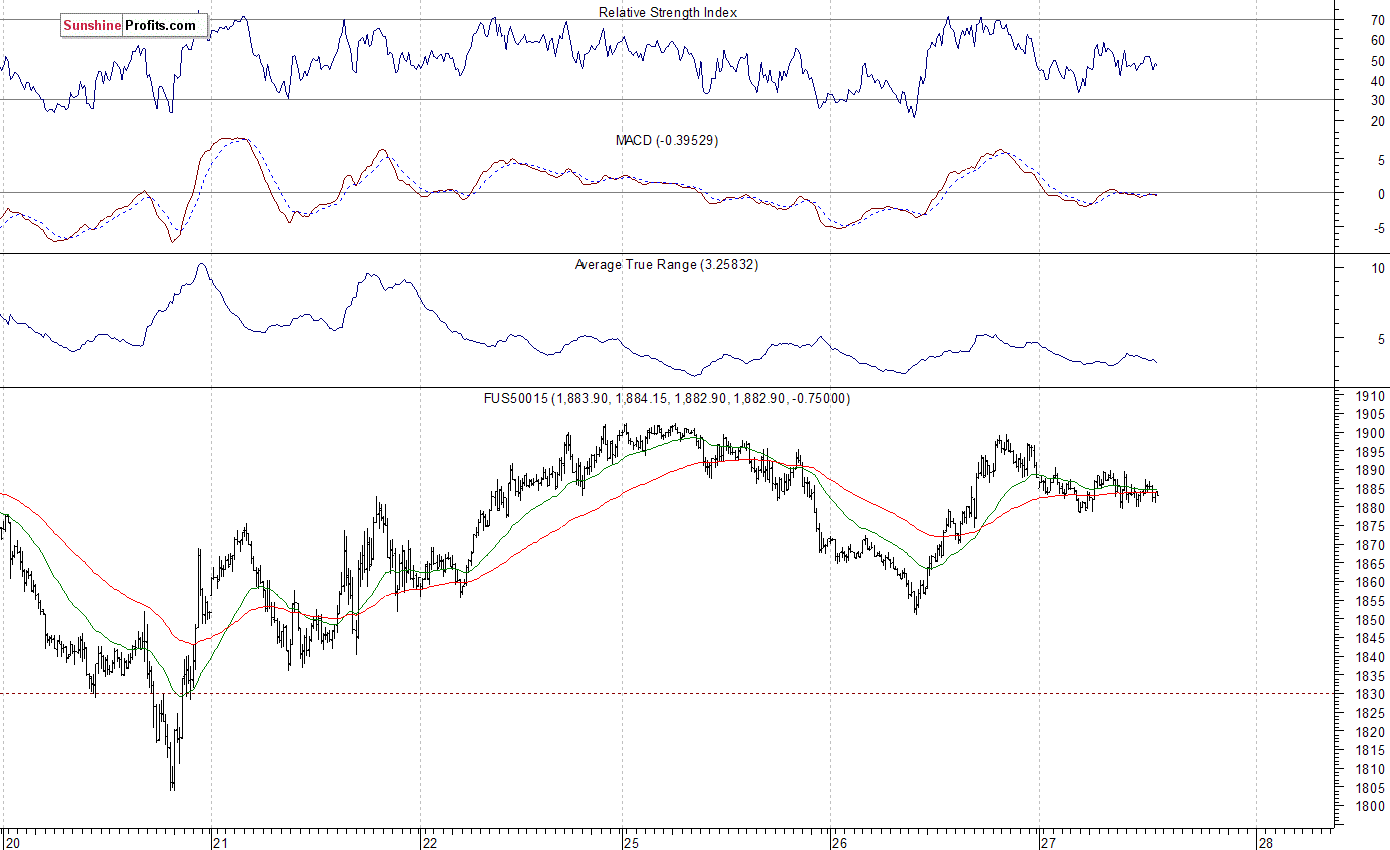
Expectations before the opening of today's trading session are negative, with index futures currently down 0.3-0.9%. The main European stock market indexes have lost 0.4-0.6% so far. Investors will now wait for some economic data announcements: New Home Sales number at 10:00 a.m., Crude Inventories at 10:30 a.m. There will also be the FOMC Rate Decision release at 2:00 p.m. However, the Fed is expected to leave interest rates unchanged following slowdown in China, weak commodity prices. The S&P 500 futures contract trades within an intraday consolidation, after recent volatility. The nearest important level of resistance is at around 1,900, marked by yesterday's local high. On the other hand, support level is at 1,850-1,870, among others. There is no clear short-term direction. However, we can see some increased volatility, as the 15-minute chart shows:
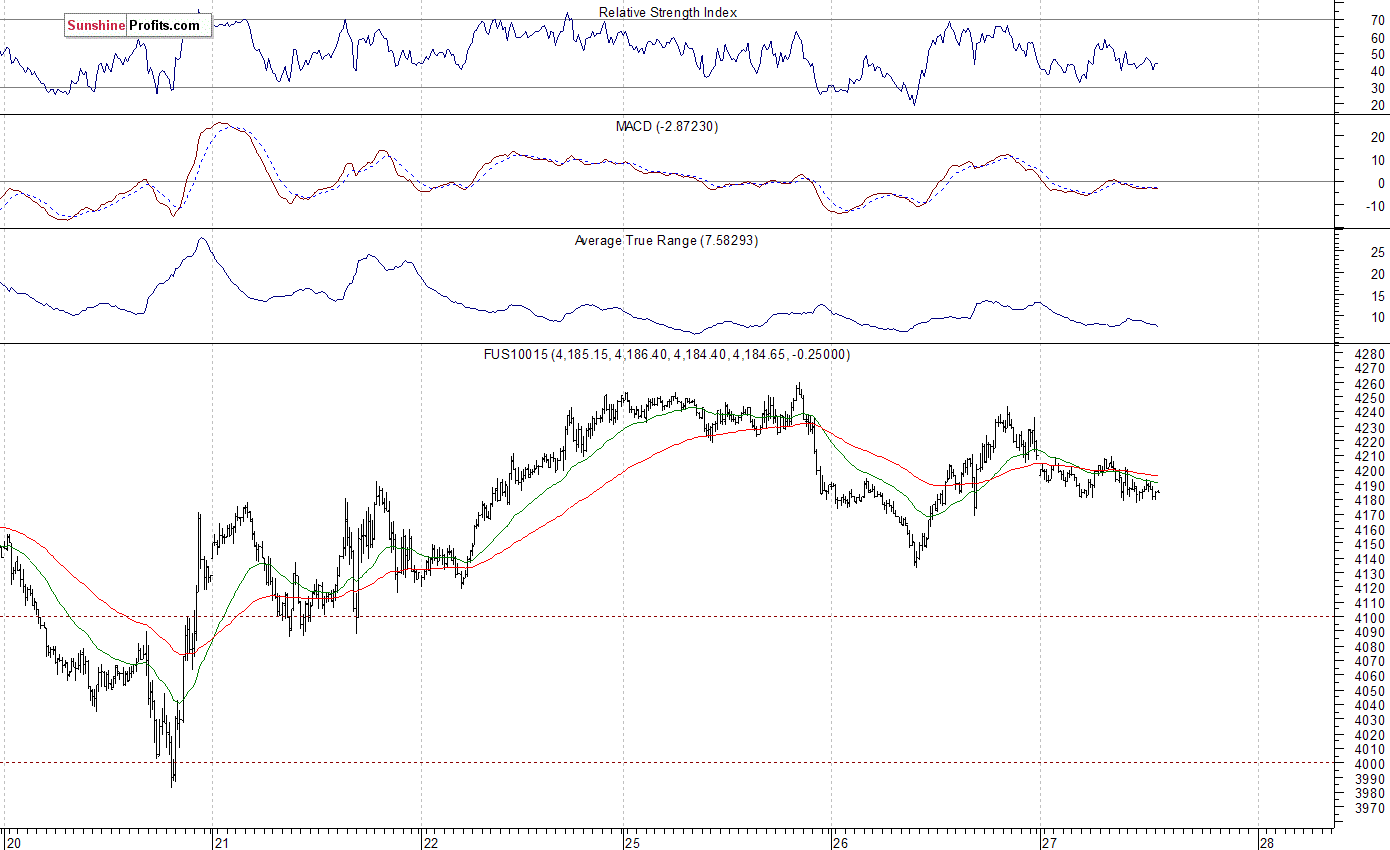
The technology Nasdaq 100 futures contract follows a similar path, as it continues to trade along the level of 4,200. The technology sector is relatively weaker than the broad stock market today morning, as investors react to yesterday's Apple's quarterly earnings release. The nearest important level of resistance is at around 4,230-4,250, and support level remains at 4,130-4,150. For now, it is a short-term consolidation, and a relatively flat correction following first half of the month sell-off:
Concluding, the broad stock market retraced its Monday's move down yesterday, as the S&P 500 index got back above 1,900 mark. There is no clear short-term direction. The index may continue to trade along its last year's August - September local lows for some time, as they act as a medium-term level of support. We still prefer to be out of the market, avoiding low risk/reward ratio trades. We will let you know when we think it is safe to get back in the market.
Thank you.
Paul Rejczak
Stock Trading Strategist
Stock Trading Alerts

