
Briefly: In our opinion, no speculative positions are justified.
Our intraday outlook is neutral, and our short-term outlook is neutral. Our medium-term outlook remains bearish, as the S&P 500 index extends its lower highs, lower lows sequence. However, we decided to change our long-term outlook to neutral, following recent move down below medium-term lows:
Intraday outlook (next 24 hours): neutral
Short-term outlook (next 1-2 weeks): neutral
Medium-term outlook (next 1-3 months): bearish
Long-term outlook (next year): neutral
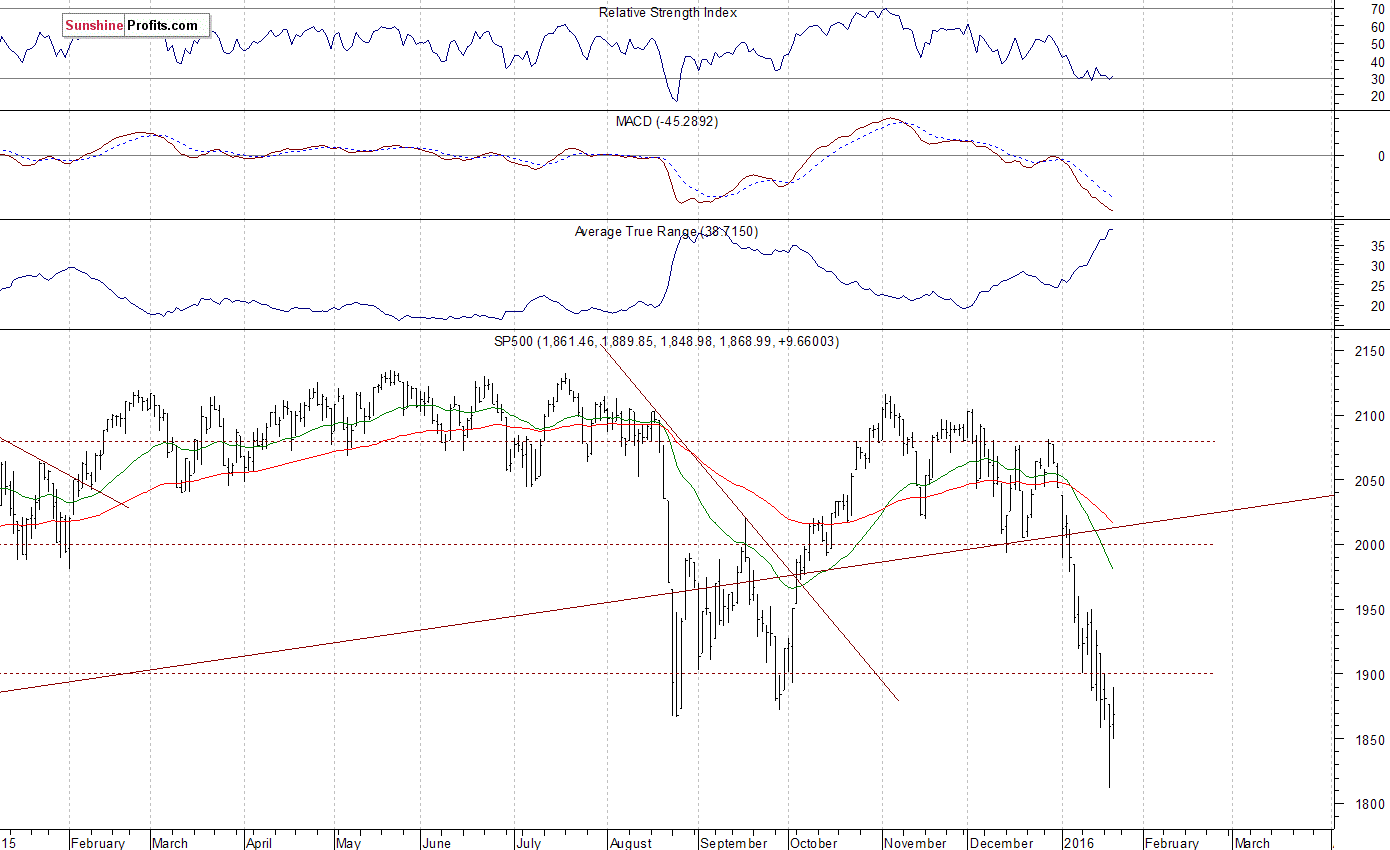
The main U.S. stock market indexes gained 0.2-0.7% on Thursday, retracing some of their recent move down, as investors reacted to oil prices rebound, economic data releases. The S&P 500 index extended its Wednesday's bounce off long-term support level at 1,800-1,820. On the other hand, resistance level is at 1,870-1,900, marked by previous medium-term local lows. The next important level of resistance is at around 1,950. There have been no confirmed positive signals so far. However, we can see some more bullish action recently. Will the short-term downtrend reverse? The resistance area at 1,870-1,900 seems crucial. For now, it looks like an upward correction following recent move down:
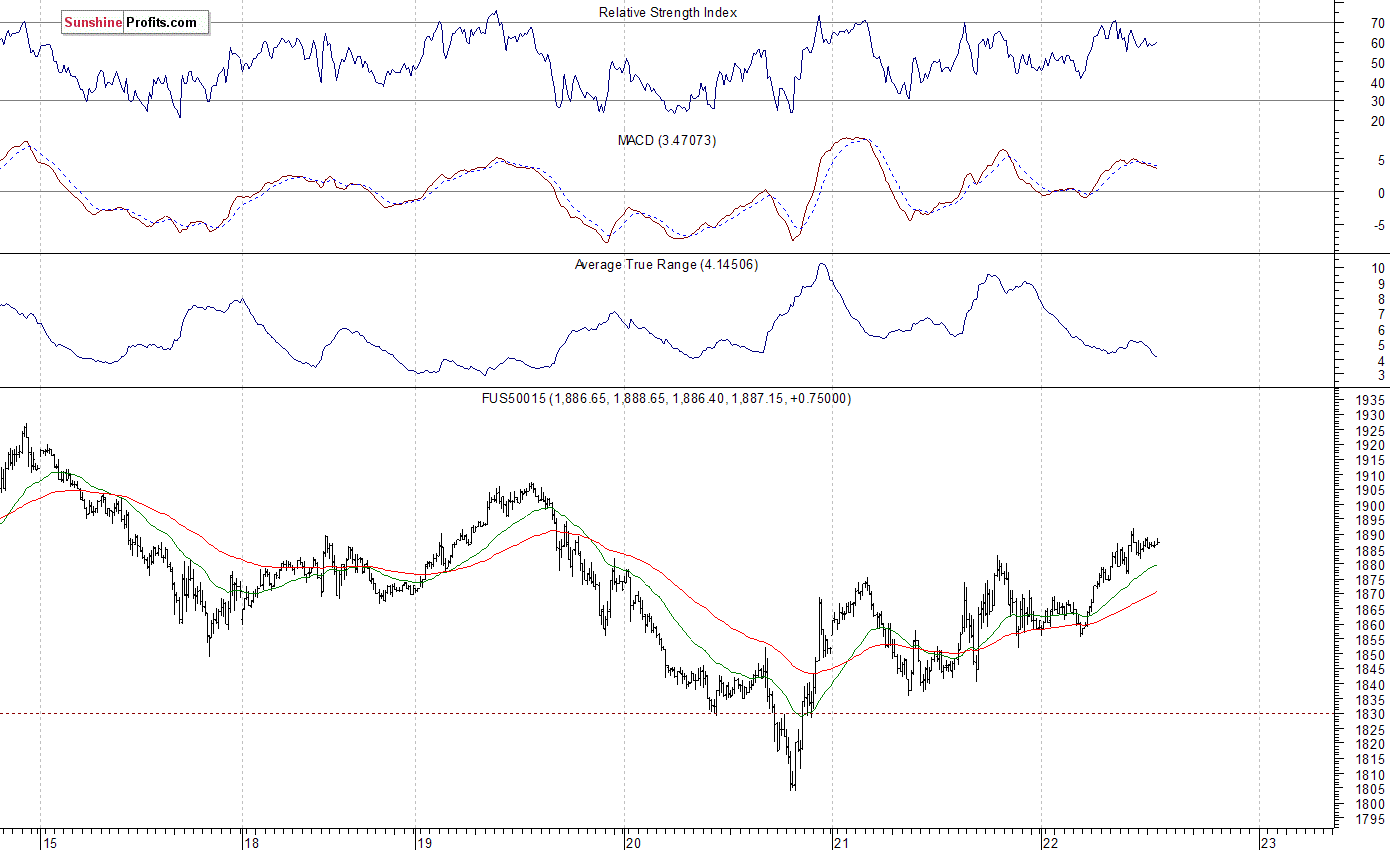
Expectations before the opening of today's trading session are very positive, with index futures currently up 1.2-1.7%. The European stock market indexes have gained 2.0-3.2% so far. Investors will now wait for some economic data announcements: Existing Home Sales, Leading Indicators at 10:00 a.m. The S&P 500 futures contract trades within an intraday uptrend, as it continues its yesterday's move up. The nearest important level of resistance is at around 1,900 mark. On the other hand, support level remains at 1,850. For now, it looks like a correction within a recent downtrend. However, this rebound may extend even further, as investors react to some more bullish global stock markets' action, oil prices rebound. There have been no confirmed short-term negative signals so far:
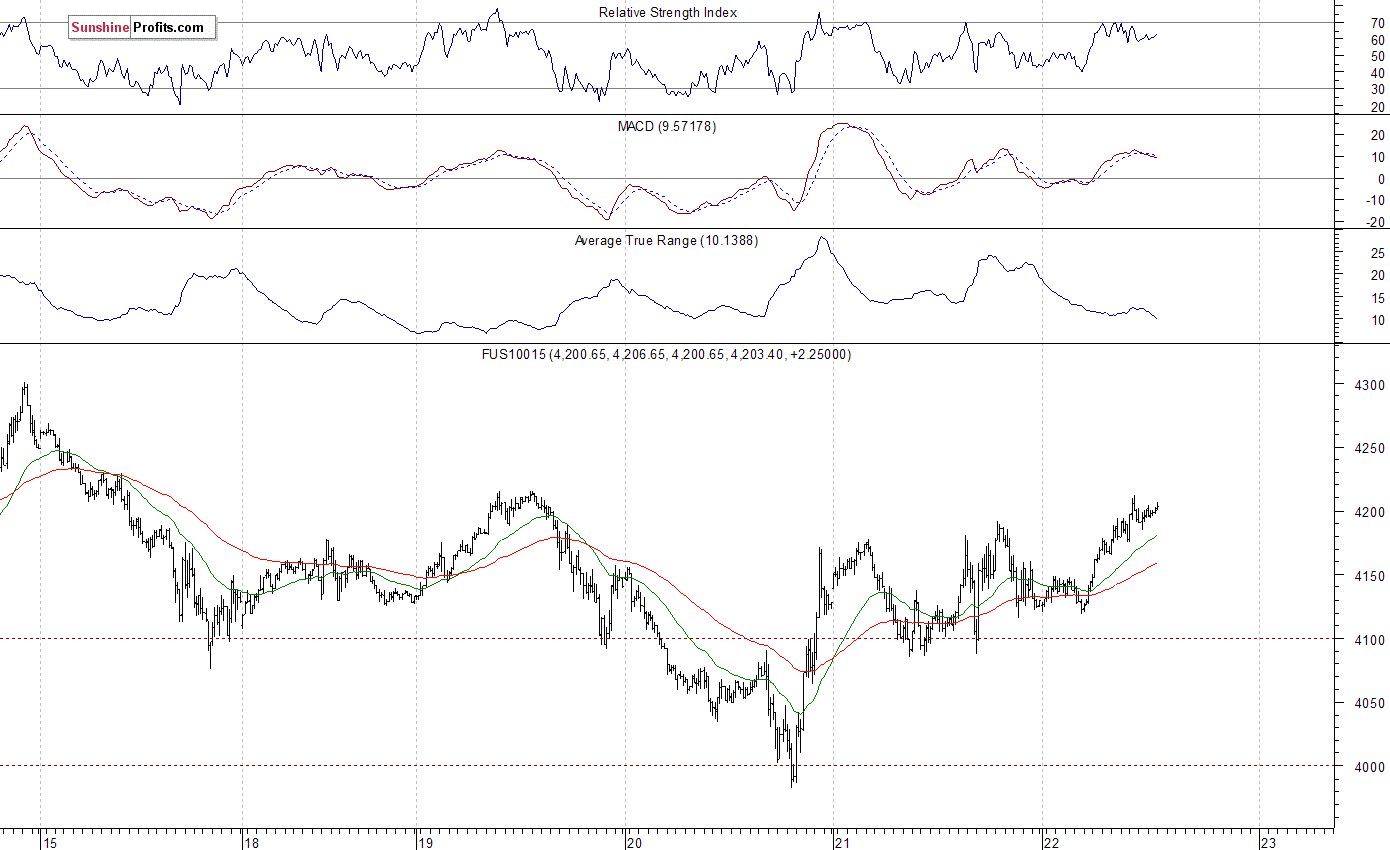
The technology Nasdaq 100 futures contract follows a similar path, as it currently trades along the level of 4,200. It is worthwhile to mention that it traded below the level of 4,000 on Wednesday. The nearest important level of support is at around 4,100-4,150, among others. The resistance level is at 4,250-4,270, marked by some previous intraday local highs. Is this a downtrend reversal or just a quick "oversold" rebound before another leg down? For now, it looks like a correction within a short-term downtrend. However, we can see some clearly bullish action here:
Concluding, the broad stock market continued its short-term bounce yesterday, as the S&P 500 index got closer to previous support level of 1,870-1,900. Investors expect this move up to extend today, as the index futures trade considerably higher this morning, following Asian stock markets' rally. For now, it looks like an upward correction, but we can see investors' sentiment improvement. Our speculative long position (1,891.68, S&P 500 index) has been closed at the stop-loss level of 1,840 (S&P 500 index) on Wednesday, as the futures contract broke slightly below the level of 1,835 ahead of the cash market's opening (it currently trades around 5 points lower than the cash market). We prefer to be out of the market, avoiding low risk/reward ratio trades. We will let you know when we think it is safe to get back in the market.
Thank you.
Paul Rejczak
Stock Trading Strategist
Stock Trading Alerts

