
Briefly: In our opinion, no speculative positions are justified.
Our intraday outlook is now neutral, and our short-term outlook is neutral. Our medium-term outlook remains bearish, as the S&P 500 index extends its lower highs, lower lows sequence:
Intraday outlook (next 24 hours): neutral
Short-term outlook (next 1-2 weeks): neutral
Medium-term outlook (next 1-3 months): bearish
Long-term outlook (next year): bullish
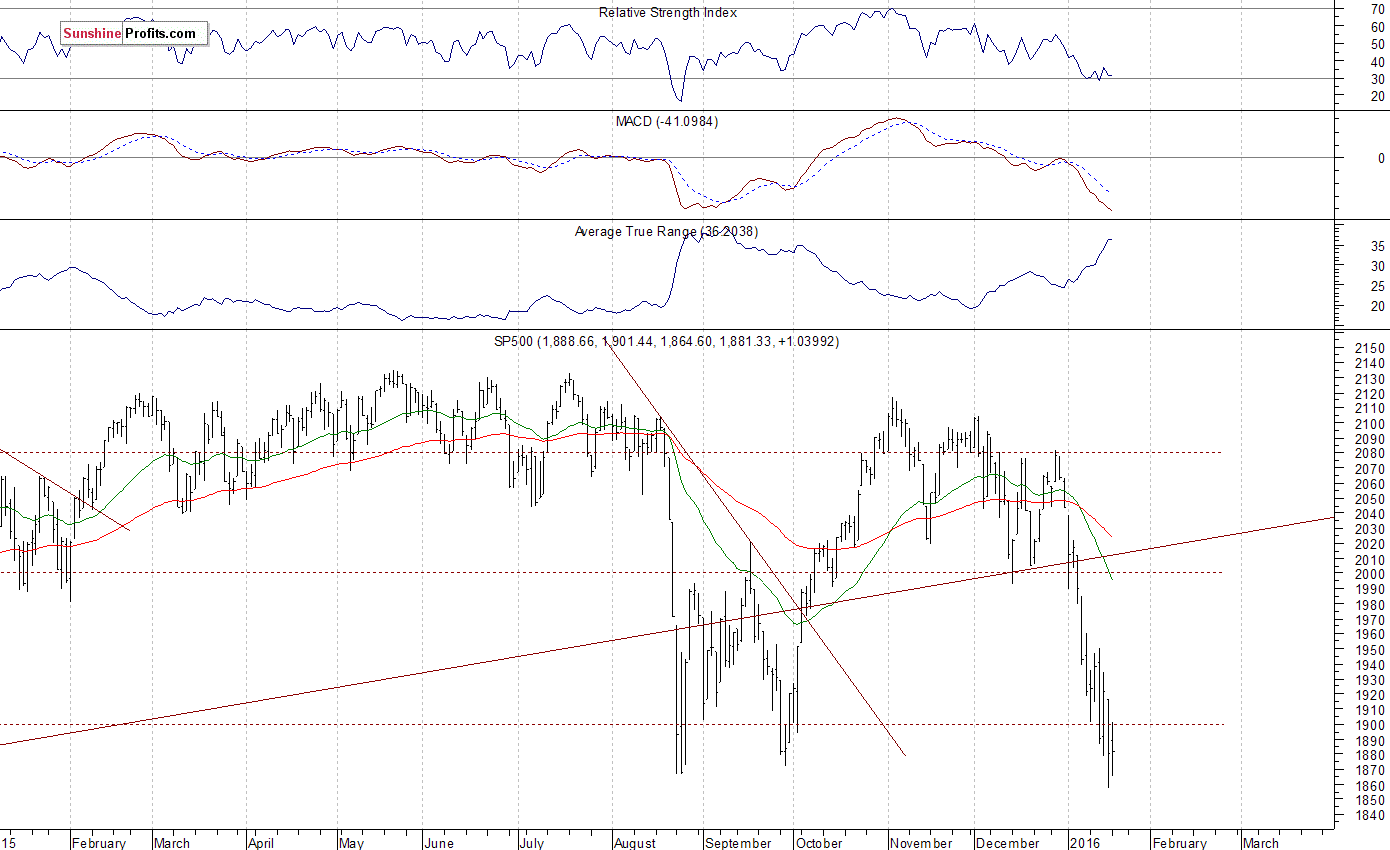
The U.S. stock market indexes gained 0.1-0.2% on Tuesday, extending their short-term fluctuations following recent move down. The S&P 500 index remained within its Friday's trading range, just below the level of 1,900. The nearest important level of resistance is at around 1,900, marked by previous support level. The next important level of resistance is at 1,930-1,950. On the other hand, support level is at 1,860-1,870, marked by previous local lows. The next important level of support is at around 1,820, marked by October 2014 medium-term low. We can see oversold conditions accompanied by an increased volatility which may lead to an upward correction or downtrend reversal at some point. The index may gap down today, breaking below previous local lows. Is this some form of a capitulation, or just downtrend's continuation? For now, it looks like potential short-term bottom before an upward correction. However, there have been no confirmed short-term positive signals so far:
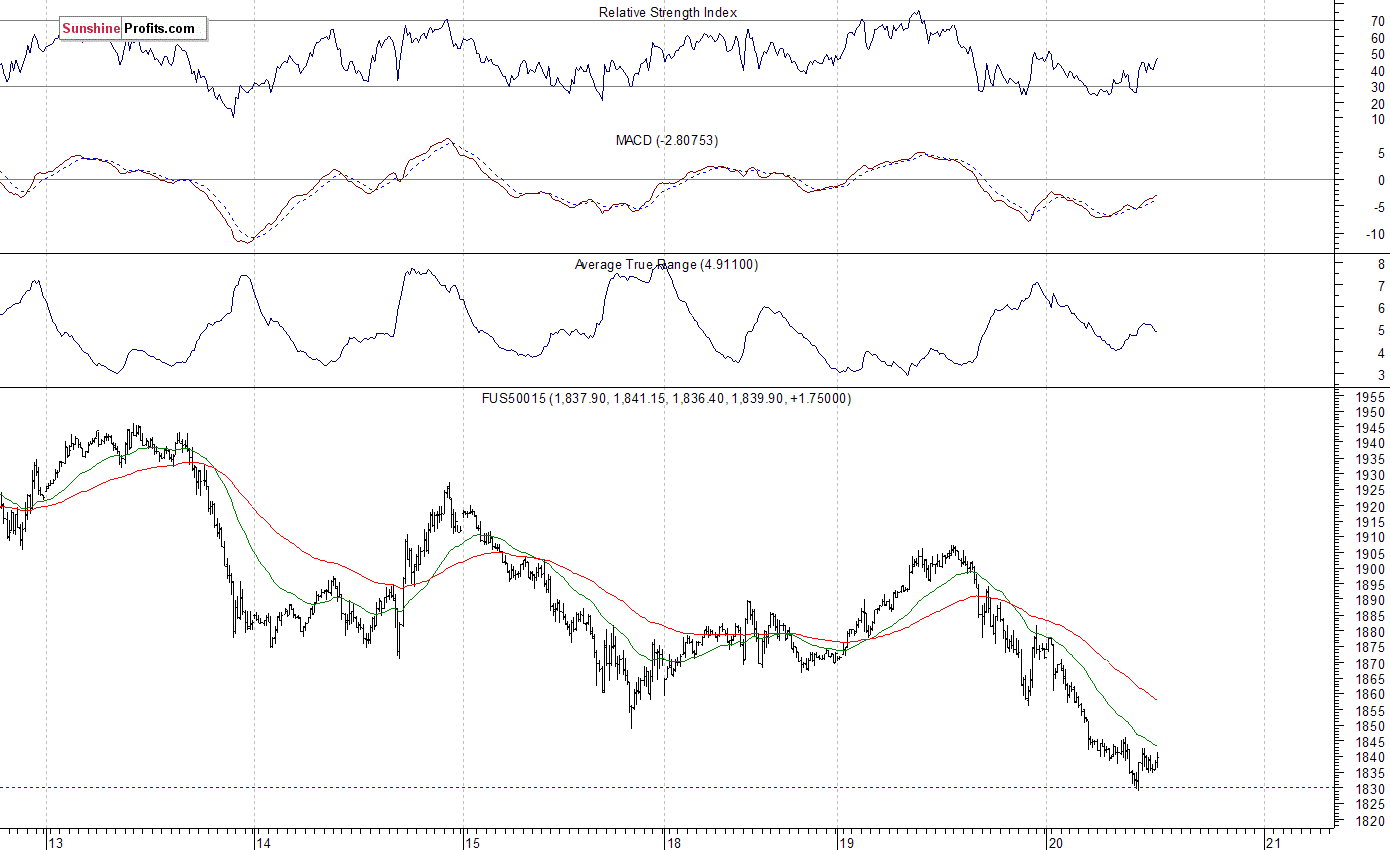
Expectations before the opening of today's trading session are very negative, with index futures currently down 1.8-2.0%. The European stock market indexes have lost 2.9-3.0% so far. Investors will wait for some economic data announcements: Consumer Price Index, Housing Starts, Housing Permits at 8:30 a.m., Crude Inventories at 10:30 a.m. The S&P 500 futures contract trades within an intraday downtrend, as it extends its recent sell-off. The nearest important level of resistance is at around 1,850, marked by previous local low. On the other hand, support level is at 1,800-1,820, among others, as we can see on the 15-minute chart:
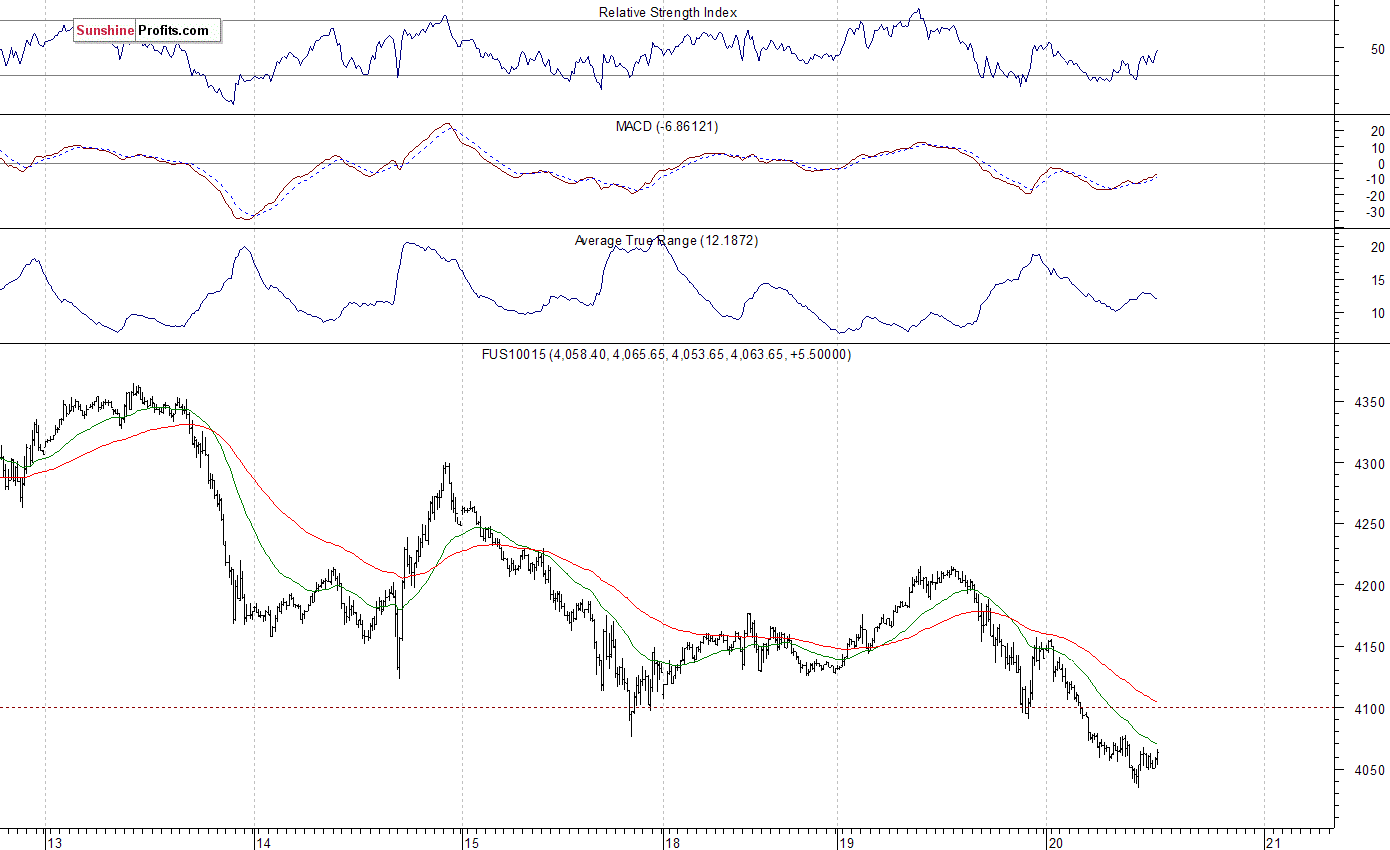
The technology Nasdaq 100 futures contract extends its short-term downtrend, as it currently trades below the level of 4,100. The nearest important level of support is at around 4,000. There have been no confirmed short-term positive signals so far. However, we can see some short-term oversold conditions:
Concluding, the broad stock market remained within its Friday's trading range yesterday. For now, it looks like a flat correction following a downtrend, as the expectations before the opening of today's trading session are negative and the S&P 500 is likely to continue its decline. There have been no confirmed positive signals so far. However, we still can see some oversold conditions. Our speculative long position (1,891.68, S&P 500 index) has been closed at the stop-loss level of 1,840 (S&P 500 index), as the futures contract broke slightly below the level of 1,835 this morning (it currently trades around 5 points lower than the cash market). We prefer to be out of the market, avoiding low risk/reward ratio trades. We will let you know when we think it is safe to get back in the market.
Thank you.
Paul Rejczak
Stock Trading Strategist
Stock Trading Alerts

