
Briefly: In our opinion, speculative long positions are favored (with stop-loss at 1,840, and profit target at 1,990, S&P 500 index)
Our intraday outlook is bullish, and our short-term outlook is bullish. However, our medium-term outlook remains bearish, as the S&P 500 index extends its lower highs, lower lows sequence:
Intraday outlook (next 24 hours): bullish
Short-term outlook (next 1-2 weeks): bullish
Medium-term outlook (next 1-3 months): bearish
Long-term outlook (next year): bullish
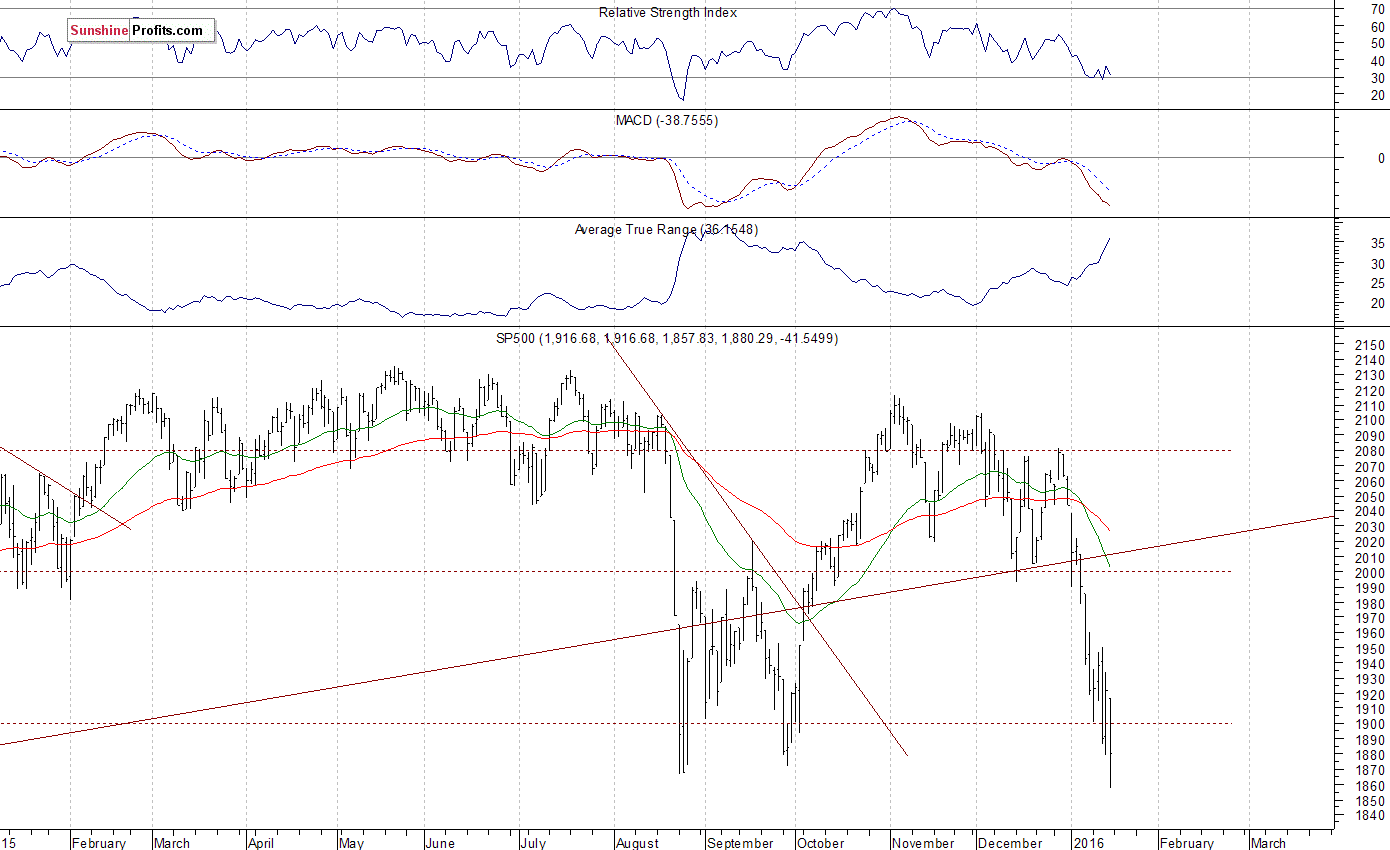
The main U.S. stock market indexes lost between 2.2% and 3.1% on Friday, retracing their Thursday's move up and extending short-term downtrend, as investors reacted to further oil prices decline, economic data releases, among others. The S&P 500 index broke below its last year's August - September lows, before bouncing off slightly. The nearest important level of support is at around 1,860-1,870. On the other hand, resistance level is at 1,900, marked by previous support level. There have been no confirmed positive signals so far. However, we can see oversold conditions, accompanied by an increased volatility, which may lead to an upward correction or downtrend reversal. Is this just a flat correction following move down or some bottoming pattern before downtrend's reversal?
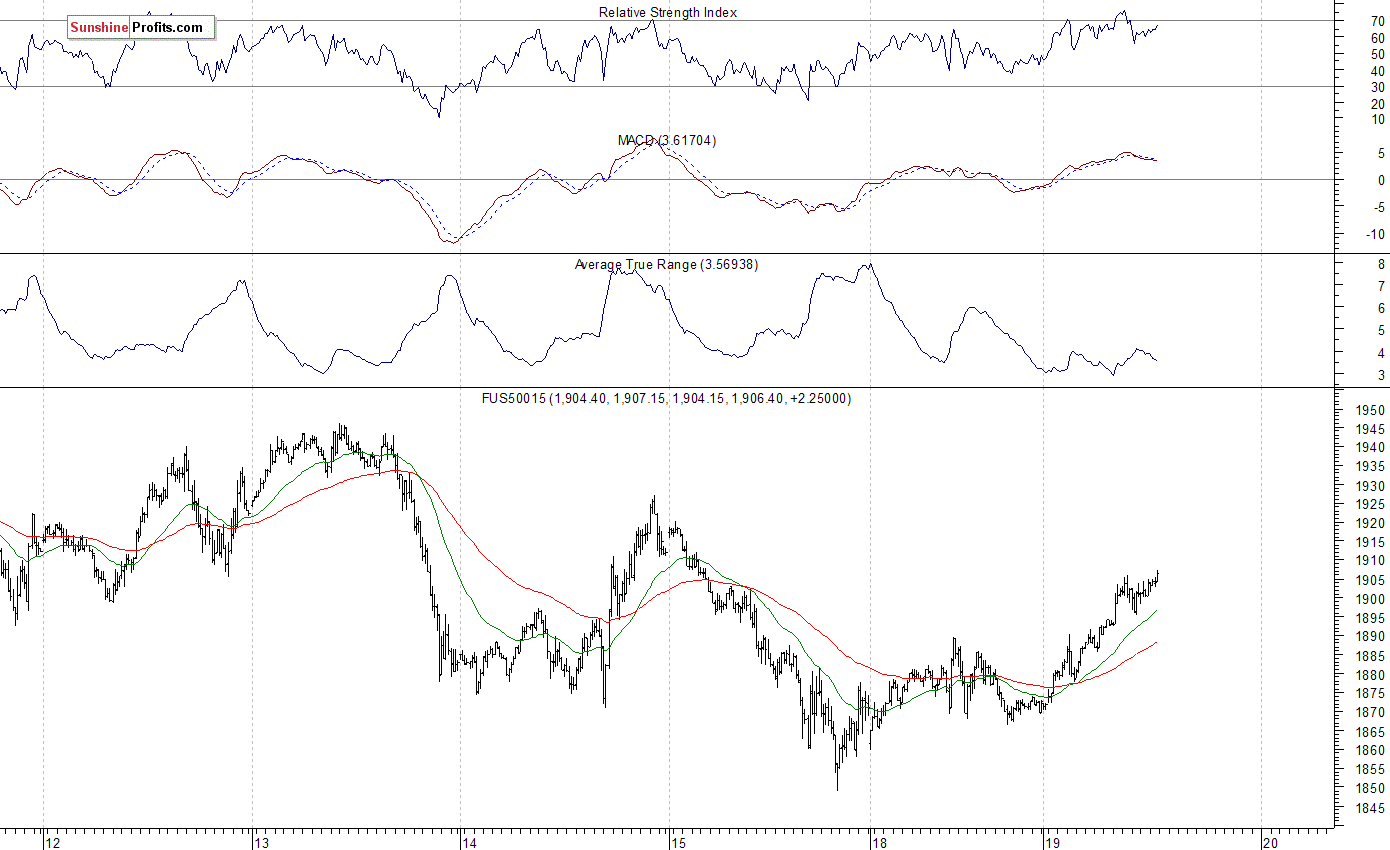
Expectations before the opening of today's trading session are very positive, with index futures currently up 1.8-2.0%. The European stock market indexes have gained 2.1-2.5% so far. Investors will now wait for the NAHB Housing Market Index release at 10:00 a.m. The S&P 500 futures contract trades within an intraday uptrend, as it retraces some of its Friday's decline. The nearest important level of resistance is at around 1,920-1,930, marked by Friday's local high. On the other hand, support level is at 1,880, among others. We can see volatile short-term consolidation. Is this a flat correction within a downtrend or some bottoming pattern before downtrend's reversal. There have been no confirmed positive signals so far:
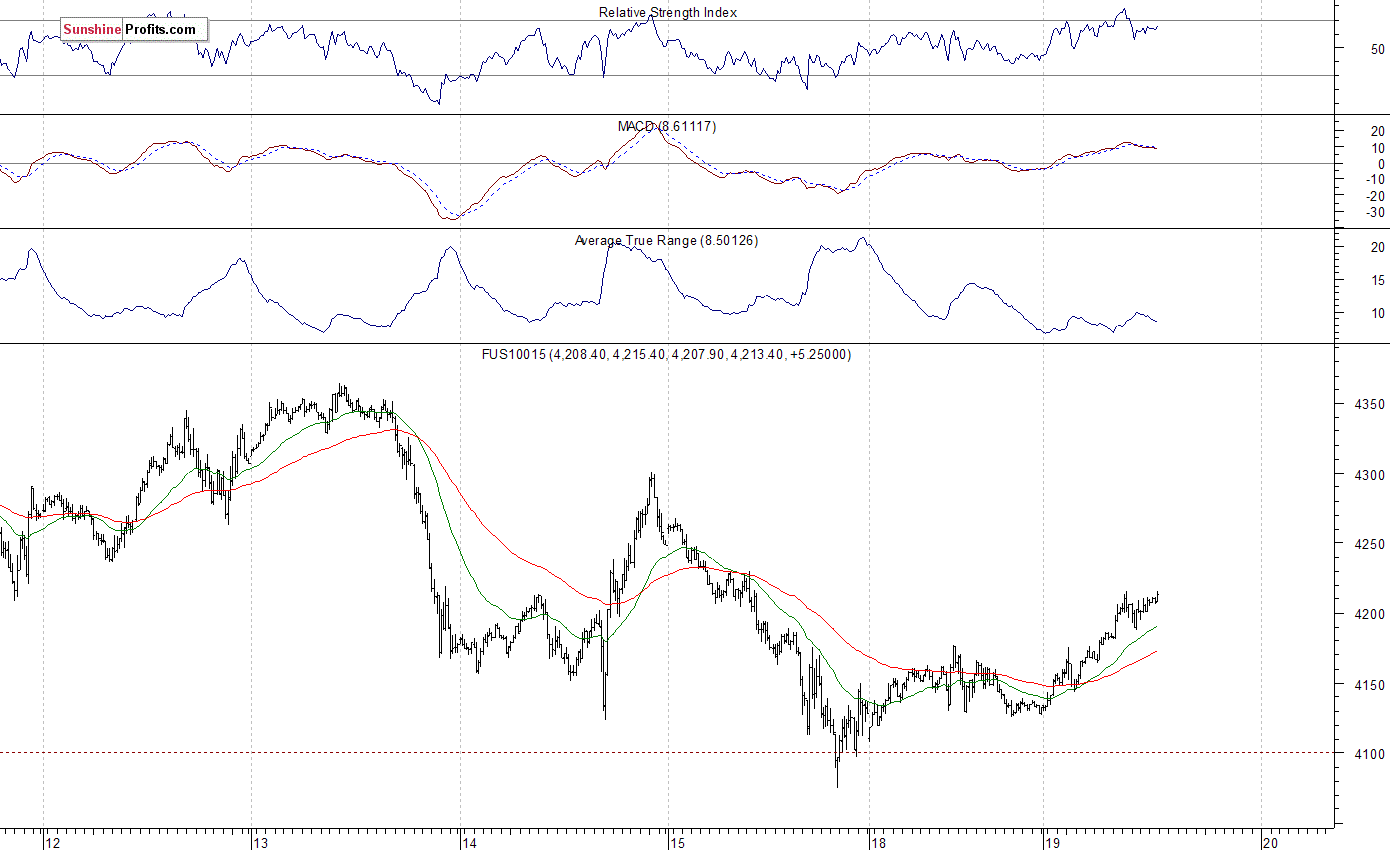
The technology Nasdaq 100 futures contract follows a similar path, as it retraces its Friday's move down. It currently trades above 4,200 mark, as it continues its bounce off sub-4,100 level on Friday. Will this short-term uptrend continue? Or is it just an upward correction? We can see an increased volatility, which sometimes precedes trend reversal:
Concluding, the broad stock market continued its short-term downtrend on Friday, as the S&P 500 index temporarily broke below its last year's August - September lows. Expectations before the opening of today's trading session are positive, but will this bullish sentiment last? We can see short-term technical oversold conditions accompanied by an increased volatility which may lead to an upward correction or downtrend reversal at some point. There have been no confirmed positive signals so far. However, we continue to maintain our speculative long position (1,891.68, S&P 500 index). We expect an upward correction or short-term downtrend reversal. Stop-loss level is at 1,840, and potential profit target level is at 1,990, marked by resistance level of 1,980-2,000. You can trade S&P 500 index using futures contracts (S&P 500 futures contract - SP, E-mini S&P 500 futures contract - ES) or an ETF like the SPDR S&P 500 ETF - SPY. It is always important to set some exit price level in case some events cause the price to move in the unlikely direction. Having safety measures in place helps limit potential losses while letting the gains grow.
Thank you.
Paul Rejczak
Stock Trading Strategist
Stock Trading Alerts

